AUTOMATIC DETECTION OF SUB-KM CRATERS IN CTX IMAGERY. M. Machado, L. Bandeira, P. Pina, CERENA/IST/UL, Lisbon, Portugal, {marlene.machado, ...
45th Lunar and Planetary Science Conference (2014)
2131.pdf
AUTOMATIC DETECTION OF SUB-KM CRATERS IN CTX IMAGERY. M. Machado, L. Bandeira, P. Pina, CERENA/IST/UL, Lisbon, Portugal, {marlene.machado, lpcbandeira, ppina}@tecnico.ulisboa.pt.
Introduction: Craters are topographic features on planetary surfaces resulting from impacts of meteoroids. They are found on all hard-surface bodies in the solar system but are most abundant on bodies such as the Moon, Mars or Mercury where they can accumulate due to slow surface erosion rates. Importance of craters stems from their utility to provide relative chronology of different planetary surfaces [1, 2]; simply put, heavily cratered surfaces are relatively older than less cratered surfaces. Because statistics of crater sizes form the basis for geologic stratigraphy, crater counting is a routine activity in planetary science [3, 4]. Presently, most crater surveys are done by means of visual inspection of images resulting in databases which are either spatially comprehensive but restricted to only the largest craters [5, 6, 7, 8], or size comprehensive but limited to very specific geographical location. The size distribution of craters can be well approximated by the power-law [1]; large craters are rare and small craters are abundant. Counts of large craters must be collected from spatially extended regions in order to accumulate sufficient number of samples for accurate statistics. Thus, geologic stratigraphy based on manually collected databases has coarse spatial resolution. Finer spatial resolution of the stratigraphy can only be obtained from statistics of smaller craters, and the only viable means to obtain spatially comprehensive databases of smaller craters is through automating the process of crater detection. Although crater detection algorithms (CDAs) have been extensively researched (see [9, 10] for the overview), the previous research focused on detecting larger craters from coarse resolution images. Such CDAs are not expected to work well for detection of smaller craters from high resolution images. In this text we report on the development of CDA for surveying sub-kilometers size craters from high resolution images. Methodology: The purpose of this work is to contribute toward development of a CDA especially designed for surveying sub-kilometers size craters in high resolution planetary images. The key insight is an observation that discriminative features utilized to obtain a set of crater candidates do not have to be the same as discriminative features utilized to extract craters from the set of candidates. Our CDA is particularly well-suited for accurate selection of craters from amongst the candidates using the combination of Haarlike image texture features and a classifier [11], SVMSupport Vector Machines in the current study. Shape filters are used to identify crater candidates - portions
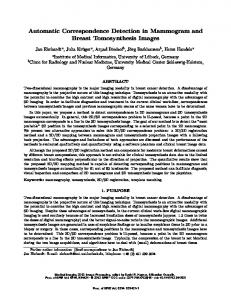
of an image that contain crescent highlight and shadow shapes indicating possible presence of craters [12], and then texture features are calculated for these crater candidates, such as in [13]. The features, collected from a small portion of candidates for which a label (crater or non-crater) is manually determined, are used to train the SVM classifier that is then utilized for classification of all other candidates into craters and non-craters. Dataset: To test the performance of our CDA we used a portion of the Mars Reconnaissance Orbiter CTX 5.91 m/pixel image of Mars (P06_003341). The selected scene is centered on Nanedi Valles (4.9ºN, 49.0ºW); it extends ~7,6 km (north-south) by ~2,2 km (east-west) and covers ~ 16,6 km2 of Noachian terrain. In this scene we have manually cataloged 5895 craters having diameters between 17 and 1731 meters. The Nanedi Valles passes through the scene introducing some heterogeneity of the terrain. A total of 94 craters and 188 non-crater candidates were selected from the west middle section to train the classifier. Note that the training set contains less than 10% of the craters in the scene (within the search range). Thus, our experiment corresponds to a likely use of the CDA, where the user wants to train the CDA on a small image and then use the CDA to find craters in the large image. Results: The objective of our CDA is, so far, to automatically survey craters larger than 200 m (34 pixels) but smaller than 1 km (170 pixels) in diameter. The lower limit stems from the minimum number of pixels required by the classifier to make a determination with high quality, the upper limit is arbitrary – crater larger than 1 km in diameter on Mars have been already cataloged [14]. Figure 1 shows the results of applying our CDA to the test scene. To evaluate the performance of our CDA we measured the detection percentage D = 100 x TP/(TP + FN), the quality percentage Q = 100 x TP/(TP + FP + FN) the false detection rate FD = 100 x FP/(TP + FP) and the branching factor B = FP/TP. Here, TP stands for the number of true positive detections (detected craters that are actual craters), FP stands for the number of false positive detections (detected craters that are not), and FN stands for the number of false negative “detections” (non-detection of real craters). D can be treated as a measure of crater-detection performance, Q as an overall measure of algorithm performance, FD as a measure of false-detection performance, and B as a measure of delineation performance. Table 1 resumes these results.
45th Lunar and Planetary Science Conference (2014)
2131.pdf
Table 1: Performance of our CDA
Test site
D (%) 86.30
Q (%) 72.03
FD (%) 18.67
B 0.23
Conclusions: Our CDA combines the efficiency of shape analysis in identifying crater candidates with precision of texture features/SVM classifier in distinguishing between craters and non-craters. First, the weakest link (from the accuracy point of view) of the present algorithm is the shape-based identification of crater candidates, since most of the missed craters were already not identified in that stage. The training requirements are currently not oversized (less than 10% of the craters are utilized for training) and the performance of the algorithm is already relatively high (D = 86%, B = 0.23) for its utilization in research-oriented crater counting application, thus a larger and more representative training dataset must also be built. Acknowledgements: This work was funded by
FCT (Portugal) through project ANIMAR (PTDC/CTE-SPA/110909/2009) and support for MM and LB (SFRH/BPD/79546/2011). References: [1] Tanaka K.L. (1986) JGR-Planets, 91:E139–E158. [2] Wise D.U. and Minkowski G. (1980) NASA Tech. Memo 81, 776:122-124. [3] Hartmann W.K. (1999) MAPS, 34:167–177. [4] Hartmann W.K. and Neukum G. (2001) Space Sci. Rev., 96(1):165–194. [5] Andersson L.B. and Whitaker B.A. (1982) NASA Ref. Pub. 1097. [6] Barlow N.G. (1988) Icarus, 75: 285–305. [7] Herrick R. et al. (2011) Icarus, 215:452–454. [8] Salamuniccar G. et al. (2012) PSS, 60:236-247. [9] Bandeira L. et al. (2007) IEEE TGRS, 45(12):4008-4015. [10] Salamuniccar G. et al. (2011) PSS, 59(1): 111-131, 2011. [11] Bandeira L. et al. (2012) ASR, 49(1):64-74. [12] Urbach E.R. and Stepinski T.F. (2009) PSS, 57:880–887. [13] Martins et al. (2009) IEEE GRSL, 6(1):127-131. [14] Robbins S. and Hynek B. (2012) JGR-Planets, 117:E005004.
Figure 1 - Craters detected by our CDA in a 7,632x2,181 m2 test site captured in the CTX image P06_003341, with a resolution of 5.91 m/pixel. True detections are shown by green circles, false detections in red and missed craters in blue. Note that most of the larger craters are outside the detection size range.