P10.1 AUTOMATIC DETECTION OF WIND TURBINE CLUTTER USING DOPPLER SPECTRAL FEATURES
Kenta T. Hood1 ,3 ,∗, Sebastian M. Torres1 ,3 ,4 , and Robert D. Palmer2 ,3 1
School of Electrical and Computer Engineering, University of Oklahoma, Norman, Oklahoma, USA 2 School of Meteorology, University of Oklahoma, Norman, Oklahoma, USA 3 Atmospheric Radar Research Center, University of Oklahoma, Norman, Oklahoma, USA 4 CIMMS, University of Oklahoma and NOAA/National Severe Storms Laboratory, Norman, Oklahoma, USA
ABSTRACT Wind turbines built to generate electricity cause clutter contamination that is often difficult to distinguish from weather signals. As the country relies on wind power for a larger portion of its energy production, more wind farms are being built to meet this demand. More wind turbines within the range of weather radar increase unwanted clutter returns, which may affect users and other algorithms, that rely on uncontaminated weather data. Because the turbines are always at the same location, it would seem easy to identify where wind turbine clutter (WTC) contaminates the weather data. However, under certain atmospheric conditions, anomalous propagation (AP) of the radar beam can occur such that WTC corrupts weather data without the radar operator knowing of this contamination. As a first step in any mitigation scheme, an effective detection algorithm is needed to perform automatic flagging of contaminated data. The flagged data can then be censored or filtered out, thus reducing harmful effects that propagate to automatic algorithms, such as quantitative precipitation estimation (QPE). In this paper, both actual and simulated WTC data are used to study the characteristics of WTC to design a detection algorithm. It will be shown that unique spectral features of the Doppler spectrum related to WTC signatures can be used to classify the radar return as contaminated by WTC or not. These features can then be used in a fuzzy logic algorithm to improve the robustness of the detection algorithm.
1. INTRODUCTION Wind energy is gaining strong support as a “green” method of generating electricity throughout the world for several reasons. Supply uncertainties, the environmental impact of fossil fuels, and the increasing price of ∗ Corresponding author address: Kenta T. Hood, University of Oklahoma, School of Meteorology, 120 David L. Boren Blvd., Rm 5900, Norman, OK 73072-7307; e-mail:
[email protected]
sustaining current generation methods are some of the concerns wind power addresses (Department of Energy 2008). Wind power is common in many areas throughout the world and can provide clean power without worry that the supply is not renewable. With wind power being such a promising form of renewable energy, there is a collaborative effort to expand wind energy such that 20 percent of the nation’s energy in 2030 will be generated through wind power. While there are many positive outcomes from this effort, there are negative impacts of this expansion, one of which is the interference due to wind turbines on weather radar. The interference is already a problem for radars today but with the addition of thousands of wind turbines to meet the goal set by the Department of Energy, the problem will only get worse.
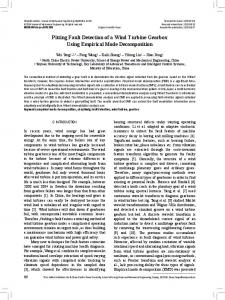
2. MOTIVATION Wind turbines are large structures, typically constructed of four main components: the tower, the nacelle, the rotor, and the blades as shown in Figure 1. The large size of these structures as well as the rotation of the blades cause interference for weather radar that is difficult to distinguish from typical meteorological signatures. This interference is commonly known as wind turbine clutter. The wind turbines cause returns that look similar to weather signals and are difficult to distinguish on a plan position indicator (PPI) plot. This contamination biases the estimates of the weather signal parameters commonly used to observe weather phenomena. In turn, biased base data carries through to other algorithms such as quantitative precipitation estimation (QPE) causing further problems to forecasters (Vogt et al. 2007). False tornado or mesocyclone detections have also been reported making forecasting even more difficult. Wind turbines are very much like other ground clutter targets as they do not move from one location to another. Ground clutter typically has zero velocity so an algorithm can be designed to mitigate this contamination. Conventional clutter filters such as Gaussian Model Adaptive Processing (GMAP) (Siggia and Pas-
bine blades will also be stationary and conventional clutter filters can be used to recover the weather signal. In this case, the flag will have eliminated clean data, which could have been recovered.
Figure 1: Typical three-blade wind turbine consisting of a tower, nacelle, rotor, and three blades. Blades are constructed of fiberglass with lightning rods spanning the length of each blade. Nacelle houses the generator and equipment controlling the turbine.
sarelli 2005) are an effective method in removing these clutter targets but are ineffective for WTC. The clutter filter removes the returns due to the stationary components of the wind turbine, such as the tower, but the moving blades contaminate the data because the clutter filter is not designed to remove non-zero velocities (Vogt et al. 2007). Previous studies of the characteristics of WTC have been carried out to better understand their signatures (Isom et al. 2009). The first study characterized the wind turbine spectral signature over time showing distinct flashes, which appeared as the blade approached a vertical position relative to the radar. Another study of the characteristics of WTC showed a more complex spectral evolution as the blade swept through space as well as the previous case where flashes occurred in the time evolution plot (Gallardo et al. 2008). All of these efforts have been instrumental in the study of WTC and in pursuing methods to identify and mitigate its negative effects. A common statement made in reference to mitigating WTC for weather radar is the notion that the wind turbines are in fixed locations so knowing where WTC exists should be a simple task of setting a flag to identify those gates. Flagging all data as contaminated because of the existence of a wind turbine in a radar volume is too aggressive. When there is no wind, the wind tur-
Anomalous propagation is probably the most important reason why an automatic detection algorithm is necessary. Under normal atmospheric conditions, a wind farm may never be seen by a weather radar. The beam will overshoot the wind farm in height and no data in the vicinity of the wind farm will be contaminated. When specific atmospheric conditions are met, superrefraction of the radar beam can occur, bending the beam back towards the earth’s surface. When this occurs, a wind farm that normally is not in the line-of-sight (LOS) of the radar may come into view. Under clear-air conditions, this may not be an issue as the radar operator may know of the existence of the wind farm. During convective events, in contrast, the operator needs to know what information is due to WTC and what information is relevant weather data. Algorithms exist to assist forecasters during convective events, such as the tornado detection algorithm (TDA) or the mesocyclone detection algorithm (MDA), but these algorithms do not have the capability to distinguish WTC like the forecasters. False detections with the TDA or the MDA further complicate the stressful situations forecasters work in. An automatic detection algorithm could alleviate these problems forecasters experience due to WTC. Unfortunately, using base data, there is no unique signature of WTC to detect an individual volume for a single scan. Therefore, temporal and spectral features of the WTC signal are proposed to be used to distinguish between weather signals and the canonical case of WTC.
3. DISTINGUISHING FEATURES OF WIND TURBINE CLUTTER Most of the features used in the detection algorithm were determined by observation of the WTC Doppler spectrum. There are three main components that make up a typical WTC signal: a tower, a flash, and a hub. The canonical WTC spectral evolution in time is shown in Figure 2. The signal at zero velocity is primarily from the stationary tower of the wind turbine. The flash is believed to be caused by the blade in its rotation when it is perpendicular to the ground. There is no definite conclusion to the oscillating signal, referred to as hub contamination, but it is believed to originate from the turbine structures near the rotor of the wind turbine. The WTC signal is complex as many parameters are not known for a given signal. The phase of the blade
3.1. Spectral Flatness Spectral flatness is a feature that has been used successfully in tornado detection (Yu et al. 2007). Tornado spectra are known for being quasi-flat across all velocities and spectral flatness captures this spectral characteristic. The feature is calculated by ordering the spectral components of the signal from low to high values, removing a percentage of the lowest values from the ordered spectrum, and calculating the standard deviation of the remaining spectral components. The flatter the spectrum, the lower the value of spectral flatness.
Figure 2: Canonical WTC spectral evolution. The hub signal has been highlighted with the oscillating line.
Spectral flatness was selected as a feature to identify WTC for the cases where a flash was present in the spectrum. Compared to a typical Gaussian weather spectrum, when a flash is present, the spectrum flattens out as high velocities alias. A slight modification was made to the calculation of spectral flatness for this application; the inverse of the standard deviation of the spectrum was taken. This allowed for easy identification during assessment when a spectrum was flat because of a flash.
3.2. 4th Central Spectral Moment in relation to the radar, the angle of the turbine in relation to the radar, the rotation rate of the blades, or how many turbines are in a radar volume are a few of the unknown parameters of WTC, making it difficult to test an algorithm. To properly test a new signal processing algorithm, it is useful to have a controlled environment. For this automatic detection algorithm, it was necessary to simulate weather and WTC signals. The weather signals were simulated using the method developed by Zrni´c (1975). This simulator allows the weather signal parameters to be varied systematicly such that a wide variety of weather signals could be added to the WTC signals. The WTC was assumed to consist of the three components explained earlier. The tower was simulated as a zero-velocity, narrow width weather signal, the hub was simulated as a random process with a varying mean around zero velocity, and the flash was simulated using a time-series radar simulator developed by Cheong et al. (2008). The simulated WTC spectral evolution is shown alongside the actual WTC spectral evolution in Figure 3. Observation of the simulated WTC signals led to the development of many features that could distinguish WTC from weather signals. The features were assessed to determine which showed the most promise in distinguishing WTC. A typical tool used to assess the features is shown in Figure 4. Many features were developed and analyzed but only the features determined to be useful are discussed in this paper.
The 4th central spectral moment was a promising feature to identify the flash in the WTC spectrum. The 4th central spectral moment was calculated as
E{Si − vr }4 =
!M 1 4 i=1 (Si − vr ) M ! M 1 2 2 [M i=1 (Si − vr ) ]
(1)
where M is the number of points in the spectrum, Si is the spectral component at index i, and vr is the estimated mean velocity from the spectrum. The 4th moment has values close to zero for a Gaussian spectrum. When a spectrum deviates from a Gaussian shape and has a sharper peak or has fatter tails, the value of the 4th moment increases. The spectrum deviates from a Gaussian when a flash occurs and results in very high values for the 4th moment.
3.3. Clutter Phase Alignment Clutter phase alignment (CPA) is not a spectral feature but is a temporal feature used in the clutter mitigation decision (CMD) algorithm to detect usual ground clutter contamination (Hubbert et al. 2008). CPA is computed as !m
|
xi | i=1 |xi |
CPA = !mi=1
(2)
Figure 3: Comparison of actual WTC (left) and simulated WTC (right).
Figure 4: Assessment tool used to find correlation between developed features and WTC features. The correlation between several developed features and a flash of the WTC is highlighted.
where m is the number of time-series samples and xi is the time-series sample at index i. For clutter targets, the value of CPA should be close to its maximum value of 1 whereas for weather, the value is usually less than 1. The reasoning for using CPA is if there is a wind turbine, it would only exists where there is a stationary tower.
3.4. Hub-to-Weather Power Ratio Hub-to-weather power ratio was a feature developed specifically to detect WTC contamination due to the “hub”. GMAP is effective in removing zero velocity clutter but the hub contamination oscillates around zero and is difficult to remove. The increase in power around zero because of the oscillation is not removed and the clutter residue contaminates the weather signal. To compute the hub-to-weather power ratio, the power of the clutter residue is computed as well as the power in the weather signal and the ratio between the two is taken. When the hub power is greater than the weather power, there will be contamination in the spectrum and vice versa. This feature works well for detecting the difficult cases when contamination occurs due to the clutter residue after clutter filtering.
3.5. Feature Performance Assessment After the initial assessment was completed for the features, simulations were run to vary the weather parameters for the simulated weather which were then combined with the WTC signals. For each set of parameters, the values for each feature were calculated for all the realizations and stored for later use. The concept of a delta bias was used to determine whether the spectrum was contaminated or not contaminated. The bias inherent in the spectral moment estimators and signal processing techniques are subtracted from the bias of a spectrum with WTC. This delta bias is a measure of the bias related directly to WTC. A threshold is set for the velocity delta bias and any spectra with a delta bias greater than the threshold is considered contaminated and vice versa. This delta bias established the truth data which would be used to determine if the automatic detection identified the spectrum correctly. Using delta bias, a histogram was made to see which features had enough separation between the contaminated and non-contaminated cases to find the most useful features for the algorithm. The four features mentioned previously had enough separation to use in a
fuzzy logic system. The histogram for spectral flatness is shown in Figure 5.
4. FUZZY LOGIC SYSTEM When detecting WTC, specific resolution volumes may be contaminated but the degree of contamination from one volume to another may differ significantly. When observing the spectrum of a contaminated weather signal, one may see that the spectrum is “completely” contaminated while another is only contaminated “slightly”. Fuzzy logic is a useful method of making human-like decisions with varying degrees of membership in a group when a clear decision is not possible. The first step in a fuzzy logic system (FLS) is to create membership functions. A membership function is necessary for each feature used in the algorithm. The histogram shown previously is an excellent foundation for determining a membership function, also shown in Figure 5. The calculated features are the inputs to the membership functions and the outputs of the membership functions are termed fuzzified values. After the membership functions have been selected, a decision as to how to weight and combine the fuzzified values must be made. The weighting for each feature is dependent on many things. One example is a feature may be better suited to detecting a flash more than another feature so a stronger weight will be given to the first. For the initial algorithm, all features were given equal weighting. When combining the output of the membership functions, the fuzzified values can be added, the product of the values can be taken, or the t-norm of the fuzzified values can be computed (Mendel 1995). The final step in this algorithm is to set a threshold on the aggregated value to make a binary determination of whether or not the spectrum is contaminated or not contaminated. The diagram in Figure 6 shows the basic structure of the automatic detection algorithm.
5. PRELIMINARY RESULTS Once the FLS was completed, the algorithm was run using the features on a range of fuzzy logic thresholds to make a detection. The detection from the FLS was compared against the truth data and the detection was classified as a correct detection of contamination (true positive), a missed detection (false negative), a false alarm
Figure 5: Membership function (black) is based on the histograms calculated from the feature values for a set of cases. Histogram and membership function for spectral flatness is shown.
Figure 6: Block diagram of the fuzzy logic WTC detection algorithm.
(false positive), or a correct detection of no contamination (true negative). These four classifications are frequently used to create receiver operating characteristics (ROC) plots to determined the performance of a classifier (Fawcett 2006). Using the four sets of data, the true positive rate (TPR) and false positive rate (FPR) can be determined to create the necessary ROC plots. TPR is defined as TPR =
True Positives True Positives + False Negatives
(3)
and FPR is defined as FPR =
False Positives . False Positives + True Negatives
(4)
Using the TPR and FPR values for the each threshold of the fuzzy logic system, a ROC plot can be made. The ROC plot for the algorithm is shown in Figure 7.
structed. The wind turbines in use today are already a problem for weather radar and the continued growth of the industry will cause even more problems for weather radar unless an algorithm is developed to mitigate this WTC. In order to mitigate this clutter effectively, an automatic detection algorithm is necessary. In this work, a detection algorithm has been developed using a set of temporal and spectral features which focus on specific characteristics of WTC contamination. Using simulated WTC and weather data, features that help distinguish between contaminated spectra and non-contaminated spectra were selected. These features were then combined in a fuzzy logic algorithm and the output of this algorithm was used to determine the preliminary performance of the detection algorithm. To improve the performance of the algorithm, the fuzzy logic parameters need to be optimized. The feature weights, the membership functions, and the fuzzy logic threshold will be optimized. With an optimized FLS, the performance of the algorithm should improve. This is the first step towards mitigating WTC and will lead to more reliable data to ensure the best possible weather predictions for society. ACKNOWLEDGMENT This research was funded by the Radar Operations Center and the National Severe Storms Laboratory through grant number NA17RJ1227. REFERENCES
Figure 7: ROC plot for the FLS using equal weighting for all features. The analysis of the plot to determine which fuzzy logic threshold is optimal will depend on whether or not a high probability of detection is required or if a low false alarm rate is required. If a high probability of detection is a requirement, one could infer from the plot that the algorithm with a probability of detection of 97% while having a false alarm rate of 21% using a threshold of 0.2 would be ideal. On the other hand, if a low false alarm rate is a requirement, one could use a threshold of 0.7 and infer from the plot that when using this threshold, the false alarm rate is 1% and the probability of detection is 32%. 6. CONCLUSIONS AND FUTURE WORK The growth of wind power in the United States has led to an increase in the number of wind farms being con-
Cheong, B. L., R. D. Palmer, and M. Xue, 2008: A TimeSeries Weather Radar Simulator Based on HighResolution Atmospheric Model Simulations. J. Atmos. Oceanic Technol., 25, 230–243. Department of Energy, 2008: 20% Wind Energy by 2030. Report from the Energy Efficiency and Renewable Energy. Fawcett, T., 2006: An Introduction to ROC Analysis. Pattern Recogn. Lett., 27(8), 861–874. Gallardo, B., F. Perez, and F. Aguado, 2008: Characterization Approach of Wind Turbine Clutter in the Spanish Weather Radar Network. in Proceedings of the Fifth European Conference on Radar in Meteorology and Hydrology. Hubbert, J. C., M. Dixon, S. Ellis, and G. Meymaris, 2008: Weather Radar Ground Clutter, Part I: Identification, Modeling and Simulation. J. Atmos. Oceanic Technol.
Isom, B. M., R. D. Palmer, G. S. Secrest, R. D. Rhoton, D. Saxion, T. L. Allmon, J. Reed, T. Crum, and R. Vogt, 2009: Detailed Observations of Wind Turbine Clutter with Scanning Weather Radars. J. Atmos. Oceanic Technol., 26, 894–910. Mendel, J. M., 1995: Fuzzy Logic Systems for Engineering: A Tutorial. Proc. IEEE, 83(3), 345–377. Siggia, A. D., and R. E. Passarelli, 2005: Gaussian model adaptive processing (GMAP) for improved ground clutter cancellation and moment calculation. SIGMET, Inc., MS-NR:ERAD3-P-00117. Vogt, R. J., J. Reed, T. Crum, J. T. Snow, R. D. Palmer, B. M. Isom, and D. W. Burgess, 2007: Impacts of Wind Farms on WSR-88D Operations and Policy Considerations. in Extended Abstracts, 23rd International Conference on Interactive Information Processing Systems (IIPS) for Meteorology, Oceanography, and Hydrology. AMS. Yu, T.-Y., Y. Wang, A. Shapiro, M. B. Yeary, D. S. Zrnic, and R. J. Doviak, 2007: Characterization of Tornado Spectral Signatures Using Higher-Order Spectra. J. Atmos. Oceanic Technol., 24, 1997–2013. Zrni´c, D. S., 1975: Simulation of Weatherlike Doppler Spectra and Signals. J. Appl. Meteorol., 14(4), 619– 620.