1Dept. of CSEE, University of Maryland, Baltimore County, Baltimore, MD 21250. 2Dept. of Biological and Medical ... NIH-PA Author Manuscript. NIH-PA Author ...
NIH Public Access Author Manuscript IEEE Trans Biomed Eng. Author manuscript; available in PMC 2011 December 1.
NIH-PA Author Manuscript
Published in final edited form as: IEEE Trans Biomed Eng. 2011 December ; 58(12): 3406–3417. doi:10.1109/TBME.2011.2167149.
Automatic Identification of Functional Clusters in fMRI Data using Spatial Information Sai Ma1, Nicolle M. Correa1, Xi-Lin Li1, Tom Eichele2, Vince D. Calhoun3, and Tülay Adalı1 1Dept. of CSEE, University of Maryland, Baltimore County, Baltimore, MD 21250 2Dept.
of Biological and Medical Psychology, University of Bergen, 5009 Bergen, Norway
3Dept.
of ECE, The Mind Research Network and The University of New Mexico, Albuquerque, NM 87131
Abstract
NIH-PA Author Manuscript
In independent component analysis (ICA) of functional magnetic resonance imaging (fMRI) data, extracting a large number of maximally independent components provides a more refined functional segmentation of brain. However, such segmentation does not per se establish the relationships among different brain networks, and also selecting and classifying components can be challenging. In this work, we present a multidimensional ICA (MICA) scheme to achieve automatic component clustering. In this MICA framework, stable components are hierarchically grouped into clusters based on spatial information and higher-order statistics, instead of typically used temporal information and second-order correlation. The final cluster membership is determined using a statistical hypothesis testing method. The experimental results from both simulated and real fMRI data sets show that the use of only spatial information with higher-order statistics leads to physiologically meaningful dependence structure of brain networks, which is consistently identified across various ICA model orders and algorithms. In addition, we observe that components related to artifacts, including cerebrospinal fluid (CSF), arteries, and large draining veins, demonstrate a higher degree of dependence among them and encouragingly distinguished from other components of interest using our MICA approach.
Keywords
NIH-PA Author Manuscript
Independent component analysis; multidimensional ICA; spatial dependence; hierarchical clustering; fMRI
I. Introduction Functional magnetic resonance imaging (fMRI) data have been successfully analyzed using independent component analysis (ICA) [1], [2]. In these analyses, typically 20–30 independent components (ICs) are extracted, as guided by the information-theoretic criteria [3]. More recently, it has been noted that using high ICA model order, for example, 60 to 70 or higher, a more refined and hence more useful functional segmentation of brain can be achieved [4], [5], [6]. However, without establishing the relationships among ICs, analyzing a large number of ICs is more memory and computer intensive, and also makes component selection more difficult. In this paper, we present an automatic clustering strategy and interpret components in terms of functional clusters such that fine decomposition at high ICA model order is most useful. In contrast to most of previous studies using temporal correlation [7], [8], our approach is based on spatial information and higher-order statistics to increase accuracy and confidence of computed statistics and hence to obtain robust and meaningful assessment of brain connectivity.
Ma et al.
Page 2
NIH-PA Author Manuscript
In spatial ICA of fMRI data, the underlying components are assumed to be statistically independent to each other. However, not all sources follow ICA model strictly and therefore violation of the independence assumption is observed in real applications. After ICA decomposition, certain levels of dependence among ICs are likely to remain, especially when separating observation data into a large number of source estimates. For example, in [10] the removal of consistently task-related components affects not only the number but also the location of activated voxels in the recomputed transiently task-related components, which indicates that these components are dependent on each other. Therefore, the residual dependence among spatial components after ICA can be used to infer relationships among them [9]. However, to utilize such residual dependence, a relaxation of ICA to allow dependent components is desirable. The first generalization, multidimensional ICA (MICA), has been proposed in [11]. Starting with ICA, MICA suggests grouping ICA source estimates into several clusters, referred to as multidimensional ICs, such that the components within the same cluster are in some way related to each other [12]. For fMRI data analysis, such grouping is in general achieved through visual inspection of spatial maps and corresponding time courses, which is prone to bias and heavily rater dependent. Therefore, we develop an automatic clustering strategy to identify functional clusters.
NIH-PA Author Manuscript
Other closely related approaches have been proposed in order to incorporate a similar idea, including independent subspace analysis (ISA) [13] and topographic ICA [14]. ISA is a special case of MICA which combines the principle of invariant-feature subspace [15] to maximize the independence between the norms of the projection onto a linear feature subspace, instead of the independence between the projections themselves. Topographic ICA defines the dependence structure graphically by a neighborhood function to express the strength of the connection among components. While the above methods can generate reasonable estimates for MICA decomposition, both of them have limitations: ISA assumes a spherically symmetric distribution for each cluster and topographic ICA requires the size of the neighborhood to be fixed in advance.
NIH-PA Author Manuscript
Following MICA framework proposed in [11], we integrate ICA, mutual information based hierarchical clustering, and analysis of variance, to achieve MICA decomposition automatically. Compared to ISA and topographic ICA, neither the distribution nor the dimensionality of a multidimensional IC needs to be known beforehand in the presented MICA approach. Since the performance of MICA decomposition mainly depends on ICA source separation, we first handle the algorithmic and statistical uncertainty of ICA source estimates before forming multidimensional ICs, through a modification of the reliability analysis implemented in MATLAB toolbox ICASSO [16], to reduce potential information loss. To summarize the experimental results, we identify functional clusters of brain networks based on mutual information among spatial components derived from ICA. These clusters, including regions in frontal, parietal, motor, temporal, and visual cortex, respectively, are known to be both functionally and anatomically connected. We find that the obtained dependence structure among different brain networks is consistently identified across various ICA model orders and algorithms. In addition, we show that physiological artifacts from cerebrospinal fluid (CSF), arteries, and large vessels demonstrate a higher degree of spatial dependence among them, which suggests that the proposed MICA approach offers a promising way to automatically compartmentalize these artifacts with other components of interest. These results indicate that the use of only spatial information with higher-order statistics leads to physiologically meaningful dependence structure of brain networks and provides more useful understanding of a large number of components.
IEEE Trans Biomed Eng. Author manuscript; available in PMC 2011 December 1.
Ma et al.
Page 3
II. Material and Methods A. Independent Component Analysis of FMRI
NIH-PA Author Manuscript
The goal of ICA is to find a linear combination of the underlying components that are maximally independent of each other. Consider an M-by-V observation matrix, denoted by X, which is assumed to be generated as the following model, (1)
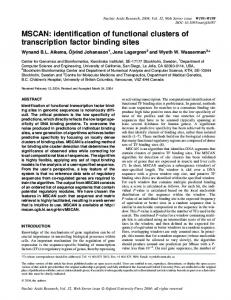
where S = [s1,…, si,…, sN]T, with dimensions of N × V, is the source matrix whose element si is the ith independent component (IC) and A is an M-by-N (usually M ≥ N) mixing matrix with the ith column (i = 1,…, N) uniquely denoting the activation level (time course, TC) associated with the ith IC. ICA decomposition of X can be achieved by estimating a demixing matrix W = A−1 (when the permutation and scaling ambiguity are ignored) such that the invertible transformation is a satisfied representation of true sources S. Fig. 1 shows how ICA of fMRI works. B. Multidimensional Independent Component Analysis
NIH-PA Author Manuscript
The ICA model presented in previous section can be extended using the following multidimensional ICA (MICA) model [11]:
where each Si is a subset with dimension Ni, Ni = N and N is the total number of sources, the same as in ICA model. Correspondingly, each element of mixing matrix, denoted by Ai, is an M-by-Ni matrix which specifies the time-varying contributions of Si to the measured fMRI signals. In this MICA model, ICs derived from (1) are grouped into n subsets such that the components within the same subset are allowed to be mutually dependent, while the dependencies among the components of different subsets are minimized. In general, the subset dimension Ni is not necessary to be equal for ∀i = 1,…, n. Note that this model reduces to the ICA model in (1) when n equals N or equivalently Ni = 1, for ∀i.
NIH-PA Author Manuscript
In general definition of MICA, two stages are involved to achieve MICA decomposition: first performing ICA source separation and then grouping the source estimates based on statistical dependence among them [11], spatially or temporally. For spatial grouping, the spatial components from ICA are clustered into a set of groups and these groups are denoted as multidimensional components; on the other hand, permutation on the columns of the mixing matrix are employed to group in terms of temporal correlation [7]. In our study, we focus on spatial ICA and the pairwise dependence between spatial components. C. MICA Framework for FMRI Data Analysis In this section, we present a MICA framework for fMRI data analysis to achieve automatic identification of functionally related brain networks. As typically done in fMRI data analysis, we first perform principal component analysis (PCA) to reduce the original dimension of fMRI data set. After this step, three analysis stages are involved: 1) reliability analysis of ICA source estimates; 2) mutual-information based (MI-based) hierarchical clustering; 3) automatic formation of the multidimensional independent components. An
IEEE Trans Biomed Eng. Author manuscript; available in PMC 2011 December 1.
Ma et al.
Page 4
analysis flow chart explaining the whole procedure from fMRI data set to the final multidimensional components is given in Fig. 2.
NIH-PA Author Manuscript
Our MICA decomposition is based on the statistical dependence among source estimates, hence we introduce the measure of dependence first. Correlation is the most frequently used proximity measure for the post-analysis of ICA of fMRI. Since second-order uncorrelatedness is not the same as statistical independence and the values of the residual correlation after pre-whitening in ICA are usually small enough to neglect, mutual information is an appropriate measure of dependence which takes into account higher order statistical information. We compute a normalized measure of mutual information [17], as the following formula shows, (2)
where (·, ·) is the mutual information between two components. that λ(·, ·) is in the interval of [0, 1] and a value of zero means completely independent. In our experiments, mutual information is estimated using a nonparametric kernel density approach [18].
NIH-PA Author Manuscript
1) Reliability Analysis of ICA Source Estimates—One issue in ICA application is the unknown estimation reliability, which is induced by both the finite sample size and the nonunique ICA solution derived from the local optimal point of the cost function. An approach to this problem has been implemented in the MATLAB toolbox ICASSO [16] where ICA algorithm is investigated by performing multiple runs, say R (R ∈ , R > 1), at a given ICA model order N with different initial values of demixing matrix and/or bootstrapping data set. The total R×N source estimates are grouped into N clusters using spatial correlation as the proximity measure. Each ICASSO cluster represents an individual type of source estimate and a reliable estimate corresponds to a tight cluster having an optimal size as same as (or at least close to) the number of runs. A metric Iq, 0 ≤ Iq ≤ 1 reflecting the quality of a cluster is introduced and the center or centrotype for each cluster is provided as the most reliable source estimate of this cluster. For each ICASSO cluster, Iq is calculated as:
NIH-PA Author Manuscript
where |Cn| is the number of components within the nth cluster, C−n is the set of indices that do not belong to the nth cluster [16]. Here, we use λ(si, sj) introduced in (2) as the similarity measure between the ith and jth components. However, the direct use of centrotypes can lose information, especially when the ICA model order is high. We note that when ICA model order increases, more and more ICASSO clusters become unreliable to have a size significantly more or less than the number of runs. Since without restriction on cluster size, more than one kind of component may be grouped into the same cluster, but only one type of component can be selected as the centrotype. For example, as we observed in our study, one ICASSO cluster, represented by a centrotype in supplementary motor area (SMA), also includes some post-central ICs and one precuneus cluster contains some visual ICs too (hence, the size of such cluster is typically large). This issue is due to interference from the functional connections among different kinds of components, which is the focus in the next stage of our analysis. Nevertheless, the centrotypes satisfying certain criteria are reliable. We define a cluster in ICASSO as qualified if the cluster size is proper (in our case, 8 to 12 ICs within a cluster are IEEE Trans Biomed Eng. Author manuscript; available in PMC 2011 December 1.
Ma et al.
Page 5
NIH-PA Author Manuscript
acceptable since we run the ICA algorithm 10 times) and the index Iq is above a threshold (e.g., 0.7). Instead of centrotypes, we select the ICs from the most stable run based on a metric, denoted by Q, which is the average maximal intra-cluster similarities to centrotypes and calculated as follows:
where Nq is the total number of qualified clusters, cj, j = 1, …, Nq is the centrotype of the jth qualified cluster, subscripts on the symbol srjk indicate that the kth component derived from the rth run within the jth cluster, and mutual information λ(·, ·) is defined in (2). Note that Iq is recomputed correspondingly to define the qualified cluster. The close-toone Q for a given run indicates that the ICs from this run are close enough to all centrotypes within the qualified clusters even though they may not be centrotypes. Using metric Q, we may lose some information. However, our goal in this step is to minimize loss of information by retaining the most reliable information (the most replicated run) while discarding less reliable data.
NIH-PA Author Manuscript
2) Mutual Information Based Hierarchical Clustering—Based on the normalized mutual information, hierarchical clustering is performed on the N derived ICs from the most reliable run to discover the dependence structure among them. First, the distance or dissimilarity dij between two components si and sj is defined as:
where mutual information λ(·, ·) is defined as the same as in (2). Two completely independent sources have the distance dij of unit. The distance matrix D is constructed by assigning dij to the (i, j)th entry of D. Based on D, the agglomerative hierarchical clustering starts with each component as a separate cluster and merges them into successively larger clusters. The similarity between two clusters is calculated using average-linkage criterion, that is the average λ(·, ·) of all component pairs from these two clusters. Finally, we obtain the dendrogram, or the tree-like dependence structure for all components.
NIH-PA Author Manuscript
3) Automatic Formation of Multidimensional Independent Components—After MI-based hierarchical clustering, one of the remaining questions is that the stopping rule to partition the dendrogram is difficult to decide through visual inspection. A robust and effective approach to this type of problem is to incorporate hypothesis testing–analysis of variance (ANOVA) [19]. Using ANOVA-based method, we can decide final members for each cluster using different thresholds. It is possible to use other indices [20], e.g., R-index, to obtain the number of clusters, which is to decide a single threshold to cut the dendrogram. However, in real applications the optimal clustering may not be sufficiently decided by only one specific threshold, especially for a large number of components. We also note that using R-index it is still difficult to decide the optimal number of clusters since R-index may keep decreasing as the number of clusters increases. We start one-way ANOVA at the two-cluster level of the dendrogram. The null hypothesis is as follows,
IEEE Trans Biomed Eng. Author manuscript; available in PMC 2011 December 1.
Ma et al.
Page 6
NIH-PA Author Manuscript
where μi and μj are the average values of distance for two possible clusters and μij is the average inter-individual distance between them. We reject H0 in favor of the alternative hypothesis, Hα: at least one inequalities of these three means, where α is the significance threshold. This is the rejection of null hypothesis occurs when μi < μij and μj 12) or having undesirable quality (Iq < 0.7) or both. The fifth run, contributing centrotypes to four qualified clusters, has the highest value of Q score (0.94) indicating that even though the ICs from this run are not centrotypes in the other qualified clusters, they are much closer to the centrotypes than ICs derived from other runs and therefore more reliable and reproducible. The least reliable run of ICA-EBM algorithm has a value of 0.81. Hence, we perform our subsequent analysis, including mutual information based hierarchical clustering and hypothesis testing, on the ICA-EBM ICs from the fifth run of group ICA at order 60. Compared to Infomax, ICA-EBM is slightly less stable than Infomax due to inherent flexibility of ICA-EBM in density matching. 2) Mutual Information Based Hierarchical Clustering—The hierarchies of 60 ICAEBM ICs and Infomax ICs produced by MI-based hierarchical clustering are demonstrated in Fig. 6. Due to space limitations, we only present the dendrogram produced at this high order and give a brief overview of the MICA results at other orders. Mutual information between two ICs are estimated using nonparametric Gaussian kernel density matching method and the average mutual information among ICA-EBM and Infomax ICs is 0.21 ± 0.07 and 0.26 ± 0.06, respectively. For ICA-EBM, the most dependent ICs are #17 and #6, both of which cover the sensorimotor cortex, while the least dependent pair is #3 (artifact) and #34 (superior frontal) with value of mutual information 0.05. Similarly for Infomax, two sensorimotor ICs have the highest mutual information and the lowest dependence exists between one artificial IC and one IC of interest.
NIH-PA Author Manuscript
3) Automatic Formation of Multidimensional Independent Components—The final clusters decided using ANOVA with significance level α = 0.05 are differentiated by various colors and labels in dendrogram. Spatial maps for ICA-EBM and Infomax ICs within each cluster are shown in Fig. 6 and Fig. 7. Although two algorithms derive different decompositions, the overall dependence structures of ICA-EBM ICs and Infomax ICs are similar to each other. Both of these two hierarchies contain several major clusters (multidimensional ICs) of interest; for example, the motor cluster includes supplementary motor area (SMA) and post-central gyrus. The dominant AAL labels for each cluster of ICA-EBM ICs at order 60 are shown in Table I. Other clusters cover the visual cortex, temporal gyrus, parietal lobule, precuneus and posterior cingulum, frontal lobe and frontoparietal regions, all of which characterize the rest state of the brain. ICs within the parietal, precuneus, and frontal clusters are related to DMN [32]. We find that functionally related components, e.g., IC #17 (blue, SMA) and #32 (pink, paracentral lobule) in Fig. 6 (a), are grouped together to reflect a localized network, which appears to be consistent with the principles of functional organization of the brain. This kind of functional grouping was also found in our previous studies where for a data set acquired during a visuomotor task, three task-related ICs (bilateral visuomotor cortex and medial occipital) and four DMN ICs (frontal pole, frontoparietal, posterior cingulate and IEEE Trans Biomed Eng. Author manuscript; available in PMC 2011 December 1.
Ma et al.
Page 9
NIH-PA Author Manuscript
precuneus), respectively, had higher dependence among them [9]. Recently, we also applied mutual information based hierarchical clustering to another real fMRI data set acquired during an AOD task and we observe consistent groupings of components [33]. All these experimental results from several fMRI data sets indicate that our component clustering scheme generalizes to different tasks. Due to the characteristics of ICA algorithms, the decompositions might be different. We note that for ICA-EBM, the head motion artifact and SMA are estimated as one component (green in Fig. 6. (a)), which is often observed in SPM regression and ICA applications; while for Infomax, although these two regions are estimated as two separate components, they are grouped together probably resulting from the involvement of body movement, especially for a task requiring contingent movement. For ICA-EBM, another component, including both frontal and left parietal lobes as shown in light blue in Fig. 6. (c), is grouped into frontal cluster since the frontal regions of this component has high dependence with ICs within the frontal cluster. Besides the functional dependence, we note that structurally related ICs are also grouped together according to the inherent nature of MI-based clustering. An example is the multidimensional IC containing both temporal and motor regions, as shown in Fig. 6. (g). The cerebellum ICs are also grouped together with some artificial ICs for the same reason.
NIH-PA Author Manuscript NIH-PA Author Manuscript
Another intriguing result is that components related to physiological artifacts in vicinity of cerebellum are consistently clustered together across different orders and algorithms, which is not observed when using temporal correlation. As shown in Fig. 8, those components caused by the presence of arteries, large blood vessels, and CSF are grouped into subcortical/cerebellar cluster, together with several physiological plausible components in cerebellum, insular, and pallidum areas, due to inherent structural dependence. The verification of CSF artifacts is based on the criterion that the spatial correlation of an IC of interest with grey matter (GM) template is bigger than that with CSF MNI template [34]. The GM and CSF templates are registered to the same dimensions as IC; voxel value of the template is retained if it is the largest among GM, white matter, and CSF and otherwise is set to zero. We calculate two correlation coefficients for each IC: CorrGM and CorrCSF. Within subcortical/cerebellar cluster for ICA-EBM and Infomax, 63% and 59% ICs have CorrGM < CorrCSF. Outside this cluster, only three ICA-EBM ICs and two Infomax ICs have larger correlation with CSF template than with GM template. Furthermore, we compute average temporal power spectrum of each IC within low-frequency band (< 0.1 Hz) and within high-frequency band (> 0.15 Hz) and calculate the power ratio according to the criterion that task-related activity is usually characterized by lower frequencies (0 to 0.1 Hz) than those in the respiratory cycles (0.1 to 0.5 Hz) and cardiac cycles (0.6 to 1.2 Hz) [35], [6]. At order 60, more than 76% ICA-EBM ICs and 88% Infomax ICs within the subcortical/cerebellar cluster have the ratio less than median value (0.43/0.44 for ICA-EBM/ Infomax, dynamic range 0.03/0.05), while only 33% and 34% ICs outside this cluster have temporal power ratio less than median. It is important to note that inherently different decompositions result in slight differences in the final groupings. We compare spatial components derived from two algorithms and find a total 43 common components, of which 86% (37 common components) are from the same kind of clusters in two dendrograms shown in Fig. 5. Using ANOVA, we also cross-check the similarity between the corresponding clusters derived from different algorithms. All the comparable pairs of clusters obtained from ICA-EBM and Infomax are significantly similar to each other (p < 0.05).
IEEE Trans Biomed Eng. Author manuscript; available in PMC 2011 December 1.
Ma et al.
Page 10
NIH-PA Author Manuscript
Finally, we observe that the dependence patterns are consistent across different ICA model orders. Although the number of ICs within one cluster at low order might be smaller than it at high order, which results from the splitting of components at high order decomposition [3], the major clustering structure is retained. For example, the visual, frontal, motor and temporal clusters, are consistently estimated at orders 20 and 40. Furthermore, at low order, artifacts are still more dependent on each other when compared with ICs of interest.
IV. Discussion We present a MICA framework for fMRI data analysis to automatically investigate relationships among a large number of ICA components using spatial information and higher-order statistics, while most previous studies focus on the use of temporal information and second-order statistics [7], [8] and also are not automatic. After ICA, time courses are usually noisy. Moreover, time courses contain smaller set of samples compared to the spatial maps (hundreds compared to tens of thousands). The small sample size and inherent noise reduce accuracy of computed statistics. Also, second-order statistics does not take full-order statistical information into account. In contrast, we use mutual information among spatial components for quantification of similarity and for constructing the subspaces, i.e., for detecting relationships among different brain networks.
NIH-PA Author Manuscript
Several results are of interest. First, multidimensional ICs containing functionally and anatomically dependent components are identified using only spatial information. This observation is consistent with our previous study in an fMRI data set acquired during the cognitive task that physiologically meaningful clusters, e.g., task-related (visuomotor) cluster and DMN cluster, are obtained. Hence our MICA results are unbiased toward a particular data set and task [9]. Second, we find that the dependent patterns among ICs are retained across various ICA model orders and algorithms, which implies that our approach is robust to different ICA source estimates. Third, physiological artifacts from CSF, vessels, arteries, and large draining veins have higher dependence when compared to cortical ICs. Several physiological plausible ICs, for example, cerebellum, pallidum, and putamen, are also grouped together with the artifacts in the vicinity of cerebellum which is due to the structural dependence among those regions. Further artifact separation within such cluster can be achieved by incorporating other features, e.g., including spatial templates [34], kurtosis, skewness, temporal spectral feature [36], and temporal correlation [7], [8], and training a classifier using these features. Nevertheless, our results indicate that using only spatial dependence, the proposed MICA method promises to be effective for the automatic compartmentalization of physiological artifacts from other ICs of interest in fMRI data.
NIH-PA Author Manuscript
In the proposed framework, we perform ICA multiple runs, handle the reliable uncertainty of the derived components, and incorporate mutual information based hierarchical clustering in conjunction with a hypothesis testing method, to determine the underlying multidimensional ICs, which represent the functional clusters in the brain. Other popular clustering approaches, for example, fuzzy k-means clustering, may also be applicable. However, hierarchical clustering explicitly explores and visualizes the tree-like relationships among ICs, similar to the transformation to make ICs fit the graphical model presented in tree-dependent component analysis (TCA) [37]. In the reliability analysis of ICA source estimates, we select all the ICs from the most stable run instead of centrotypes due to the selection confidence of them. A metric Q is defined to evaluate the stability of each run of ICA algorithm. Indeed, this metric can be extended since in current work we only assess the reliability within the clusters with proper size and high quality. In our future study, we will consider the incorporation of the performance within those unqualified clusters as a penalty into this metric. Nevertheless, this reliability analysis
IEEE Trans Biomed Eng. Author manuscript; available in PMC 2011 December 1.
Ma et al.
Page 11
NIH-PA Author Manuscript
to some extent is useful to quantitatively evaluate the performance of ICA algorithm. Our experimental results show that the source estimates derived from Infomax are more stable than that obtained from ICA-EBM. It is reasonable according to the nature of the two algorithms: ICA-EBM provides flexible options for density matching [25], [26], while Infomax assumes a super-Gaussian density model to consistently produce stable ICs [38], [39]. One issue for hierarchical clustering is that how to cut dendrogram is difficult to decide only through visual inspection. We adopt ANOVA to test the significant difference between the mean of the within-group distance and the between-group distance. Such a statistical procedure provides objective stopping conditions for partitioning the dendrogram. Besides the rejection of our null hypothesis, another desirable stopping rule is the minimum dimension of each multidimensional IC to avoid small-size cluster. Our experience working with different algorithms and orders suggests that a threshold 4 is a good choice to produce plausible clusters. After determining the membership of each multidimensional IC, we label them based on the AAL atlas to provide a descriptive symbol for each functional cluster. Other atlas, including the Talairach atlas [40] and Wake Forest (WFU pick atlas) [41], can also be used to report the ROIs within a cluster.
NIH-PA Author Manuscript
The main advantage of the presented MICA scheme is that we achieve an efficient and effective grouping of ICA components using only spatial information, which is usually a time-consuming task and requires a high demand for expertise in both brain functional segmentation and fMRI data analysis. Our approach facilitates the study of brain network interrelationships in terms of identifying functional clusters of them, in spite of task, model order, and algorithm. Although we propose for fMRI data analysis, our approach can be easily applied to other kinds of neuroimaging data, e.g., electroencephalography. A number of previous studies show evidence that many brain diseases, including schizophrenia, Alzheimer, and bipolar, show dysfunctional connectivity in various regions, for example, temporal lobe, default mode networks, and occipital cortex [42], [43], [44], [45]. All these regions have been found to be multidimensional ICs in our MICA results. Therefore, we will apply the proposed approach to fMRI data set acquired from patient participants and compare the normal and pathological brain networks in our future study.
Acknowledgments
NIH-PA Author Manuscript
This work was supported in part by the National Institutes of Health grants R01 EB000840, R01 EB005846, and 5P20_RR021938. Tom Eichele was supported through a BILATGRUNN grant from the Norwegian research council. We thank the research staff at the University of New Mexico and the Mind Research Network who collected, processed and shared the data, and Jing Sui in the Medical Image Analysis Lab who provided the GM and CSF templates. We also appreciate the valuable advice given by the members of Machine Learning for Signal Processing Laboratory at the University of Maryland, Baltimore County.
References [1]. McKeown MJ, et al. Analysis of fMRI data by blind separation into independent spatial components. Hum. Brain Mapp. 1998; 6:160–188. [PubMed: 9673671] [2]. Calhoun VD, Adallı T. Unmixing functional magnetic resonance imaging with independent component analysis. IEEE Eng. Med. Biol. Mag. 2006; 25:79–90. [PubMed: 16568940] [3]. Li YO, Adalı T, Calhoun VD. Estimating the number of independent components for fMRI data. Hum. Brain Mapp. 2007; 28(no. 11):1251–1266. [PubMed: 17274023] [4]. Smith SM, et al. Correspondence of the brain functional architecture during activation and rest. Proc. Natl. Acad. Sci. USA. 2009; 106(no. 31):13040–13045. [PubMed: 19620724] [5]. Kiviniemi V, et al. Functional segmentation of the brain cortex using high model order group PICA. Hum. Brain Mapp. 2009; 30(no. 12):3865–3886. [PubMed: 19507160] IEEE Trans Biomed Eng. Author manuscript; available in PMC 2011 December 1.
Ma et al.
Page 12
NIH-PA Author Manuscript NIH-PA Author Manuscript NIH-PA Author Manuscript
[6]. Allen, EA., et al. A baseline for the multivariate comparison of resting state networks. Biennial International Conference on Resting State Connectivity; Milwaukee, WI. September, 2010; [7]. Smith, SM.; Miller, KL.; Mackay, CE.; Filippini, N.; Beckmann, CF. Towards a functional hierarchy of resting-state networks. Organization for Human Brain Mapping 15th Annual Meeting; San Francisco, CA. June, 2009; [8]. Jafri M, Pearlson GD, Stevens M, Calhoun VD. A method for functional network connectivity among spatially independent resting state components in schizophrenia. NeuroImage. 2008; 39:1666–1681. [PubMed: 18082428] [9]. Ma, S.; Li, X-L.; Correa, NM.; Adalı, T. Independent subspace analysis with prior information for fMRI data. Proc. of the 2010 IEEE International Conference on Acoustics, Speech, and Signal Processing (ICASSP 2010); Dallas, TX. March, 2010; [10]. McKeown MJ, et al. Spatially independent activity patterns in functional magnetic resonance imaging data during the Stroop color-naming task. Proc. Natl. Acad. Sci. USA. 1998; 95:803– 810. [PubMed: 9448244] [11]. Cardoso, JF. Multidimensional independent component analysis. Proc. of the 1998 IEEE International Conference on Acoustics, Speech, and Signal Processing (ICASSP 1998); Seattle, WA. May, 1998; [12]. Hyväarinen, A.; Karhunen, J.; Oja, E. Independent Component Analysis. John Wiley & Sons; 2001. [13]. Hyväarinen A, Hoyer PO. Emergence of phase and shift invariant features by decomposition of natural images into independent feature subspaces. Neural Comput. 2000; 12(no. 7):1705–1720. [PubMed: 10935923] [14]. Hyväarinen A, Hoyer PO, Inki M. Topographic independent component analysis. Neural Computation. 2001; 13(no. 7):1527–1558. [PubMed: 11440596] [15]. Kohonen T. Emergence of invariant-feature detectors in the adaptive-subspace self-organizing map. Biological Cybernetics. 1996; 75(no. 4):281–291. [16]. Himberg J, Hyväarinen A, Esposito F. Validating the independent components of neuroimaging time-series via clustering and visualization. NeuroImage. 2004; 22(no. 3):1214–1222. [PubMed: 15219593] [17]. Dionisio A, Menezes R, Mendes DA. Mutual information: a measure of dependency for nonlinear time series. Physica A: Statistical Mechanics and its Applications. 2004; 344(no. 1–2): 326–329. [18]. Moon Y-I, Rajagopalam B, Lall U. Estimation of mutual information using kernel density estimators. Physical Review. 1995; 52(no. 3):2318–2321. [PubMed: 9963673] [19]. Ratliff RD, Pieper RD. Deciding final clusters: an approach using intra- and intercluster distances. Vegetatio. 1981; 48(no. 1):83–86. [20]. Bezdek J, Pal N. Some new indexes of cluster validity. IEEE Trans. Syst., Man, Cybern. B, Cybern. 1998; 28(no. 3):301–315. [PubMed: 18255949] [21]. Tzourio-Mazoyer N, et al. Automated anatomical labeling of activations in SPM using a macroscopic anatomical parcellation of the MNI MRI single-subject brain. NeuroImage. 2002; 15(no. 1):273–289. [PubMed: 11771995] [22]. Erhardt, E.; Allen, E.; Wei, Y.; Eichele, T.; Calhoun, VD. SimTB, a simulation toolbox for fMRI data under a model of spatiotemporal separability. 2011. In submission [23]. Friston K, Ashburner J, Frith CD, Poline JP, Heather JD, Frackowiak RS. Spatial registration and normalization of images. Hum. Brain Mapp. 1995; 2:165–189. [24]. Bell AJ, Sejnowski TJ. An information-maximization approach to blind separation and blind deconvolution. Neural Comput. 1995; 7(no. 6):1129–1159. [PubMed: 7584893] [25]. Li, X-L.; Adalı, T. A novel entropy estimator and its application to ICA. Proc. IEEE Workshop on Machine Learning for Signal Processing; Grenoble, France. September, 2009; [26]. Li X-L, Adalı T. Independent component analysis by entropy bound minimization. IEEE Trans. Signal Process. [27]. Hyväarinen A. Fast and Robust Fixed-Point Algorithms for Independent Component Analysis. IEEE Trans. Neural Networks. 1999; 10(no. 3):626–634.
IEEE Trans Biomed Eng. Author manuscript; available in PMC 2011 December 1.
Ma et al.
Page 13
NIH-PA Author Manuscript NIH-PA Author Manuscript NIH-PA Author Manuscript
[28]. Cardoso JF, Souloumiac A. Blind beamforming for non Gaussian signals. Proc. Inst. Elec. Eng., pt. F. 1993; 140(no. 6):362–370. [29]. Freire L, Roche A, Mangin JF. What is the best similarity measure for motion correction in fMRI time series? IEEE Trans. Med. Imag. 2002; 21(no. 5):470–484. [30]. Calhoun VD, Kiehl KA, Pearlson GD. Modulation of Temporally Coherent Brain Networks Estimated Using ICA at Rest and During Cognitive Tasks. Hum. Brain Mapp. 2008; 29:828–838. [PubMed: 18438867] [31]. Calhoun VD, Adalı T, Pearlson GD, Pekar JJ. A method for making group inferences from functional MRI data using independent component analysis. Hum. Brain Mapp. 2001; 14(no. 3): 140–151. [PubMed: 11559959] [32]. Raichle ME, MacLeod AM, Snyder AZ, Powers WJ, Gusnard DA, Shulman GL. A default mode of brain function. Proc. Natl. Acad. Sci. USA. 2001; 98:676–682. [PubMed: 11209064] [33]. Ma, S.; Eichele, T.; Correa, NM.; Calhoun, VD.; Adalı, T. Hierarchical and graphical analysis of fMRI network connectivity in healthy and schizophrenic groups. IEEE International Symposium on Biomedical Imaging (ISBI 2011); Chicago, IL. March, 2011; [34]. Sui J, Adalı T, Pearlson GD, Calhoun VD. An ICA-based method for the identification of optimal FMRI features and components using combined group-discriminative techniques. Neuroimage. 2009; 46(no. 1):73–86. [PubMed: 19457398] [35]. Cordes D, et al. Frequencies contributing to functional connectivity in the cerebral cortex in “resting-state” data. Am. J. Neuroradiol. 2001; 22:1326–1333. [PubMed: 11498421] [36]. De Martino F, et al. Classification of fMRI independent components using IC-fingerprints and support vector machines. NeuroImage. 2007; 34:177–194. [PubMed: 17070708] [37]. Bach FR, Jordan MI. Beyond independent components: trees and clusters. Journal of Machine Learning Research. 2003; 4:1205–1233. [38]. Duann, J-R.; Jung, T-P.; Sejnowski, TJ.; Makeig, S. Repeated decompositions reveal the stability of infomax decomposition of fMRI data. Proc. of the 2005 IEEE Engineering in Medicine and Biology 27th Annual Conference; Shanghai, China. September, 2005; [39]. Hill, NJ.; Schroeder, M.; Lal, TN.; Schölkopf, B. Comparative evaluation of independent components analysis algorithms for isolating target-relevant information in brain-signal classification. Brain-Computer Interface Technology: Third International Meeting; Rensselaerville, NY. June, 2005; [40]. Talairach, J.; Tournoux, P. Co-planar stereotactic atlas of the human brain: 3-Dimensional proportional system: an approach to cerebral imaging. Thieme Medical Publishers; 1988. [41]. Maldjian JA, Laurienti PJ, Burdette JB, Kraft RA. An automated method for neuroanatomic and cytoarchitectonic atlas-based interrogation of fMRI data sets. NeuroImage. 2003; 19(no. 3): 1233–1239. [PubMed: 12880848] [42]. Kiehl KA, Stevens MC, Celone K, Kurtz M, Krystal JH. Abnormal hemodynamics in schizophrenia during an auditory oddball task. Biol. Psychiatry. 2005; 57(no. 9):1029–1040. [PubMed: 15860344] [43]. Zhou Y, et al. Functional disintegration in paranoid schizophrenia using resting-state fMRI. Schizophr. Res. 2007; 97(no. 1):194–205. [PubMed: 17628434] [44]. Garrity AG, Pearlson GD, McKiernan K, Lloyd D, Kiehl KA, Calhoun VD. Aberrant “default mode” functional connectivity in schizophrenia. Am. J. Psychiatry. 2007; 164(no. 3):450–457. [PubMed: 17329470] [45]. Calhoun VD, Eichele T, Pearlson GD. Functional brain networks in schizophrenia: A review. Frontiers in Neuroscience. 2009; 3(no. 17):1–12. [PubMed: 19753087]
IEEE Trans Biomed Eng. Author manuscript; available in PMC 2011 December 1.
Ma et al.
Page 14
NIH-PA Author Manuscript
Fig. 1.
ICA decomposes fMRI data into a product of a set of time courses and spatial components.
NIH-PA Author Manuscript NIH-PA Author Manuscript IEEE Trans Biomed Eng. Author manuscript; available in PMC 2011 December 1.
Ma et al.
Page 15
NIH-PA Author Manuscript
Fig. 2.
The flow chart explaining how to form multidimensional components from fMRI data. Usually, data set is multi-subject; therefore, a preprocessing step to reduce the dimension of raw data is required.
NIH-PA Author Manuscript NIH-PA Author Manuscript IEEE Trans Biomed Eng. Author manuscript; available in PMC 2011 December 1.
Ma et al.
Page 16
NIH-PA Author Manuscript Fig. 3.
NIH-PA Author Manuscript
Dendrogram for 20 components estimated from simulated data: (a) Infomax with standard contrast-to-noise ratio (CNR) ~ U[0.8, 2]; (b) Infomax with low CNR ~ U[0.4, 0.8]; (c) ICA-EBM with standard CNR ~ U[0.8, 2]. The final clusters are determined using ANOVAbased approach presented in Section II. C. In spatial maps, red and blue regions represent voxels with positive and negative values, respectively.
NIH-PA Author Manuscript IEEE Trans Biomed Eng. Author manuscript; available in PMC 2011 December 1.
Ma et al.
Page 17
NIH-PA Author Manuscript NIH-PA Author Manuscript
Fig. 4.
The average stability metric Q for ten runs of ICA-EBM and Infomax at three model orders, 20, 40, and 60, respectively. As order increases, the stability for each algorithm decreases.
NIH-PA Author Manuscript IEEE Trans Biomed Eng. Author manuscript; available in PMC 2011 December 1.
Ma et al.
Page 18
NIH-PA Author Manuscript Fig. 5.
NIH-PA Author Manuscript
Dendrogram for 60 ICs derived from algorithms: (a) ICA-EBM; (b) Infomax. Corresponding clusters in these two hierarchies are labeled in the same color and text. Although the component indices in these two figures do not correspond to each other, in most cases the spatial maps are quite similar for the two algorithms, as shown in Fig. 6 and Fig. 7.
NIH-PA Author Manuscript IEEE Trans Biomed Eng. Author manuscript; available in PMC 2011 December 1.
Ma et al.
Page 19
NIH-PA Author Manuscript NIH-PA Author Manuscript
Fig. 6.
Spatial maps for ICA-EBM ICs within seven clusters: (a) motor; (b) parietal; (c) frontal; (d) frontal parietal; (e) occipital; (f) precuneus; (g) temporal. ICs are obtained at model order 60. Both positive and negative voxel values (|Z| ≥ 2.5) are shown. AAL labels for these clusters are demonstrated in Table I.
NIH-PA Author Manuscript IEEE Trans Biomed Eng. Author manuscript; available in PMC 2011 December 1.
Ma et al.
Page 20
NIH-PA Author Manuscript NIH-PA Author Manuscript
Fig. 7.
Spatial maps for Infomax ICs within seven corresponding clusters shown in Fig. 6, with same ICA model order and Z score threshold of ICA spatial maps. Compared with Fig. 6, the color of similar regions for two algorithms is made to be more consistent. Since corresponding clusters from two algorithms may have different dimensions, different regions may have the same color.
NIH-PA Author Manuscript IEEE Trans Biomed Eng. Author manuscript; available in PMC 2011 December 1.
Ma et al.
Page 21
NIH-PA Author Manuscript NIH-PA Author Manuscript
Fig. 8.
Spatial maps for ICA-EBM ICs within the subcortical/cerebellar cluster. Sub clusters include (a) vessel/artery; (b) cerebellum; (c) midline CSF; (d) nuclei. For Infomax at order 60, four similar clusters including physiological artifacts in the vicinity of cerebellum and subcortical/cerebellar ICs are consistently obtained.
NIH-PA Author Manuscript IEEE Trans Biomed Eng. Author manuscript; available in PMC 2011 December 1.
NIH-PA Author Manuscript
NIH-PA Author Manuscript 69, 70
Paracentral Lobule
69, 70
Precuneus
23, 24 31, 32, 35, 36 9, 10, 25, 26
Superior frontal gyrus medial part
Anterior/posterior cingulate gyrus
Frontal gyrus orbital part
IEEE Trans Biomed Eng. Author manuscript; available in PMC 2011 December 1. 35, 36
3–8 79, 80
Superior/middle frontal gyrus
Transverse temporal gyrus
39, 40 83, 84
Parahippocampal gyrus
Superior temporal pole
Subcortical/cerebellar cluster Vessel/artery cluster
81, 82, 85
Superior/middle temporal gyrus
Temporal cluster
67, 68
4.89/5.51
3.33/3.86
4.7/3.92
4.81/4.36
4.88/4.2
5.35/3.33
3.04/3.9
ns/3.14
47, 48
Posterior cingulum
3.47/3.32
Precuneus
Precuneus cluster
Lingual gyrus
Superior/middle/inferior occipital
ns/5.51
3.02/ns
5.93/4.68
5.46/5.06
4.55/5.17
2.71/3.93
5.36/4.32
3.78/3.26
5.25/6.4
ns/4.09
2.95/2.54
Pos. max. R/L
49 – 54
60, 62
Superior/inferior parietal
Occipital cluster
8, 15, 24, 25
Frontal lobule
Frontal parietal cluster
3, 7,8
Superior/middle frontal gyrus
Frontal cluster
59 – 62
Superior/inferior parietal lobule
Parietal cluster
59 – 62
19, 20
ROI No.
Superior/inferior parietal lobule
Supplementary motor area
Motor cluster
ROI
ns
ns
ns
ns/−3.32
ns
ns
1378
1430
286
1581
4013
950
2563
2561
−3.66/−2.77
ns
4281
1290
−2.84/ns
ns
1783
1629
−3.84/−2.65
ns
2020
4050
−3.99/ns ns/−3.72
5774
574
ns
ns
3440
1446
−3.99/−3.27 −5.41/−4.94
1686
1839
Voxel No.
−2.59/−2.52
ns
Neg. min. R/L
4/5(80%)
4/5(80%)
3/6(50%)
5/6(83%)
3/6(50%)
2/3(67%)
2/3(67%)
3/4(75%)
3/4(75%)
2/3(67%)
3/3(100%)
5/7(71%)
5/7(71%)
5/7(71%)
4/7(57%)
3/3(100%)
3/3(100%)
3/4(75%)
3/4(75%)
3/4(75%)
ROI prevalence
AAL labeling for ICA-EBM functional clusters at model order 60. Both maximal positive and minimal negative Z-score values of ICA spatial maps are shown and ns means no voxel survives. ROI prevalence is appearance percentage of ROIs across all components within one cluster
NIH-PA Author Manuscript
Table 1 Ma et al. Page 22
NIH-PA Author Manuscript 109 – 113 33 – 36
Cingulate gyrus
71, 72 77, 78 73, 74 75, 76
Caudate nucleus Thalamus Putamen Pallidum
Nuclei cluster
95 – 98
3.53/3.72
3.42/3.57
5.48/5.79
3.86/3.0
2.53/ns
6.85
4.26/4.19
8.19
109, 112 – 116
Lobule of vermis
ns/3.11
Cerebellar lobule
Midline CSF cluster
Lobule of vermis
Cerebellar lobule
4.59/6.22
5.01
Pos. max. R/L
95
41, 42
Amygdala Cerebellum cluster
109, 115, 116
Lobule of vermis
ROI No.
867 303
−2.33/−2.19
1809 ns
1982 −5.6/−3.91
434
989
1246
676
1689
299
341
Voxel No.
−4.15/−3.33
ns/−2.61
ns
ns
ns
ns
ns
ns
Neg. min. R/L
5/6(83%)
3/6(50%)
4/6(67%)
4/6(67%)
4/4(100%)
4/4(100%)
4/4(100%)
3/3(100%)
3/3(100%)
4/5(80%)
5/5(100%)
ROI prevalence
NIH-PA Author Manuscript
ROI
Ma et al. Page 23
NIH-PA Author Manuscript
IEEE Trans Biomed Eng. Author manuscript; available in PMC 2011 December 1.