Automatic Link Balancing Using Fuzzy Logic Control of Handover Parameter Pedro M. d’Orey∗‡ , Mario Garcia-Lozano† and Michel Ferreira∗ ∗
DCC, Faculty of Sciences, University of Porto, Rua do Campo Alegre, 1021/1055, 4169-007 Porto, Portugal † Technical University of Catalonia (UPC), Av. Canal Olimpic 15, EPSC-114, 08860 Castelldefels, Spain ‡ Queen Mary, University of London, Mile End Rode, London ET4NS, United Kingdom
[email protected],
[email protected],
[email protected]
Abstract—Self-optimisation will enable future wireless networks to manage themselves in a continuous and independent way. By dynamically adjusting relevant radio parameters during network operation a system that adapts to environmental changes can be created. This paper presents a novel selfoptimisation algorithm based on Fuzzy Logic Controlling. Taking into consideration measurements gathered from the network, the Fuzzy Logic Controller balances continuously the individual link gain and the network gain. Results have shown the feasibility of the proposed approach, superior improvements on network performance and a capacity increase of 23%. It is envisioned that self-optimisation will lead to significant reductions in capital and operational expenditures by maximizing the utilisation of the air interface.
I. I NTRODUCTION Over the last decades the evolution of radio access networks has been tremendous. Several technologies have been developed and continuously improved. However, wireless access networks are becoming increasingly complex, heterogeneous and costly. Furthermore, in order to remain competitive in a highly dynamic market, network operators need to reduce expenditures (CAPEX/OPEX), to improve the utilisation of current as well as of future networks and to reduce the timeto-market of innovative services, just to name a few. Future wireless networks are envisioned to exhibit a high degree of self-organisation in several management functions due to the introduction of automation. Self-organisation properties encompass all tasks that enable future mobile radio networks to manage themselves in an continuous and independent way. The main idea behind Self-Organizing Networkss (SONs) is the transformation of all network management tasks, namely network planning, configuration and optimisation, into an automated process with minimal human intervention. Recently, the importance of this topic has been recognised by the standardisation body 3GPP and the IEEE802.16 group that started working on SON (e.g. see [1], [2]). One of the main properties of self-organisation is selfoptimisation, which is related to the automation of the network optimisation task. Self-optimisation implies self-tuning of relevant radio parameters during operation in order to adapt to the environmental changes [2]. During network planning (optimisation) radio parameters are initially (continuously) set to best fulfill the capacity, coverage, Quality of Service (QoS) and cost targets; the objective is to have the best balance from
the operator’s perspective. However, several factors, such as traffic fluctuations, service changes, or user mobility, can cause impairments on network performance/QoS in certain sectors or sub-systems, resulting in the operator’s requirements not being met. By dynamically adjusting relevant radio parameters, based on the current state of the network, a system which adapts to environmental changes can be conceived. The topic of self-optimisation is becoming increasingly important among the scientific community. Initial works on this topic have been published by researchers from Nokia Research Centre. The control of a single soft radio parameter was proposed in several technical papers: Uplink (UL) load level target [3][4], Downlink (DL) load level target and link power maxima [5], Eb /N0 in the DL and UL for data traffic [6], common pilot channels powers [7], handover window [8], among others. Three European projects AROMA [9], GANDALF [10] and SOCRATES [11] have also produced important concepts, algorithms and frameworks in this area. All these studies have demonstrated the feasibility and improved system performance due to the implementation of selfoptimisation. Apart from the parameter that delivers the best performance, the importance of the optimisation methods must be underlined. The design of the controllers governing self-optimisation is one of the most challenging tasks to be considered. The implementation of these controllers requires specific knowledge of the network trade-offs and consequences of parameter tuning [12]. In previous studies the most popular schema was the rule-based one. This strategy is defined by a set of rules (set of IF-THEN clauses) that is built with the knowledge of an expert on the network functioning, for more details refer to [3][5][6]. The performance of the rule based approach is not necessarily superior in terms of convergence speed, stability, or robustness to other optimisation methods. Indeed, recently Fuzzy Logic (FL) was presented as an effective method for automatic parameter tuning. Several studies [13][14] concluded that Fuzzy Logic Controllers (FLCs) constitute a simple and efficient framework for implementing complex control tasks. The originality of this work is the proposal of a novel algorithm based on FL Controlling, whose applicability is tested in a study case where a soft radio parameter is optimised based on a set of performance data, which is expected to to deliver performance and capacity enhancements.
This paper is divided as follows: section II states the problem to be solved, section III details a framework to support self-optimisation and presents the solution principle, section IV introduces the scenario of study, section V presents and discusses the main results, and finally, conclusions and future work close the paper in section VI.
UTRAN Parameters
Counters
FZ
Reference
P
DF
Monitoring
II. P ROBLEM S TATEMENT Currently there exists a paradox between the static network parameter setting (infrequent and on-demand optimisation) and the dynamic nature of the environment where mobile networks work. WCDMA networks have a quasi-static configuration of its network parameters; the (re)-selection of these parameters is solely done during network planning and optimisation phases. However, the dynamic nature of the environment (e.g. service transitions, user mobility, traffic fluctuations or propagation changes) can cause impairments in the network performance that need to be corrected by tuning appropriate parameters. By introducing a feedback loop between network measurements and radio parameter setting, self-optimisation mechanisms can bring dynamism into network configuration, which will be matched to the dynamic situation of the network. Radio Resource Management (RRM) algorithms are responsible for supplying optimum coverage, offering the maximum planned capacity, guaranteeing the required QoS and ensuring efficient use of physical and transport resources [15]. These procedures complement the planning of the radio access network. Whereas this process is static in essence, RRM allows a finer tuning of the network and allows a certain adaptation to real time traffic variations. However, the parameters that govern these algorithms are also usually planned to be static, and thus variations beyond the very short-term are not captured. One of the most important functions is handover control since it promotes user mobility by maintaining ongoing connections betweens cells/sectors and is an essential interference mitigating tool in WCDMA. During Soft Handover (SHO)(er) a User Equipment (UE) can be simultaneously connected to several cells/sectors, adding and dropping links when certain conditions are met. SHO allows decreasing the transmission power in the DL and UL directions due to the combination of signals from two or more different links. In the DL, UEs receive power from all cells participating in the handover. The different signals are perceived as multi-path components that can be coherently combined and this provides the benefit of macro-diversity. Even though each individual link power is lower than a hard handover case, extra DL resources (both power and codes) are needed. In fact more interference is usually generated in the SHO case with the correspondent loss in capacity [8]. This way, there is a trade-off between the individual link gain and the additional resource consumption. On the other hand, in the UL direction, the combination or selection of two or more signals from different links at the Node-B or in the Radio Network Controller (RNC) improves the UL signal quality and consequently reduces the required transmission power for the UE. Moreover the link reliability is increased due to the macro-diversity gain. Given this, there
DM
RB Control Algorithm
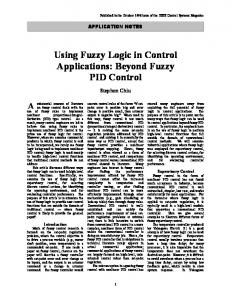
Fig. 1.
DB Learning & Memory
Online Automatic Tuning System (ATS)
is a trade-off between the UL and global DL gains due to opposite effects. There exists a variety of SHO parameters (e.g. Addition, Drop and Replacement Window, maximum number of cells in the Active Set (AS)) that, with varying degrees, are able to control the network capacity, coverage and QoS of UMTS networks [8]. In particular, studies [8], [15] have shown that the Add Window parameter shows a higher impact than other parameters and that this parameter has a good sensitivity to specific Key Performance Indicators (KPIs). Currently, these parameters are quasi-static, being infrequently changed by the operator, solely during the optimisation operation. Different scenarios have distinct optimal configurations for the SHO parameters. In fact, the network may evolve from UL to DL limited situations and vice-versa. A careful and continuous adjustment of selected parameters can allow a continuous adaptation to the current scenario by performing a shift in the optimisation point. This means that for different scenarios one of the transmission directions, whether DL or UL, is going to be favoured with the final aim of correcting capacity unbalances between them. This treatment is novel in the context of FDD networks, only present in articles such as [8] and [16]. In this sense, this work presents a framework and novel algorithm for the automatic tuning of SHO parameters to balance DL and UL capacity. III. L INK BALANCING - FRAMEWORK & ALGORITHM A functional architecture to support self-optimisation has been proposed in reference [8]. A conceptual representation is depicted in Figure 1. The Automatic Tuning System (ATS) creates a feedback loop between network measurements and network parameters. The network is constantly monitored, input data is processed (filtering, correlation, and aggregation) and selected KPIs are compared to the operator’s reference values by the Monitoring block. Concurrently, selected KPIs are stored in a knowledge database where they will be statistically analysed (Learning & Memory). When any of the cells surpasses the reference criteria, an alarm is triggered to the Control Algorithm. Based on the information from the Learning & Memory block, the Control Algorithm decides on the action to take, which may compromise the change of one or several network parameters.
A. Monitoring block In order to determine the current state of radio access networks the ATS Monitoring block tracks a set of input measurements. After setting business targets, the network operator can define the targets for network optimisation. If these targets are not met, an alarm is triggered and passed to the Control Algorithm entity, which takes the adequate measures to improve the network performance. For the current algorithm the following KPIs have been selected: • KPI Power Link (% of users that surpass the maximum power per link), which is an aggregated measure of the contribution of the individual link in the SHO algorithm. • KPI SHO Overhead, which measures the additional resources required by the SHO. To ensure precise monitoring of network performance, data must be pre-processed. Pre-processing allows extracting the strictly necessary information from the data. In a real functioning network, pre-processing has the following main functions: to filter the incoming KPIs, to handle the lack of performance values and to balance variables. Since the later two problems do not occur in a simulated environment, only data filtering is here considered. In the present work, a sliding averaging window acts as a low pass filter removing the instantaneous fluctuations of the signal. The current window size (N) is equal to 10 s, which is a good compromise between reactivity and stability. In particular, Figure 2 depicts a KPI’s (KPI Power Link) original signal and its filtered version. The filtered version is able to properly model the original signal as well as to remove the instantaneous fluctuations. After defining the selected KPIs and after explaining how they are processed, the Fuzzification characteristics are given. The Fuzzification component determines the membership degree of the measured inputs to each fuzzy set via the Membership Functions (MFs). The universe of discourse of the input depends on the nature of the variable (e.g. [0 1] for the SHO overhead) but the universe of discourse of the output is fixed to the interval [0 1]. The linguistic variables are characterised by a name and by a set of names of linguistic values. Table I presents the linguistic variables for the input and output parameters. Triangular, trapezoidal and S/Z-shaped MFs have been selected because they have proven to work
Mean 8.101 ; Std 5.7539 25 Original Filtered 20
KPI_Power_Link [%]
Herein this architecture is extended to include Fuzzy Logic Controlling. A FL system is a non-linear mapping of an input data (feature) vector into a scalar output [17]. FLCs are composed of four components, namely Fuzzification (FZ), Decision Making (DM), Rule Base (RB) and Defuzzification (DF). A FLS maps crisp inputs into fuzzy sets (Fuzzification), proceeds with the decision making process based on the information from the Rule Base, which consists of a collection of IF-THEN statements, and afterwards maps fuzzy sets to crisp outputs (Defuzzification). Fuzzy control can be considered more human-oriented reasoning and to be closer to the human natural language, which is a clear advantage against classic logic control systems. In the following each of the constituting blocks of the ATS is presented in details.
15
10
5
0
0
Fig. 2.
1000
2000
3000 Frame [#]
4000
5000
6000
Original and Filtered KPI Power Link
effectively and are simple to design. The vertices of the MF correspond to the commonly considered value for each linguistic variable. TABLE I L INGUISTIC VARIABLES Linguistic Variables KPI Power Total KPI Power Link KPI SHO Overhead Add Window
Term Set ∈ {Low,Medium,High} ∈ {Low,Medium,High} ∈ {Low,Medium,High} ∈ {Very Low, Low, High, Very High}
B. Learning & Memory block The Learning & Memory block gathers information from the network state and determines trends based on network data. In the current implementation this block accumulates data coming from the network (e.g. KPIs) and stores the Rule Base (RB) of the FLC. The FLC that was developed has two inputs and one output parameter (MISO system). Taking into consideration that there exist three linguistic terms for each input, the resulting RB has 9 rules. The formulation of the fuzzy rules is achieved by employing a combination of experts’ knowledge and the existing model of RRM processes. Since the algorithm has as main goals to improve the reference metrics while improving the network capacity, the rationale for the algorithm is the following: • Increase Add Window at cells with low SHO overhead or with high number of users with problems at the link level. Since the SHO area is increased, additional cells can be added to the AS, which implies increased SHO overhead and improved UL quality. • Lower Add Window at cells with high SHO overhead or with low percentage of users with problems at the link level. Since this way the SHO area is decreased, resources that are unnecessarily being consumed at the DL are released. The drawback is the degradation of the UL capacity and the link quality. C. Control Algorithm The Control Algorithm is the most important block of the ATS and is responsible for incremental parameter tuning. The
core of the Control Algorithm is the FLC interference engine and Defuzzification block. The decision making process is based on the information provided from the Monitoring block and from the Learning & Memory block. The FLC receives performance measurement data from the Monitoring block and retrieves the RB from the Learning & Memory block. With this information the FLC decides on the actions to take (increase/decrease Add Window). In the current implementation parameter tuning is performed periodically to ensure maximum utilisation of the air interface and to permanently improve network performance. A triggered solution is also feasible but the system just responds to degraded situations and has increased reaction time. Regarding the decision making (DM) logic component, the fuzzy implication method and the method to aggregate all the output fuzzy sets must be defined. The input for the implication process is given by the antecedent. This single value given by the antecedent shapes the consequent (output fuzzy set) using a function. The used function in this work is the min function, which truncates the output fuzzy set. After applying the implication method to each rule, the output fuzzy sets are combined into a single fuzzy set. The process of combining and producing a single fuzzy set is denominated aggregation, which can use the max function as in this work. Defuzzification performs the conversion of the aggregated fuzzy set into a crisp (non-fuzzy) control action. One of the most popular Defuzzification method is the centroid method, which calculates the centre of the area of the aggregated output fuzzy set. The selection of all the above methods has been done considering the time-scale of the SHO process and the computational effort of FLCs. In this sense fast computational methods have been selected. IV. S IMULATION SCENARIO The feasibility and performance of the proposed algorithm has been tested by means of dynamic system-level simulations. The WCDMA dynamic simulator implements all the necessary functions: propagation, mobility, traffic, and RRM algorithms. Regarding the propagation model, the COST231-Hata model and the log-normal shadowing model (mean: 0 dB and std: 8 dB) are used. A pedestrian mobility model has been selected (speed: 1 m/s). The UEs were uniformly distributed in the scenario at the beginning of the simulation; the initial number of users is 1100. Regarding the service mix four services are considered (voice and data). The service mix evolves from an UL limited situation into an increasingly DL limited scenario. RRM algorithms are responsible for efficient utilisation of the air interface resources. RRM is needed to guarantee Quality of Service (QoS), to maintain the planned coverage area and to offer high capacity [18]. RRM algorithms can be divided into power control, handover control and congestion control. Congestion control can be further divided into admission control and packet scheduling. All these functions have been implemented in the simulator. Power control was implemented based on the ideas presented in References [19][20] that state that the power control problem can be
reduced to the macroscopic analysis (in terms of aggregated effects of all users of a BS) without any loss of accuracy. SHO is realistically considered as in Reference [21]. Admission Control is based on measurements of interference levels in the air interface (load factor strategy) [18]. The scenario is based on 3GPP specifications: urban and macro-cellular. The simulation has an area of 25 km2 and contains 42 evenly distributed tri-sectorial cells (14 BSs). The simulation runs for 10 minutes, which corresponds to 6000 snapshots. The main parameters are given in Table II. For more informations on the simulator please refer to [22]. TABLE II S IMULATION PARAMETERS Element Node-B
UE
Network
RRM
Parameter Antenna type and gain Max. Transmission power Max. Transmission power per link (DL) Noise Power Number Pilot transmission power Antenna type and gain Max. Transmission power Number Service Mix (12.2/ 64/ 256/512 kbps) Speed Bandwidth Chip rate Frequency Number of Snapshots AC - Load factor threshold Handover - Active Set Size Handover - Initial Add Window
Value 65 ◦ - 18 dBi 43 dBm 30 dBm -107 dBm 42 30 dBm omni - 0 dBi 21 dBm 1100 70/ 20/ 10/ 0 1 m/s 5 MHz 3.84 Mcps 2 GHz 6000 0.5 3 6 dB
V. R ESULTS & D ISCUSSION In order to prove the advantages of the ATS, two scenarios are considered: i) control block is disabled; and ii) control system is activated. In order to quantify the improvements due to the introduction of self-optimisation, a set of metrics has been defined: the two monitored KPIs, Cell Throughput, DL Load (KPI Power Total) and UL Load. The results have been analysed at a cell perspective as well as at a network wide perspective. A. Scenario I - ATS Control off In order to demonstrate the functionality of the ATS Monitoring block, a scenario, where the ATS Control block is disabled, is analysed. As stated previously the scenario evolves from an UL limited situation into an increasingly DL limited situation. Figure 3 presents four metrics for the reference cell. As time evolves all the four metrics show an upward trend and the operator’s reference values are not met. The main reason for degraded performance is incorrect configuration of the SHO parameter Addition Window. The parameter setting was appropriate for the initial service mix (mainly voice users) but inappropriate for a service mix with mainly data users. Thus, self-optimisation mechanisms must be introduced to automate the optimisation process and guarantee that the network performs optimally regardless of the services being used.
80
25
70
ATS off ATS on
70
4500
ATS off ATS on
ATS off ATS on
ATS off ATS on
60
4000
20
40 30
15
10
20
50 Throughput [kbps]
50
KPI_SHO_Overhead [%]
KPI_Power_Link [%]
KPI_Power_Total [%]
60
40
30
0
1000
2000
3000 Frame [#]
4000
5000
0
6000
0
(a) KPI Power Total
1000
2000
3000 Frame [#]
4000
5000
0
(b) KPI Power Link Fig. 3.
70
30
20
15
10
5
20
3000 Frame [#]
4000
5000
0
1000
2000
3000 Frame [#]
4000
5000
6000
0
0
(a) KPI Power Total
1000
2000
3000 Frame [#]
4000
5000
6000
(b) KPI Power Link Fig. 4.
0
1000
2000
3000 Frame [#]
4000
5000
6000
(d) Cell Throughput
3200 ATS off ATS on
40 35 30 25 20 15
5
ATS off ATS on
3000 2800 2600 2400 2200 2000 1800
10 10
1500
6000
45
Aggregated KPI_SHO_Overhead [%]
40
2000
Metrics - reference cell
ATS off ATS on Aggregated KPI_Power_Link [%]
50
1000
(c) KPI SHO Overhead
25 ATS off ATS on
60 Aggregated KPI_Power_Total [%]
0
6000
2500
2000
10
Throughput [kbps]
0
3000
20
5 10
3500
1600
0
1000
2000
3000 Frame [#]
4000
5000
6000
(c) KPI SHO Overhead
1400
0
1000
2000
3000 Frame [#]
4000
5000
6000
(d) Cell Throughput
Aggregated Metrics - Network
B. Scenario II - ATS Control enabled In Scenario II, the ATS Control block is enabled and consequently automatic re-configuration of the SHO parameter take place. There exists a good sensitivity between parameter and KPIs: variations in the Add Window parameter imply variations in the KPIs. The analysis of the results shows higher sensitivity values for KPI Power Link and KPI SHO Overhead, which corroborates the selection of these two KPIs. To conclude, the selected parameter allows to control effectively the selected KPIs due to the high sensitivity values. Firstly, the results are analysed from a cell perspective as shown in Figure 3. For all simulation time three metrics are improved (see Sub-figures 3a, 3b and 3c) with the implementation of self-optimisation mechanisms. Due to the continuous adaptation to the environmental conditions, the trade-off point (link vs. additional resource consumption) is constantly changed. Users that are inadequately in SHO to the reference cell are transferred to the neighbouring cells, which implies a decrease in the average DL transmission powers/load and in the resource consumption. Results are also investigated from a network perspective. The ATS should perform local optimisations as long as the network performance improves as well. Figure 4 shows aggregated network performance metrics. The ATS is able to improve the network performance for all the four metrics. As presented previously, there is an upward trend for all the KPI (except for KPI SHO Overhead) that is in-line with the more demanding service mix. As the service mix becomes more demanding, the ATS gains also increase, which clearly shows that a fixed parameter setting is not feasible. Table III presents the average performance improvements. As observed at the
cell level, there is a significant reduction of the three first KPIs when self-optimisation mechanisms are active. The average throughput per cell also shows an improvement of 23%, which means that the network capacity is greatly improved. Although locally some reductions in capacity may occur (as in the reference cell - see Sub-figure 3d), there will always be an improvement at the network level because users at highly loaded cells are transfered to cells with low load, which can best serve them (lower transmission powers). The only drawback of the implementation of the ATS was an expected and logical slight increase on the average UL transmission power. Since on the average the AS size was decreased, some UEs where not always able to add the best links (links that require the minimum power to achieve the required Eb /N0 ) and consequently the UL interference increases slightly. However, for the current scenario, this fact did not cause degraded UL performance. TABLE III N ETWORK KPI GAINS KPI Power Total Power Link SHO Overhead Throughput UL load
Gain (ATS on/off %) -65.47% -89.87% -63.78% +23.07% +7.76%
To finalize, simulation results have shown feasibility of the proposed approach. Furthermore, the benefits in terms of network performance arising from the implementation of the Automatic Tuning System (ATS) have been quantified in this case study.
VI. C ONCLUSIONS Self-optimisation allows matching the static network parameter setting to the dynamic environmental conditions. This paper proposes a three block functional architecture to support self-optimisation algorithms. Besides an innovative automated tuning algorithm based on FL Controlling was designed and evaluated to keep UL and DL requirements balanced. Our results have shown an improvement in the main metrics at a cell and network level due to the adaptation of SHO parameters to environmental conditions and load balancing. A capacity increase of 23% was observed. Thus, self-optimisation can lead to a reduction in capital and operational expenditures. Self-optimisation is a recent research topic and there are still many challenges to address in this field. Firstly, functionality distribution over different network elements and architecture type (centralised,distributed or hybrid) should be studied in more detail; research should be performed on topics, such as performance and scalability . The study of novel optimisation methods and related parametrization also presents itself as interesting and valid option. More emphasis should be placed on the definition of relevant performance metrics, and on the alignment of scenarios, to facilitate the comparison of proposed algorithms. Furthermore, the concept should be extended to novel and future wireless networks (e.g. LTE). ACKNOWLEDGMENT The authors would like to thank the financial support provided by Queen Mary, University of London (QMUL), and by the JEDI project funded by the Portuguese Foundation for Science and Technology (FCT) under the contract number PTDC/EIA/66924/2006. Part of this work has been supported by the Spanish Industry Ministry through the project TEC2008-06817-C02-02. R EFERENCES [1] 3GPP, “Self-Organizing Networks (SON) Policy Network Resource Model (NRM) Integration Reference Point (IRP): Requirements,” Technical Specification Group RAN, Tech. Rep. TR 32.521, June 2009. [2] E. Bogenfeld, I. Gaspard, C. Rothenberg, and H. Einsiedler, “Provision of self-x functionalities in IEEE 802.16 networks - e.g. selfconfiguration and self-optimization,” IEEE P802.16, Tech. Rep. C8021606/027, November 2007. [3] A. Hoglund, J. Pollonen, K. Valkealahti, and J. Laiho, “Quality-based Auto-tuning of cell uplink load level targets in WCDMA,” in the 57th IEEE Vehicular Technology Conference (VTC 2003 Spring), vol. 4. Jeju, Korea: IEEE, USA, April 2003, pp. 2847–2851. [4] J. Picard, H. Dubreil, F. Garabedian, and Z. Altman, “Dynamic Control of UMTS Networks by Load Target Tuning,” in the 59th IEEE Vehicular Technology Conference (VTC 2004 Spring), vol. 4. Milan, Italy: IEEE, USA, May 2004, pp. 2351–2354.
[5] A. Hoglund and K. Valkealahti, “Quality-based tuning of cell downlink load target and link power maxima in WCDMA,” in the 56th IEEE Vehicular Technology Conference (VTC 2002 Fall), vol. 4. Vancouver, Canada: IEEE, USA, September 2002, pp. 2248–2252. [6] A. Hamalainen, K. Valkealahti, A. Hoglund, and J. Laakso, “Auto-tuning of Service-specific Requirement of Received EbN0 in WCDMA,” in the 56th IEEE Vehicular Technology Conference (VTC 2002 Fall), vol. 4. Vancouver, Canada: IEEE, USA, September 2002, pp. 2253–2257. [7] J. Flanagan and T. Novosad, “WCDMA network cost function minimization for soft handover optimization with variable user load,” in the 56th IEEE Vehicular Technology Conference (VTC 2002 Fall), vol. 4. Vancouver, Canada: IEEE, USA, Septmber 2002, pp. 2224–2228. [8] M. Garcia-Lozano, O. Salient, J. Perez-Romero, A. Gomes, P. d’Orey, and S. Ruiz, “Automated Up- and Downlink Capacity Balancing in WCDMA Networks,” in the 66th IEEE Vehicular Technology Conference Fall 2007 (VTC 2007 Fall) . Baltimore, USA: IEEE, USA, October 2007, pp. 336–340. [9] AROMA (Advanced Resource management solutions for future all IP heterOgeneous Mobile rAdio environments, IST Project (IST-027567), 6th Framework Program of the European Union. [Online]. Available: http://www.aroma-ist.upc.edu/ [10] GANDALF (Monitoring and self-tuning of RRM parameters in a multi-system network), EUREKA-CELTIC Project (P-ID-CP2-014). [Online]. Available: http://www.celtic-gandalf.org/ [11] SOCRATES (Self-Optimisation and self-ConguRATion in wirelEss networkS), IST Project (IST-216284), 7th Framework Program of the European Union. [Online]. Available: http://www.fp7-socrates.org/ [12] O. S. (ed.), “D09 - First report on AROMA Algorithms and Simulation results,” EC-IST Office, Tech. Rep. IST-4-027567, November 2006. [13] H. Dubreil, Z. Altman, V. Diascorn, J. Picard, and M. Clerc, “Particle swarm optimization of fuzzy logic controller for high quality RRM autotuning of UMTS networks,” in the 61st IEEE Vehicular Technology Conference (VTC 2005 Spring), vol. 3. Stockholm, Sweden: IEEE, USA, May 2005, pp. 1865–1869. [14] R. Nasri, Z. Altman, H. Dubreil, and Z. Nouir, “WCDMA Downlink Load Sharing with Dynamic Control of SHO Parameters,” in the 63rd IEEE Vehicular Technology Conference (VTC 2006 Spring), vol. 2. Melbourne, Australia: IEEE, USA, May 2006, pp. 942–946. [15] J. Laiho, A.Wacker, and T. Novosad, Radio Network Planning and Optimisation for UMTS. John Wiley & Sons, 2006. [16] J. Yao, D. Wong, and Y. H. Chew, “Capacity Balancing Between the Reverse and Forward Links in Multiservice CDMA Cellular Networks With Cross-Layer Design,” IEEE Transactions on Vehicular Technology, vol. 55, no. 4, pp. 1397 –1411, July 2006. [17] J. Mendel, “Fuzzy logic systems for engineering: a tutorial,” Proceedings of the IEEE, vol. 83, no. 3, pp. 345–377, Mar 1995. [18] H. Holma and A. Toskala, WCDMA for UMTS - Radio Access for Third Generation Mobile Communications. John Wiley & Sons, 2004. [19] L. Mendo and J. Hernando, “On dimension reduction for the power control problem,” IEEE Transactions on Communications, vol. 49, no. 2, pp. 243–248, February 2001. [20] S. Ruiz, J. Olmos, and F. Casadevall, “Dynamic power allocation and RRM parameters,” in The IST Mobile & Wireless Telecommunications Summit 2002. Thessaloniki, Greece: EC, Brussels, June 2002, pp. 602– 606. [21] 3GPP, “Radio Resource Management Strategies,” Technical Specification Group RAN, Tech. Rep. TR 25.922, March 2002. [22] P. M. d’Orey, “Optimisation of mobile networks by means of automatic tuning,” Master’s thesis, Queen Mary, University of London, 2009.