neurons in the C. elegans worm. Even though this ... age processing and machine learning algorithms are needed to automate ... ating a projection which is captured as a digital image. See ... The fourth feature is .... [7] Rafael C. Gonzalez and Richard E. Woods, Digital image pro- cessing, Prentice-Hall, 2. ed. edition, 2002.
AUTOMATIC MARKUP OF NEURAL CELL MEMBRANES USING BOOSTED DECISION STUMPS Kannan Umadevi Venkataraju1,2 , Antonio R. C. Paiva2 , Elizabeth Jurrus1,2 , Tolga Tasdizen2,3 School of Computing, University of Utah Scientific Computing and Imaging Institute, University of Utah 3 Electrical and Computer Engineering Department, University of Utah 1
2
ABSTRACT To better understand the central nervous system, neurobiologists need to reconstruct the underlying neural circuitry from electron microscopy images. One of the necessary tasks is to segment the individual neurons. For this purpose, we propose a supervised learning approach to detect the cell membranes. The classifier was trained using AdaBoost, on local and context features. The features were selected to highlight the line characteristics of cell membranes. It is shown that using features from context positions allows for more information to be utilized in the classification. Together with the nonlinear discrimination ability of the AdaBoost classifier, this results in clearly noticeable improvements over previously used methods. Index Terms— Serial-section TEM, cell membrane detection, AdaBoost, Segmentation, Machine Learning. 1. INTRODUCTION Neuroscientists are currently developing new imaging techniques to better understand the complex structure of the central nervous system. In particular, researchers are making efforts to map the connectivity of large volumes of individual neurons in order to understand how signals are communicated across processes. The most extensive study undertaken thus far uses electron microscopy to create detailed diagrams of neuronal structure [1] and connectivity [2, 3]. The most well known example of neural circuit reconstruction is of the 302 neurons in the C. elegans worm. Even though this is one of the simplest organisms with a nervous system, the manual reconstruction process took ten years. Human interpretation of data over large volumes of neural anatomy is so labor intensive that very little ground truth exists. For this reason, image processing and machine learning algorithms are needed to automate the process and allow analysis of large datasets by neural circuit reconstruction. Serial-section transmission electron microscopy (TEM) is the preferred data acquisition technology for capturing This work was supported by NIH R01 EB005832, NIH EY0015128, EY002576, NEI Vision Core EY014800, USTAR and HHMI.
images of large sections of neuronal tissue. Images from TEM span a wide field of view, capturing processes that may wander through a specimen and have an in-plane resolution useful for identifying cellular features such as synapses. These structures are critical in understanding neuron activity and function. Images from serial-section TEM are captured by cutting a section from the specimen and suspending it over an electron beam which passes through the section creating a projection which is captured as a digital image. See figure 2(a) for an example serial-section TEM image corresponding to a cross-section of the nematode C. elegans with a resolution of 6nm×6nm×33nm. An accurate mapping of neuron features begins with the segmentation of the neuron boundaries. Jurrus et al. [4] uses these boundaries to extract the three dimensional connectivity present in similar image volumes. In their method, a contrast enhancing filter followed by a directional diffusion filter is applied to the raw images to enhance and connect cellular membranes. The images are then thresholded and neuron cell bodies are identified using a watershed segmentation method. This method fails when membranes are weak or there are too many intracellular features. This indicates that more adaptive algorithms need to be developed to segment these structures. For this reason, machine learning algorithms have been shown as a successful alternative for identifying membranes in TEM data. In related work, Jain et al. [5] uses a multilayer convolution neural network to classify pixels as membrane and non-membrane. However, the stain used on the specimen highlights cell boundaries, attenuating intracellular structures, simplifying the segmentation task. Another successful application of learning applied to TEM is the use of a perceptron trained with a set of predefined image features [6]. However, extensive post processing is required to close the detected cell membranes and remove internal cellular structures. The method described in this paper improves upon previous work by utilizing context information for classification. By including the features of neighboring pixels as inputs to the classifier, the classifier can utilize the context to deal with membrane disconnectivities. The features were designed to improve the classification accuracy of elongated structures,
Image enhancement
Feature extraction
Classifier
image Fig. 1. Diagram of the proposed method.
Fig. 3. Stencil neighborhood. in previous works [4, 5, 6]. The other three features are properties derived from the Gaussian smoothed Hessian matrix, " 2 # 2 H(x, y) = Gσ ∗
∂ I ∂x2 ∂2I ∂y∂x
∂ I ∂x∂y ∂2I ∂y 2
,
(1)
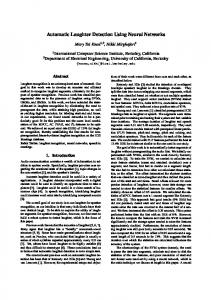
Before feature extraction, contrast limited adaptive histogram equalization (CLAHE) [7] is applied to the raw electron microscopy images. This improves the contrast of the membranes, fixes local variations in contrast and overall brightness variability between images [4]. The decrease in variability greatly helps the classifier since it reduces the difference between training and testing images. An example of such CLAHE enhancement is shown in figure 2(b).
where I is the (CLAHE enhanced) image, and Gσ is the Gaussian blurring kernel with standard deviation σ. The Hessian matrix was used in the context of filtering [8] and segmenting [6] electron microscopy images. Since membranes are elongated structures the eigenvalues of the smoothened Hessian matrix represent the anisotropic nature of the region around the pixel. The eigenvalue of the principal eigenvector of the Hessian is proportional to the gradient orthogonal to the membrane and the smaller eigenvalue is proportional to the gradient along the cell membrane. The fourth feature is the orientation of the principal eigenvector at that point. The inclusion of the this feature gains significance during learning of the classifier because the neighboring pixels features are also considered. The feature vector for every pixel in the image consists of the concatenated feature values of that pixel and its neighbors. The neighborhood is defined by a star shaped stencil with its 8 arms forking out every 45 degrees (figure 3). This neighborhood has the ability to sample a larger context area around the pixel than choosing a complete sample of the local area for the same number of features. We show in the results section that the neighboring pixel features adds relevant information for the classification. The context helps to identify membranes at regions were there are minor discontinuities, as it allows for the classifier to utilize the context information to “interpolate” the cell membrane. In this regard, the orientation feature plays an important role by imposing a smoothness constraint on the curvature of the membrane.
2.2. Features
2.3. Classifier
Four features were computed for each pixel in the image: the pixel intensity, and eigenvalues and orientation of the first eigenvector of the Gaussian smoothed Hessian matrix. The gray value of the pixel is utilized since membranes are usually dark and therefore is useful for segmentation, as verified
We propose to utilize a classifier trained with AdaBoost [9] since such a classifier can model a nonlinear decision boundary. AdaBoost is a meta-algorithm that builds the classifier from “weak” classifiers, such as a decision stump. At each round, AdaBoost adds a weak classifier to the set of weak
(a)
(b)
Fig. 2. Example serial-section TEM images: (a) original and (b) CLAHE enhanced. like the membranes. The non-linear decision boundary is learnt by a classifier trained under the Adaboost framework. The following sections gives the overview of the entire process, followed by the details on the image enhancement, learning procedures and finally a discussion of the results on an C. elegans dataset. 2. METHODS We now describe in detail the proposed method. Figure 1 provides an overview of the fundamental steps. 2.1. Image Enhancement
1
0.92
0.9
0.9
0.8
0.7
0.88
True Positive rate
Area under ROC curve
0.94
0.86
0.84
0.82
0.6
0.5
0.4
0.3 0.8
Training
0.2
Testing 0.78
Testing without neighborhood
0.1 0.76 0 10
1
10
2
10
3
10
4
10
Boosting Rounds
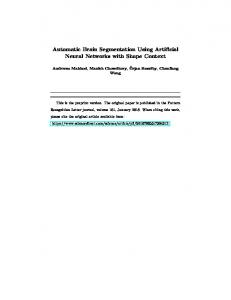
Fig. 4. Semilog plot of number of boosting rounds versus the area under the ROC curve for that boosting round.
0
Jurrus 2008
0
0.1
0.2
0.3
0.4
0.5
0.6
0.7
0.8
0.9
1
False Positive rate
Fig. 5. ROC curves of the classifiers trained with AdaBoost at boosting round 3000 and, for comparison, the ROC for the method by Jurrus et al. [4] is also shown.
classifiers by training for best classification performance according to samples weights. The sample weights are varied depending on the classification result of the previous round, by increasing the weights of incorrectly classified samples and decreasing the weights of correctly classified samples. The final classifier is a weighted sum of the weak classifiers according to their accuracy in the training rounds. It has been observed in previous experiments that the obtained classifiers generally do not overfit to training data [10]. In this paper, decision stumps are used for the weak classifier. Decision stumps are the simplest form of binary decision trees with just one decision node. The decision stump makes the classification decision based on just the value of a particular feature with respect to a threshold. Given the feature set, desired classification and prior of the samples, the threshold for a particular feature can be chosen based on the probability distribution functions of membrane and non-membrane classes over the feature values without making any underlying assumption about the distribution of the feature. This gives the stump of best accuracy compared to the ones built using other metrics like information gain. The AdaBoost mechanism along with the decision stump classifier acts as a feature selection mechanism [10].
unbalanced in the order of 1:10 and thus affect the performance of the classifier. The classifier trained with a balanced dataset (1:1 ratio) had the best accuracy compared to classifiers trained with various ratios of positive (membrane) and negative (non-membrane) samples, with results shown for this case. The negative samples were chosen at random. The feature vectors were generated as described in section 2.2, with a 7 × 7 neighborhood and Gaussian standard deviation σ = 5. At any location, these parameters yielded 100 features (25 points in the neighborhood × 4 features for every pixel). Initially, the decision stumps were boosted for 10000 rounds and the area under the ROC (averaged over the 5 folds) computed after each round. We can observe from figure 4 that the area under the ROC curve flattens out after around 3000 rounds of boosting. The corresponding ROCs are shown in figure 5, and the test images results in Figure 6. Figure 5 clearly shows that the use of neighborhood context combined with proposed feature set yields significantly better results than thresholding of the diffusion filter image [4]. Moreover, comparing with the results without context information underlines the importance of using the neighborhood for membrane detection.
3. RESULTS
4. CONCLUSION
The proposed method for cell membrane detection was tested on a C. elegans dataset. The entire volume is made of 149 slices of 662×697 grayscale images. Out of this stack, 5 image slices where chosen at random from the first 50 slices and the accuracy of the method was assessed using 5-fold crossvalidation. In each case, the training was done using four of the five images and tested on the image that was left out of training. The ratio of membrane/non-membrane pixels is
The proposed method utilizes neighborhood context information to improve the accuracy of membrane detection. Along with the nonlinear discrimination ability of the AdaBoost classifier and the Hessian feature set, this results in improved membrane detection compared to previous methods. Thus one can expect a more robust segmentation of the individual neurons. However, the classifier fails to discern certain structures and textures from membranes, which may result in
Test Image 1
over-segmentation of individual neurons. Utilizing additional features that discriminate these regions from membranes may prevent these false positives. Moreover, recent work suggests that cascading the classifier predictions as an additional feature set onto another classifier may help connecting up discontinuities in membranes and thereby avoid undersegmentation [11]. Further, considerable post-processing may still be performed after applying the proposed pixel classification to delineate the cells. Future work would address these problems in membrane detection to improve the segmentation accuracy of the individual neurons.
Test Image 5
Test Image 4
Test Image 3
Test Image 2
5. REFERENCES
Fig. 6. Membrane detection results on the test images of the 5-fold cross-validation: original images (left), and detected membranes (right).
[1] J. C. Fiala and K. M. Harris, “Extending unbiased stereology of brain ultrastructure to three-dimensional volumes,” J. Am. Med. Inform. Assoc., vol. 8, no. 1, pp. 1–16, 2001. [2] J.G. White, E. Southgate, J.N. Thomson, and F.R.S Brenner, “The structure of the nervous system of the nematode caenorhabditis elegans,” Phil. Trans. Roy. Soc. London Ser. B Biol. Sci., vol. 314, pp. 1–340, 1986. [3] Kevin L. Briggman and Winfried Denk, “Towards neural circuit reconstruction with volume electron microscopy techniques,” Curr. Opin. Neurobiol., vol. 16, no. 5, pp. 562–570, Oct. 2006. [4] E. Jurrus, R.T. Whitaker, B. Jones, R. Marc, and T. Tasdizen, “An optimal-path approach for neural circuit reconstruction,” in Proc. IEEE Int. Sym. on Biomed. Imaging, 2008, pp. 1609– 1612. [5] V. Jain, J.F. Murray, F. Roth, S. Turaga, V. Zhigulin, K.L. Briggman, M.N. Helmstaedter, W. Denk, and H.S. Seung, “Supervised learning of image restoration with convolutional networks,” in Proc. Int. Conf. on Computer Vision (ICCV), Oct. 2007, pp. 1–8. [6] Yuriy Mishchenko, “Automation of 3D reconstruction of neural tissue from large volume of conventional serial section transmission electron micrographs,” J. Neurosci. Meth., Sept. 2008. [7] Rafael C. Gonzalez and Richard E. Woods, Digital image processing, Prentice-Hall, 2. ed. edition, 2002. [8] T. Tasdizen, R. Whitaker, R. Marc, and B. Jones, “Enhancement of cell boundaries in transmission electron microscopy images,” in Proc. Int. Conf. Image Processing (ICIP), 2005, pp. 642–645. [9] Y. Freund and R. E. Schapire, “A decision–theoretic generalization of on–line learning and an application to boosting,” in Proc. Euro. Conf. on Compu. Learning Theory (EuroCOLT), Barcelona, Spain, 1995, Also in: Journal of Computer and System Sciences 55:1, 1997, 119–139. [10] P. Viola and M. Jones, “Rapid object detection using a boosted cascade of simple features,” in Proc. Conf. on Computer Vision and Pattern Recognition (CVPR), 2001, vol. 1, pp. I–511–I– 518. [11] Zhuowen Tu, “Auto-context and its application to high-level vision tasks,” in Proc. Conf. on Computer Vision and Pattern Recognition (CVPR), jun 2008, pp. 1–8.