2011 International Conference on Electrical Engineering and Informatics 17-19 July 2011, Bandung, Indonesia
Automatic Classification of Tuberculosis Bacteria Using Neural Network Riries Rulaningtyas1, Andriyan B. Suksmono2, Tati L.R. Mengko3 School of Electrical Engineering and Informatics, Bandung Institute of Technology Jl. Ganesha, Bandung- Indonesia
[email protected] [email protected] [email protected] Abstract— Sputum smear microscopy analysis is the important thing for early diagnosis tuberculosis diseases. A lot of patients in tuberculosis medical center cause the doctors and the technicians have heavy duty. Our research result can be used to reduce technician involvement in screening for tuberculosis and would be useful in laboratories. This research is early step to find appropriate method for identifying tuberculosis bacteria. The analysis of sputum smear requires highly trained to avoid high errors. It needs an appropriate pattern recognition and classification of tuberculosis bacteria. Before classification, geometric features of tuberculosis cell image are found from its binary image. The geometric features of tuberculosis cell image consist of circularity, compactness, eccentricity, and tortuosity. These geometric features would become inputs to the neural network trained with backpropagation method. The 100 samples would be divided into 75 training samples and 25 testing samples. After getting optimum weights and architectures of neural network with 20 neurons hidden layer, 0.05 learning rate, and 0.9 momentum, this network is used for classifying tuberculosis bacteria into two categories : tuberculosis bacteria or not. Results presented for several image taken from different binary cell image show that neural network classifies the presence of tuberculosis bacteria image accurately with mean square error 0.000368, error classification zero in training and testing processes for the data that is used in this research. Keywords— Tuberculosis bacteria, microscopy, classification, geometric features, neural network.
I.
INTRODUCTION
Tuberculosis is an infectious illness that become health problem for develop country as Indonesia. This disease is the main cause high number of death. Indonesia is in the third place of the tuberculosis victim after India and China according to the World Health Organization (WHO) [1]. Tuberculosis is carried by tuberculosis bacteria named mycobacterium. Identification of tubercle bacilli are routinely done in sputum smears using microscope that is done by laboratory technician and the doctor analyze the disease. The sputum is taken from the patient in the morning which is the first sputum out. Before analyzing under microscope, the sputum specimen is colored using Ziehl – Nelsen stained. After this staining, tuberculosis bacteria give color in red because of acid resistance, and the background give color in
blue. The clinicians identify and count the amount of mycobacterium manually. The clinicians have a lot of tuberculosis patient every day. Each sputum specimen needs 15 minutes to be examined and scanned with 100 fields under microscope. This condition gives heavy workload for the clinicians that can reduce the accurateness of tuberculosis diagnose and cause high error rate detection. Automatic microscopy screening and calculating mycobacterium by the computer are very needed for helping the clinicians and support government‘s program for against tuberculosis disease. For analyzing mycobacterium image from the microscopy screening is still complex and wide open for research especially in computer science studying such as image processing, color segmentation and classification technique. This research is early step for finding appropriate classification method divide mycobacterium into two groups: tuberculosis bacteria or not. In fact other particles in sputum give red color too and sometime show the same morphology like mycobacterium. Geometry feature is used in this research as feature extraction. After mycobacterium feature is got, then neural network will classify bacteria using backpropagation method. The data set which is used in this research is already binary image that is taken from [5]. This binary image is processed with feature extraction step to find the mycobacterium shape feature and neural network was applied for classification. II. MATERIAL AND METHOD A.
Feature Extraction
Feature extraction is step for finding the morphology of mycobacterium by their shape. Geometry feature is used in this research which measure certain geometric attributes of the object, such as the following [3] : 1.
Perimeter
(1) Where t is necessarily the boundary parameter but not necessarily its length
2.
Area
(2) 3.
(8)
z j f _( z _ in j )
1
1
v01
Radii
voj
Rmin, Rmax are the minimum and maximum distances, respectively, to boundary from the center of mass (Fig.1). Sometimes the ratio Rmax/ Rmin is used as a measure of eccentricity or elongation of the object.
x1
v1j
xi
Rmin
xn
Rmax
vij
zj
y1
wj1 wjk
yk
wjm
vip vn1
w1k w1m
v1p vi1
w0k w11
z1
vop
v11
w01 w0m
wp1 vnj
wpk
zp
ym
wpm
vnp
Fig 2. Neural Network with One Hidden Layer [2]
Hidden unit deliver all signal input to the output layer. Fig 1. Maximum and Minimum Radii [3]
4.
p
y _ ink wok z j w jk
Circularity
j 1
(3) 5.
Output can obtain with activation fuction like this equation below,
yk f ( y _ ink )
Compactness
(4) 6.
Eccentricity [5]
(5) Tortuosity [5]
(6) B.
Back propagation method is used in this research for neural network training process. This method is commonly used for pattern recognition, image classification, and medical diagnose. The neural network operations consist of two steps : learning and testing. Training process can obtain optimum weight, so neural network can operate successfully and give output result suitable with target. From Fig.2 every input xi connects to next layer. Hidden unit (Zj, j = 1,…,p) will add up every input signal.
z _ in j voj xi vij i 1
Output signal can be obtained with activation function.
(11)
And then weight updating will be done, using equation below,
w jk k z j
(12)
wok k
(13)
Every hidden unit will add up k from up layer.
Neural Network
n
(10)
All neural network steps above is feed forward step where as feedback propagation is used for error output calculation. If output is still not the same with target, so network will evaluate the error output using this equation,
k (t k yk ) f ' ( y _ ink )
7.
(9)
(7)
_ in j
m
k w jk
(14)
k 1
Activation function is used to get j.
j _ in j f ' ( z _ in f )
(15)
Weight updating is obtained from equation below,
vij j xi
(16)
w jk k z j
(17)
New weight can be calculated.
w jk (new) w jk (old) w jk
(18)
vij (new) vij (old ) vij
(19)
Neural network process is ended with total error calculation.
E
1 t k yk 2 2 k
(20)
This research used log – sigmoid activation function .
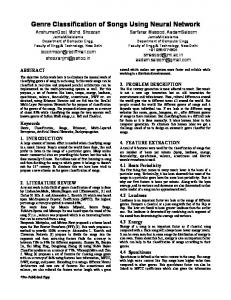
Fig 5. Gradient Error and Validation Checks
Fig 3. Log –Sigmoid Transfer Function [2]
III. RESULT This research used 100 samples tuberculosis binary image that taken from [5]. Training process used 75 samples and testing process used 25 samples. Neural Network (NN) architecture can be optimum with 20 neurons hidden layer, 0.05 learning rate, 0.9 momentum, and mean square error 0.000368. The result of training process can be seen in Fig 4.
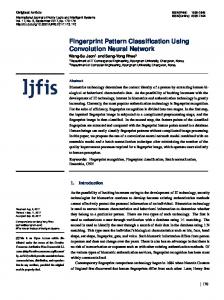
Fig 6. Plot Regression
Fig 4. NN Mean Square Error
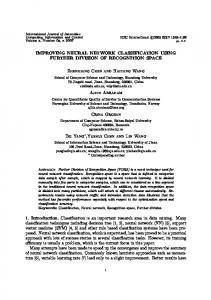
Fig 7. The Comparison of NN Output and Target
The gradient error could be received with value 0.0011967 at 5000 epoch and with validation fail zero at 5000 epoch. Linear regression analysis for neural network result is shown that NN output gives best result with coefficient correlation R = 0.99942 (almost 1). It means that output NN has closed target exactly.
for ‗‘not tuberculosis bacteria‖ image. By changing the threshold with value 0.6 neural network can classify tuberculosis bacteria and not tuberculosis bacteria exactly with zero error classification. IV. CONCLUSION Neural network has classified tuberculosis bacteria for the data that used in this research with good result. Neural network gives mean square error 0.000368 and zero error classification when some new data try to be classified by neural network. Optimum architecture neural network that is used in this research has single hidden layer, 20 node hidden layer, 0.05 learning rate, and 0.9 momentum rate. For the next research, it is suggested do some appropriate image processing technique, color segmentation, to extract bacterial image from the background before the classification. The bacterial image is taken from the real sputum image after screening by microscope. So it would be produce an innovative tool to count and analysis tuberculosis automatically by computer and can support government program to against tuberculosis disease.
Fig 8. The Application Form for Neural Network Classification Table1. Example of Neural Network Result
Image
Geometry Feature Circularity : 0.798063 Compactness : 15.7461 Eccentricity : 1.00187 Tortuosity : 0.295393 Circularity : 0.804989 Compactness : 15.6106 Eccentricity : 1.00014 Tortuosity : 0.294254 Circularity : 0.801031 Compactness : 15.6877 Eccentricity : 1.00237 Tortuosity : 0.29493 Circularity : 0.73098 Compactness : 17.1911 Eccentricity : 1.02675 Tortuosity : 0.303604 Circularity : 0.742655 Compactness : 16.9209 Eccentricity : 1.02937 Tortuosity : 0.305133
NN Classification Result TUBERCULOSIS BACTERIA TUBERCULOSIS BACTERIA TUBERCULOSIS BACTERIA NOT TUBERCULOSIS BACTERIA NOT TUBERCULOSIS BACTERIA
The comparison of the neural network output with the target can be seen in Fig 7 (NN output ‗o‘and target ‗*‘), target 1 for ‗Tuberculosis bacteria‘ detection and 0 for ‗Not tuberculosis bacteria‘ detection. Neural network resulted most of the data are suitable with the target, except for ‗not tuberculosis bacteria‘ data give the value < 0.6. This condition is caused by the data for ‗not tuberculosis bacteria‘ are limit (only 3). It makes NN can not go in ‗0‘ target for ‗not tuberculosis bacteria‘ data. This research used rectangular, triangle shape
ACKNOWLEDGMENT We gratefully acknowledge many helpful given from the paper by Manuel G. Foreroa, FilipSroubek b, Gabriel Cristo´bal, with the the title of paper ―Identification of tuberculosis bacteria based on shape and color‖, 2004 and the binary data bacterial cell image that we can get from their TBv1_toolbox for this neural network classification. REFERENCES [1] A. Adiputra, I.Andayana (2010), ―Pengembangan Sistem Pemeriksaan Dahak Secara Mikroskopis Untuk Diagnosis Penyakit TBC dengan Menggunakan Teknik Pengolah Citra Dijital”, laporan karya LCEN, Prodi Teknik Elektro, STEI, ITB. [2] Fauset, Laurene (1994) Fundamental of Neural Network. Prentice Hall, Inc, United Stated. [3] Jain, K. Anil, 1989, ―Fundamental of Digital Image Processing”, Prentice Hall [4] Jurnal Tuberkulosis Indonesia (2006, September). Penerbit Perkumpulan Pemberantasan Tuberkulosis Indonesia. Vol.3 No.2, ISSN 1829-5118. [5] M. Forero, F. Sroubek, and G. Cristbal, “Identification of tuberculosis bacteria based on shaped and color”, Real Time Imaging, vol.10. no.4, pp.251-162, august 2004. [6] R. Purbosari (2007), ―Hubungan Karakteristik Petugas Laboratorium TB Paru Puskesmas dengan Error Rate Hasil Pemeriksaan Dahak Tersangka TB Paru di Kabupaten Kudus Tahun 2006‖, skripsi, Jurusan Ilmu Kesehatan Masyarakat, Universitas Negeri Semarang. [7] V. Makkapati, R. Agrawal, R. Acharya (2009, August), ―Segmentation and Classification of Tuberculosis Bacilli from ZN-stained sputum /smear Images”, in IEEE Conference on Automation Science and Engineering, Bangalore – India.