1140
IEEE TRANSACTIONS ON MEDICAL IMAGING, VOL. 29, NO. 5, MAY 2010
Automatic Parameter Selection for Multimodal Image Registration Dieter A. Hahn*, Volker Daum, and Joachim Hornegger, Member, IEEE
Abstract—Over the past ten years similarity measures based on intensity distributions have become state-of-the-art in automatic multimodal image registration. An implementation for clinical usage has to support a plurality of images. However, a generally applicable parameter configuration for the number and sizes of histogram bins, optimal Parzen-window kernel widths or background thresholds cannot be found. This explains why various research groups present partly contradictory empirical proposals for these parameters. This paper proposes a set of data-driven estimation schemes for a parameter-free implementation that eliminates major caveats of heuristic trial and error. We present the following novel approaches: a new coincidence weighting scheme to reduce the influence of background noise on the similarity measure in combination with Max-Lloyd requantization, and a tradeoff for the automatic estimation of the number of histogram bins. These methods have been integrated into a state-of-the-art rigid registration that is based on normalized mutual information and applied to CT–MR, PET–MR, and MR–MR image pairs of the RIRE 2.0 database. We compare combinations of the proposed techniques to a standard implementation using default parameters, which can be found in the literature, and to a manual registration by a medical expert. Additionally, we analyze the effects of various histogram sizes, sampling rates, and error thresholds for the number of histogram bins. The comparison of the parameter selection techniques yields 25 approaches in total, with 114 registrations each. The number of bins has no significant influence on the proposed implementation that performs better than both the manual and the standard method in terms of acceptance rates and target registration error (TRE). The overall mean TRE is 2.34 mm compared to 2.54 mm for the manual registration and 6.48 mm for a standard implementation. Our results show a significant TRE reduction for distortion-corrected magnetic resonance images. Index Terms—Adaptive binning, automatic parameter estimation, coincidence weighting, normalized mutual information, Parzen-window estimation. Manuscript received September 11, 2009; revised January 11, 2010; accepted January 12, 2010. First published March 15, 2010; current version published April 30, 2010. This work was supported by the SAOT by the German National Science Foundation (DFG) in the framework of the excellence initiative. This work was also supported by the BMBF grant “Medical Imaging,” Network project: “Angiogenesis—Targeting for diagnosis and therapy,” 01EZ0808, Principal Investigator, Dr. O. Prante, University Erlangen, Germany. The images and the gold standard transformations were provided as part of the project, “Evaluation of Retrospective Image Registration,” National Institutes of Health, 1 R01 NS33926-02, Principal Investigator, J. M. Fitzpatrick, Vanderbilt University, Nashville TN. Asterisk indicates corresponding author. *D. A. Hahn is with the Friedrich-Alexander-University of Erlangen-Nuremberg (FAU), Pattern Recognition Lab, Department of Computer Science, 91058 Erlangen, Germany and also with the FAU, Nuclear Medicine, 91054 Erlangen, Germany (e-mail:
[email protected]). V. Daum is with the Friedrich-Alexander-University of Erlangen-Nuremberg (FAU), Pattern Recognition Lab, Department of Computer Science, 91058 Erlangen, Germany and also with the FAU, Nuclear Medicine, 91054 Erlangen, Germany. J. Hornegger is with the Friedrich-Alexander-University of Erlangen-Nuremberg (FAU), Pattern Recognition Lab, Department of Computer Science, 91058 Erlangen, Germany and also with the Erlangen Graduate School in Advanced Optical Technologies (SAOT), 91052 Erlangen, Germany (e-mail:
[email protected]). Digital Object Identifier 10.1109/TMI.2010.2041358
I. INTRODUCTION ULTIMODAL registration is central to numerous tasks in the field of medical image processing. Fully automatic approaches widely utilize similarity measures that are voxel intensity-based, like mutual information (MI), normalized mutual information (NMI), or correlation ratio [1]–[4]. The similarity criterion is embedded into an objective function and optimized numerically. We assume two inputs for the measure: the reference image and a template image, which is mapped into the space of the reference using image interpolation. The computation of the measure requires probability density functions (PDFs) that are associated with the reference, template and joint intensities. They are not known a priori and have to be estimated from intensity samples treated as independent and identically distributed (iid) random measures. Approaches to approximate these PDFs with parametric or semi-parametric models require PDF shape assumptions that become unreliable for different modalities, varying reconstruction settings and changing fields of view. Instead, nonparametric Parzen-window estimation is commonly applied to this task. It requires a kernel PDF of an appropriate width in order to work properly. The estimation process can be discretized efficiently using histograms specified by the number and the layout of the bins. An implementation of this PDF estimator requires settings for the kernel width and the number of histogram bins. These two parameters are not independent of each other. In addition, it may be necessary to work on only a subset of the entire overlap domain to meet runtime requirements placed on the registration application. Unfortunately, this sampling directly affects the kernel width and may also interfere with the number of histogram bins and their adaptive layout. To achieve a robust implementation, which works for a whole variety of input images, a suitable set of values for these parameters has to be determined. Although these problems are not new, the literature in this field presents partly contradictory, empirical results. There is ambiguity, for instance, about the optimal number of bins used for the discrete PDF representations, whether or not to determine the kernel size for the Parzen-windowing automatically or a separate treatment of the background of the image. Tailoring the parameters manually to the application problems is very cumbersome and time-consuming. The focus of this article lies on crucial numerical aspects of the joint PDF estimation. Instead of choosing the parameters by empirical adjustment, we extend ideas proposed by Viola [5] and Hermosillo et al. [6] for presenting an efficient kernel width estimation algorithm based on histogram binning. Adaptive kernel sizes can perform significantly better than constant-bandwidth kernels, but they usually have a rather high
M
0278-0062/$26.00 © 2010 IEEE
HAHN et al.: AUTOMATIC PARAMETER SELECTION FOR MULTIMODAL IMAGE REGISTRATION
computational complexity [7]. It is also known that isotropic binning may be outperformed by an adaptive clustering scheme for the representation of the histogram [8], [9]. From our experiments, we can confirm that an adaptive histogram layout improves the registration accuracy and robustness. We present a novel quasi-adaptive scheme for the kernel width selection. It is comprised of a combination of an isotropic estimator with an adaptive histogram binning layout. The resulting quantization error is used as a criterion to automatically select a suitable number of bins, based on a tradeoff between quantization error and runtime. As part of the results section, we evaluate the influence of this value on the accuracy of the registration result. The PDFs obtained from medical images are often degenerate, due to the large amount of background information. Thus, we also propose a novel technique for incorporating background information into the joint PDF to avoid negative effects on the binning layout or the kernel width estimation. The combination of the proposed data-driven methods leads to parameter values that are optimal with respect to the given input images and the number of samples. Although the sampling rate may be automatically selected as well, for example based on the runtime requirements of the application, we demonstrate its influence on the robustness, accuracy and the computational efficiency of the registration algorithm. From these results, an uncritical value can be chosen to speed up the registration without sacrificing too much accuracy. Altogether, the proposed methods yield an NMI implementation that does not require predetermined parameter settings for the density estimation. This paper is organized as follows. In Section II we summarize state-of-the-art methods for the NMI similarity measure. The contributions towards a parameter-free NMI are presented in Section III, which also contains an implementation roadmap. Comparisons between the proposed methods, along with experiments regarding histogram bins and the influence of the sampling rate, are provided in the results part Section IV. Our conclusions and a discussion are presented in Section V. II. STATE-OF-THE-ART METHODS A statistical image intensity-based similarity measure requires intensity distributions of the input images. In this section, we briefly summarize the key aspects of NMI and mention numerical details regarding the grid effect during the sampling. However, this section focuses on a convolution-based Parzen-window estimator and the data-driven estimation of its associated kernel width parameter. A. Normalized Mutual Information As initially introduced, the image intensity-based registration corrects for misalignments between an -dimensional reference image and a template image using a distance measure be, tween the two images. Given a spatial transform which is specified either by a parametric (e.g., rotation and translation parameters) or a nonparametric class of transformations (e.g., a deformation field in the nonrigid case), the term refers to the transformed template image at the spatial position (1)
1141
The general objective function used to search an optimal transform can be stated as (2) Nowadays, distance measures based on image intensity statistics are widely used for multimodal registration tasks. Based on Shannon’s theory [10], the information content within the images is measured using entropies, which require the marginal , and the joint PDF PDFs , (3) (4) (5) and , rewhere and represent the intensity values of spectively, and denotes the vector of these image intensities. These values are treated as random measures and are obtained by sampling the spatial overlap domain. Alternatives to density-based entropy estimations are direct entropic graph estimators as described, for instance, in the works of Neemuchwala et al. [11] or Sabuncu et al. [12]. Instead of calculating the entropy from estimated densities, the entropy is directly estimated from the sample values using graph-based methods, like the minimum spanning tree (MST). Although the authors claim that an MST method can produce accurate results at higher speeds, they expect the density estimation-based approaches to yield a wider capture range [12]. Results on registration accuracy also showed a slight advantage for the density-based measure. A comparison between the graph-based and our proposed method with optimal parameters is omitted, because of the higher accuracy and benefits in the robustness of density estimated NMI registrations reported in [12]. The most important example for the class of statistical similarity measures is certainly MI [1], [2], which is successfully applied in various applications and proposed by a large number of articles about multimodal registration. However, it depends on the overlap domain between the images. If the background is extended with respect to the foreground object, the probability for object elements in the image domain decreases. The joint entropy increases accordingly, but the peak of the MI at the position of correct alignment is flattened because no new object information is gained. The NMI can compensate this effect through dividing the marginal entropies by the joint entropy [3] (6) Note that is written as a distance measure, i.e., smaller values indicate a better result. B. Sampling Artifacts Medical images are usually represented by a regular grid with orientation and spacing information along the grid axes and intensity values at each knot. The true density functions
1142
IEEE TRANSACTIONS ON MEDICAL IMAGING, VOL. 29, NO. 5, MAY 2010
1
1
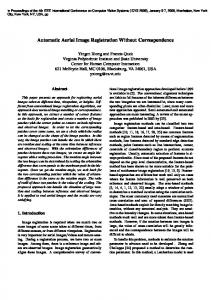
Fig. 1. Densely evaluated objective function values for translational parameter changes with a rate of 1/50 of the voxel spacings x in x- and y in y -direction around the ground truth optimum for a 3-D image. The distance measure is the negative MI using: (a) linear interpolation, (b) partial volume (PV) interpolation and (c) PV and jittering. The jittering was implemented using a uniformly distributed random offset added to the grid positions of the samples, which removed the grid effect.
can, therefore, be only estimated from these discrete observations. Interpolation has to be incorporated to allow for subpixel accuracy and target positions between the reference grid knots. Various reports about the accuracy and benefits of interpolation methods in image registration can be found in the literature. Most frequently, nearest neighbor, linear and partial volume methods are applied [13]. Higher order approaches are described by Thévenaz et al., who introduced cubic B-spline-based continuous models of the images for subpixel accurate optimization [14] and high quality multiresolution schemes [15]. Independent of the employed interpolation method, regular sampling of gridded data leads to serious numerical problems. Maes [13] and Pluim et al. [16] described effects on the MI measure for grid-aligning transformations. The authors showed that, due to these effects, local extrema are introduced into the objective function and lead to inaccurate registration results. They described these numerical problems as interpolation artifacts and proposed to resample the images in order to avoid grid aligning positions. Tsao [17] later picked up this problem and thoroughly evaluated not only several interpolation methods, but also jittering of the sampling coordinates and smoothing of the discrete histograms. The jittering adds normally distributed random offsets to the grid coordinates, making interpolation necessary within the reference image domain as well. The effects of jittering are shown on the densely sampled objective function for the case of the negative MI in Fig. 1. It is indeed the jittering, not the interpolation method, that has the biggest positive impact on the smoothness of the objective function. The random offsets do not necessarily have to be normally distributed around the grid knot coordinates, as proposed by Tsao. Instead, any random placement of the samples that avoids grid patterns can be used. Thévenaz et al. [18] identified the sampling itself as the main reason for the grid effects and proposed quasi-random sampling based on Halton sequences, which outperforms regular and random sampling. It can also be used to avoid problems due to varying amounts of overlap. Quasi-random Halton sequences feature low discrepancy regarding the resulting coordinates. Even if the number of samples is reduced for the high resolution steps in a multiresolution scheme, the additional variance in the objective function is smaller compared to true random sampling. Therefore, a nonstochastic optimizer may still be applied.
C. Parzen-Window Estimation Among nonparametric density estimation techniques, simple histogram methods, -nearest-neighbors ( -NN) and kernel-based approaches [9] are usually applied. A histogram is obtained by partitioning the domain of the random measures into a number of bins. The discrete PDF is then estimated by the fraction of samples that fall inside the bins. Although the number of bins is acting as a smoothing parameter, the histogram suffers from discontinuities at the bin boundaries. Finding a solution for the multimodal registration problem with at least first-order optimization techniques requires a differentiable similarity measure and, in turn, a differentiable PDF estimate. The estimate should be adequately smooth even if sparse statistical sampling is applied, which is not the case for histograms of larger numbers of bins. In addition, equidistantly-spaced histograms may not resemble the true PDF structure if the distribution has a high local variance. The -NN and kernel approaches are related to each other. In the -NN method one assumes that random measures fall inside some region of the domain. The volume of this region depends on the chosen value of and is determined by the data. The variable acts as a smoothing parameter that is independent of the position. However, the estimated density has discontinuities between data points and the integral over all -space diverges. Alternatively, one can keep the volume fixed and determine the number of random measures that fall into the region, leading to a kernel-based estimator. In the 1-D case random samples the Parzen-window with PDF estimator [19], [20] is (7) is the kernel PDF with a width of , the smoothing where parameter for this method. It can be shown for iid random samconverges asymptotically ples that the mean estimator for large values [5], [20] to the true PDF
(8)
HAHN et al.: AUTOMATIC PARAMETER SELECTION FOR MULTIMODAL IMAGE REGISTRATION
Here, denotes the expected value. The convolution in (8), denoted by the operator “ ” yields a blurred version of the true density. When the number of samples becomes infinitely large, converges into Dirac delta the kernel width reaches zero and peaks centered at the random measures. The true density is also has bounded frequency content and is recovered when a perfect low pass filter with an appropriate cutoff frequency. In practice, this means that although the number of samples is is a smooth finite, the PDF can be well approximated if a low pass filter [5]. function and There are nonparametric methods for PDF estimation particularly designed for multimodal image registration. Maes et al. [1] applied a discrete representation of the PDF with equidistantly-spaced histograms, whereas Wells et al. [2] suggested a continuous Parzen-window estimator to model the joint PDF. Although the latter approach does not require a binning scheme for the discrete PDF, it yields a relatively high computational for random samples and evaluacomplexity, i.e., tions of the estimator. Some effort has been made to reduce the computational load by transforming the problem into the fre. quency domain [21], which reduces the costs to A compromise is suggested by Thévenaz et al. [15] to combine the smoothing properties of third order B-spline kernels with an equidistant binning scheme. Recently, a nonparametric window (NPW) technique that does not require kernels for the density estimation has been proposed by Dowson et al. [22]. Their density estimator is based on an approach introduced by Kadir and Brady [23], which estimates the statistics from the samples by calculating the distribution of piecewise sections of a signal for a specific interpolation model. The smoothing is shifted from the probability into the signal domain. Downson et al. recommend their NPW due to its high accuracy and its robustness to the number of samples and histogram bins. The authors show promising results using their estimator plugged into an MI-based registration, however, the computational costs for their technique are up to 50 times of other state-of-the-art methods [22]. The density can also be estimated directly from the intensity iso-lines of the image, as described in the work of Rajwade et al. [24]. Similar to the method of Kadir and Brady, the approach does not require kernels. Instead, they quantize the image into a number of intensity levels and divide it into triangle patches located at each pixel. The intensity level curves are then approximated locally as straight lines. The joint density is estimated by calculating the contribution of the parallelogram of the iso-intensity lines clipped against the triangle patches. While their method is demonstrated to be applicable to magnetic resonance (MR) images, the authors did not examine its usability in multimodal registration between functional and morphological data, where it is unsure whether the iso-intensities in both images sufficiently relate to each other. In the following, we will concentrate on kernel-based density estimators that share the need for determining a value for the kernel width parameter. Some authors argue that it is rather simple to determine suitable values for the kernel size by empirical adjustment [2], [25]. Unfortunately, the kernel width is dependent on the image content, the discrete representation of the PDF and the number of random measures. For a fixed is sensitive to . If on finite number the estimator
1143
the one hand the chosen value for the kernel width is too large, the estimated density is over-smoothed and the nature of the underlying distribution is lost. On the other hand, too small values for insert artificial structure that is not present in the data. A general registration algorithm for clinical applications should handle various imaging modalities and different fields of view. Finding a good overall kernel width empirically for each modality combination is quite cumbersome and, as we will show in the results, leads to mis-registrations and less accurate results. Finding appropriate values for is further complicated by multilevel optimization techniques, which are employed to increase the attraction range of the desired optimum and to avoid being trapped in undesired local optima [14], [15]. The registration result for a level of the resolution pyramid is applied as a starting point for the next one, which increases the robustness of the entire registration. The ratio between the number of samples and the information contained in the images of the pyramid varies between the levels and, in turn, influences the kernel size parameter . The basis for the kernel width estimation in the discrete case is a maximum likelihood formulation. Unfortunately, the related objective function to determine an optimal value for the kernel width, with respect to the random samples, has a high computational complexity for the continuous Parzen-window estimator. Therefore, we will concentrate on a discretization and gradually present the steps towards a convolution-based Parzen-window estimator that makes use of discrete histograms. 1) Leave-One-Out Cross-Validation: In order to determine appropriate values for the kernel width , the observations themselves are used. In this data-driven approach care has to be taken to use disjoint sample sets for estimating the kernel width parameter and the objective test function. A common technique to resolve this problem of overfitting is cross-validation [26]. be For a leave-one-out cross-validation strategy, let the estimator after deleting the th sample (9) This estimator is independent of the value at . The probability may, therefore, be used as a measure of how well the estimator fits to with respect to the parameter . The resulting log likelihood objective function is expressed by [27] (10) An optimal value for the kernel width yields a maximum log likelihood (11) In practice, such a data-driven approach is well known to deliver reliable results. However, its efficiency drastically decreases with increasing sizes of the sample set. Typically, a leave-one-out cross-validation method to determine for a specific kernel size has a relatively high complexity of . In Section III, we propose an approximation
1144
IEEE TRANSACTIONS ON MEDICAL IMAGING, VOL. 29, NO. 5, MAY 2010
that leads to a binned version of the discrete PDF with a major reduction in complexity. 2) Efficient Discretization Scheme: The theory of Parzenwindow estimation is based on a continuous representation of the samples. The estimated PDF is optimal given the correct kernel width. As described above, this approach has a high computational complexity, which can be alleviated by the usage of histograms. The estimator then resembles the behavior of a mixture model with as many components as bins. The samples with bins, . Here, are stored in a discrete histogram denotes the fraction of samples that fall into the bin containing . The bin width for an equidistantly-spaced his, with togram is given by being the maximal and the minimal image intensity value, respectively. A discretization like this results in an error because the correct location of the random measures is no longer continuous, but rather a discrete bin index, and the estimated PDF be the value is assumed to be constant for the entire bin. Let discrete PDF estimator that differs from its continuous counterby a binning scheme based on a histogram. This piecepart wise constant PDF estimate is given by (12) where is the intensity value corresponding to the center of the th bin. The error between the two estimators is (13) with
Fig. 2. Illustration of the approximation error between the continuous PDF esand the discrete version p^ utilizing a binning scheme. The area timator p between the two graphs integrates to the error e for the j th bin. Graphically, this is denoted by the “+” and “ ” marked areas representing under- and overestimations, respectively.
0
kernel that fulfills this criterion, e.g., a cubic B-spline [29], [30]. The density estimation discussion is continued using the example of Gaussian kernels. Let be the 1-D Gaussian, which is a suitable low pass filter. The discrete Parzen-window estimator may then be written in terms of a convolution (15) In practice, the integral over the resulting discrete PDF has to be enforced to sum-up to one by appropriate normalization of its entries. This is due to numerical errors in the low pass filtering itself, discretization errors described above and particularly the fact that the Gaussian kernel does not fulfill the partition of unity constraint. The optimization problem (11) for the kernel width of the discrete estimator can be solved using an iterative, nonlinear optimization scheme, e.g., gradient ascent. The following formula specifies the gradient of the objective function, which may be used during the optimization
(14) An illustration of this error for the th bin is given in Fig. 2. If the approximation errors are neglected, equation (12) yields with , which allows for a substana complexity of tially faster computation of the discrete PDF estimate compared to a continuous approach. Of course, the number of bins and the binning scheme used for the histogram affects the accuracy of the estimation. is the A very common choice for the kernel PDF Gaussian. In practice, (12) can then be evaluated efficiently using recursive Gaussian filtering [28]. In cases where the partition of unity constraint [15] is required for the density estimation, the Gaussian may be replaced by another suitable
(16) The gradient has to vanish at the position of the optimal kernel width. Similar to the leave-one-out notation for the PDF estirefers to the histogram after delemator introduced above, tion of the th sample. Note that, from a numerical point of view, the domain of the intensity random variable is rather important. In order to achieve numerically stable results, the density transform theorem (DTT) [31] can be applied. According to this theorem the kernel width parameter for the discrete estimator is invariant to constant offsets applied to all random values but not
HAHN et al.: AUTOMATIC PARAMETER SELECTION FOR MULTIMODAL IMAGE REGISTRATION
to linear scalings. Let be a scaling factor for the intenan offset. An affine transform of the random sities and measure is given by (17) Applying the DTT to the Gaussian density function, the of the transformed samples can be expressed kernel PDF of (17) using the determinant of the Jacobian
1145
overshadows valuable image content. The ability to adapt the estimator to PDFs of varying smoothness is, therefore, an important feature for image registration. In the following, we use the term adaptive, anisotropic kernel width in the context of PDF estimation to express the property that the estimator is adapted to the structure of the underlying PDF using varying kernel sizes throughout the intensity ranges of the reference and the template image. For the joint density estimation, the kernel widths along each direction may be different, which is taken into account by anisotropic Gaussian kernels. , an adaptive Given kernel widths Parzen-window estimator reads
(18) (20) The kernel width
for the transformed domain is therefore (19)
From a numerical point, this relation is very convenient, as both the convolution (15) and the optimization of the kernel width parameter(11) can be performed in any affine-transformed domain. Thus, numerical problems can be effectively avoided by choosing an appropriate value range of the input samples. Accordingly, the sampled histograms may be directly convolved that is defined by with a Gaussian of adapted kernel size the affine transform into the histogram space. This transform is given by the bin indices and basically detached from the true intensity values—a technique that has been applied before by Hermosillo et al. [6]. III. EXTENDED METHODS TOWARDS A PARAMETER-FREE SIMILARITY MEASURE In this section, we present a novel quasi-adaptive scheme for the kernel width selection. It is comprised of a combination of an isotropic estimator with an adaptive histogram binning layout. We propose a new scheme to automatically select a suitable number of histogram bins. Subsequently, we introduce a novel technique for reducing the influence of background noise on the registration accuracy. We call it coincidence weighting in the following, according to the coincidence thresholding approach by Rohlfing et al. [32], [33]. The last part of this section contains details for an implementation of the methods. A. Adaptive, Anisotropic Kernel Widths In data-driven approaches for estimating the optimal kernel width, one can observe that the result is directly related to the uncertainty within the data, i.e., the number of samples. Due to the discrete nature of histograms, this uncertainty is reflected by a varying smoothness or degenerations. Estimators using constant kernel widths cannot distinguish between regions of high and low certainty within one histogram. Therefore, several authors in the field of pattern recognition suggest making this parameter spatially variant (see, for example, [7] and [34]). In many medical images the PDF of the intensity values is rather degenerate, as the background yields a strong, dominating peak in the PDF. The convolution with a low pass filter, as proposed in Section II-C-II, smears this peak over the neighboring bins, which
This estimator has recently been applied to human motion tracking for the modeling of position and orientation priors [34]. The adaptive estimator focuses better on the structure of the PDF by allowing smaller kernel sizes in areas with many training samples. Sparsely sampled areas of the PDF can still be approximated by larger kernel widths. The authors suggested a linear combination of covariance matrices and a scaled identity matrix to determine the parameters. Katkovnik et al. [7] computed confidence intervals of the random variable domain using a pilot density from an estimation with a constant kernel size and knowledge about the sample variance. The intersections of these intervals determine the adaptive kernel sizes. The method results in small widths in regions with high variance compared to areas with low variance, where larger values of the kernel size tend to decrease the mean squared error (MSE) between the estimate and the true PDF. The authors show that an estimator using adaptive kernel widths produces estimates with less variance in the MSE. B. Quasi-Adaptive Kernel Widths A disadvantage of adaptive, anisotropic kernel widths applied to image registration is the increased computational complexity for both the estimator and the formulation of its derivative. The efficient representation presented in Section II-C-II cannot be used in estimators with varying kernel sizes. Therefore, we propose a novel combination of an adaptive binning scheme with nonvarying kernel sizes for the PDF estimation. Instead of determining different kernel widths for an equidistantly-spaced histogram we propose to approximate the PDF using a histogram with varying bin sizes. The corresponding bin centroids define a quantization characteristic that is used to map the input intensities to requantized output values. These, in turn, can be represented with an equidistantly-spaced histogram. A density estimation on this requantized intensity space then does not have to account for different bin widths of the histogram and the proposed estimation scheme of Section II-C-II can again be applied. For its application in multimodal medical image registration, a statistical similarity measure has to rely on PDF estimates for the reference, template and joint intensities. A major drawback of estimating the discrete PDFs using equidistantly-spaced histograms is that intensities of a single tissue class may end up in different bins. Intensities measured in medical imaging
1146
IEEE TRANSACTIONS ON MEDICAL IMAGING, VOL. 29, NO. 5, MAY 2010
rarely follow a uniform distribution because the probabilities for all tissue classes would have to be equal, which is obviously not the case. Additionally, the dimensions of the organs inside the human body vary between individuals and the extent of the background region depends on the field-of-view. Adapting the bin sizes to the structure of the PDF, therefore, leads to a better representation with respect to a smaller quantization error. This approach has been proposed previously by Knops et al. [8] who applied intensity clustering. In this paper, we follow an alternative approach by Lloyd [35] and Max [36]. It is well known that the Lloyd-Max scheme yields a minimum-error quantization with a minimal noise power for a given number of bins and a set of bin center locations. The th bin is defined by an with the centroid . The noise power intensity interval of the requantization with respect to the signal PDF is
Fig. 3. Optimal kernel width parameter values for various numbers of samples and bins. (a) shows a slice of a CTA scan, (b) the corresponding optimal values for the kernel widths and their standard deviations due to random sampling with different number of samples (100, 1.000, and 10.000). The results are from 100 subsequent runs.
(21) According to Lloyd [35], a fixed point iteration scheme can be applied to optimize an adaptive layout of the bins that minimizes (21). The update steps during each iteration are
(22) If applied to the quantization of images, and can simply be chosen as the minimal and maximal image intensity values. Again, denotes the unknown true PDF. However, it can be approximated using an equidistantly-spaced histogram with an adequately small bin size and a large number of samples, preferably the entire image domain. In practice, medical images are usually stored with 16-bit accuracy or less, which allows for a bins. Note that this hisdiscrete representation of with togram and the fixed point iteration to minimize (21) have to be computed only once. C. Selection of the Number of Histogram Bins The histogram binning introduces quantization errors and, therefore, a loss of accuracy compared to the optimal density. Thus, the question becomes how many bins are a good compromise between efficiency and accuracy. An empirical result states that the optimal number of bins for a joint histogram used in NMI is 64 [8]. From a theoretical point of view, there is no explanation why 64 bins should be the best possible choice. As the final quantization error is also dependent, for instance, on the image content and the number of samples (see also Fig. 3), the general nature of this result is questionable. We, therefore, propose to estimate this parameter specifically corresponding to the input images. The quantization error criterion (13), which is used for the adaptive histogram binning, can also be utilized to determine a suitable number of bins. The continuous density estimate may, for this purpose, be approximated by a discrete histogram using the methods described above. It could be based on the full intenbins for a 16-bit quantized image, and all sity resolution, i.e.,
intensity values could be stored in the image grid. Such a huge number of bins is undesirable for a computationally efficient distance measure computation. We suggest that one defines a lower threshold for the discretization error between this high . The number of bins resolution and the discrete estimate can now be computed in an iterative procedure starting from an initial, minimal value, e.g., 16 bins. Equation (13) is solved for each discrete estimator built with this number of histogram bins. The iteration stops if falls below the defined threshold. As the integrals over the discrete density estimates are normalized to sum-up to one, the threshold is invariant to the image content and a universally reasonable value can be chosen. In the performed experiments we evaluate the sensitivity of this threshold on the registration accuracy and motivate that a value of 0.005 is a reasonable tradeoff between accuracy and runtime. Fig. 4 shows an example for the computation of the number of bins needed for the reference (CT) and template (PET) image. The quantization error drops heavily in the beginning of the iterative process and converges slowly towards zero as the number of bins increases. The adaptive binning proposed in Section III-B yields a smaller number of bins compared to equidistant bin spacings at the same error level. D. Coincidence Weighting Medical images are the result of discrete modality specific reconstruction methods based on physical measurements. In reality, these measurements are affected by detector noise and physical effects, for example beam hardening or scattering in CT. This noise is propagated through the reconstruction chain. Problems for image registration algorithms arise from structured noise that, unfortunately, is not only dependent on the reconstructed object itself, but also partly on the acquisition geometry. Although the noise may occur in all parts of an image, the major problems are primarily caused by artificial structures in the otherwise completely homogeneous background. The resulting transformation of the object becomes less accurate because the image registration algorithm tends to align the structured noise as well. In the case of medical images one typically assumes that intensities belonging to the background are at the lower end of the intensity range. Some authors have
HAHN et al.: AUTOMATIC PARAMETER SELECTION FOR MULTIMODAL IMAGE REGISTRATION
1147
Fig. 5. Intensity histograms for the images in Fig. 4(a) Plot a) shows the histogram for the CT with the computed threshold marked as vertical line at around 550 HU, plot b) is analogue for the PET.
0
Fig. 4. Automatic selection of the number of bins for a reference CT and template PET image (a) The quantization error curves for the CT (b) and the PET (c) have been computed with respect to a 16-bit high resolution density estimate. The plots show that the adaptive binning results in a smaller quantization error compared to uniform binning. A threshold level of 0.005 in this case yields values between 40 and 50 for the number of bins.
tried to eliminate this problem by using intensity thresholds within the joint histogram for a standard and coincidence thresholding [32], [33] or by masking the background region of the images [14]. The standard thresholding is similar to applying a mask to the background. Only those joint intensities are taken into account with both the reference and the template intensity value being above the corresponding background threshold. Therefore, only the overlap between the object parts is incorporated into the distance measure and combinations with the background regions are discarded. Thus, the robustness of the registration decreases, as large initial misalignments with a small object overlap cannot be recovered anymore. To account for these blind spots in the object-to-background relations, Rohlfing and Beier [33] have proposed a thresholding that only affects alignments between background parts of the images. Elements in the joint histogram are discarded if they correspond to intensities below both the reference and the template background thresholds. They called this technique coincidence thresholding and reported a reduction of the maximum registration error without loss of accuracy in cases with a minor noise level. For an implementation of this technique, the threshold values for the reference and the template background intensities have to be specified. The authors provided
experimentally determined values, however, these thresholds are very modality- and image-specific. Even if the intensities are related to a specific type of tissue (e.g., Hounsfield units in CT), the images may still differ in content and contrast. For example, cardiac CT images have a different intensity distribution than whole body scans. Depending on the field of view, the background may not even be included within the image. In the following, we propose a novel alternative to coincidence thresholding that does not require fixed threshold values. Thévenaz et al. [14] have applied a Max-Lloyd quantization algorithm to binarize a low pass-filtered version of the image. Together with the filtering, the algorithm computes the bin widths for a histogram of size two. The boundary between the two bins is assumed to separate intensities in the background from object values. Fig. 5 shows results of this algorithm for the example CT and PET images provided in Fig. 4(a). Thévenaz et al. used the resulting Max-Lloyd threshold to mask out intensity values in PET images. The determined threshold may also be used in the coincidence thresholding for other modalities. We further relax the strict thresholding constraint and propose a novel weighting-based method instead. In some acquisitions, the field of view is placed totally inside the boundaries of the patient’s body. If coincidence thresholding is applied to the joint density with the resulting Max-Lloyd threshold, the algorithm loses information about low-intensity structures between the objects. Therefore, we propose a tradeoff that does not clamp the coincidence region in the joint density to zero, but rather applies a weighting to the background-aligning probabilities. The probfor object and for background joint intensities abilities are calculated from the joint histogram
(23)
and denote the bin indices that contain the corHere, is the number of responding Max-Lloyd threshold values, the number of histogram bins for the reference image and histogram bins for the template image, respectively. Fig. 6 ilthat are lustrates the regions within the joint histogram used to calculate and . The following equation defines
1148
IEEE TRANSACTIONS ON MEDICAL IMAGING, VOL. 29, NO. 5, MAY 2010
Fig. 6. Illustration of the regions used for the calculation of the coincidence . The lower weights within an exemplary sketch of a joint histogram h left rectangular region corresponds to the background-to-background, the upper right region to object-to-object intensity mappings.
the value for the weighting factor to ensure that the background combinations do not contribute more to the joint density than object-to-object alignments. if otherwise.
(24)
The histogram weighting factor is then applied to all histogram to . entries with joint bin indices in the range of The histogram is normalized afterwards to sum-up to one, and the Parzen-window estimation (15) is performed. Fig. 7 provides examples for the joint density estimation of the images Fig. 4(a) at an initial starting position. Although the image pair shows a large amount of background information, the proposed weighting scheme leads to similar joint density estimates, even when the number of samples is strongly reduced. E. Implementation Roadmap We suggest incorporating the methods proposed in the previous sections at specific points of a registration algorithm. To minimize the computational overhead, some of the data-driven schemes can be performed only once in a preprocessing step before the actual multilevel registration is started. Primarily, the preprocessing is necessary in order to achieve a nonlinear requantization for the quasi-adaptive kernel estimation and to compute the background intensity thresholds for the coincidence weighting. The requantization can be efficiently combined with the creation of a multiresolution image pyramid, which is used in a multilevel nonlinear optimization afterwards. The main registration loop usually implements an iterative numerical scheme over several resolution levels to optimize the transformation between the images. We assume that the optimal kernel widths for the Parzen-window estimation can be used for an entire nonlinear optimization on a single level. Therefore, we introduce a preprocessing step also for a single level, where the data-driven kernel width computation is performed. During the nonlinear optimization the resulting kernel width values are used for the actual PDF estimation with the efficient discretization scheme for the Parzen-window technique. The remaining steps, to complete the registration algorithm, may vary between different applications and have been omitted for the sake of clarity and generality. The following listing summarizes the
required implementation steps and provides references to the corresponding sections in this paper. PREPROCESSING • Compute background intensity thresholds (Section III-D). • Compute the number of bins for the reference and the template image (Section III-C). • Calculate adaptive histograms (Section III-B). • Use adaptive binning information to determine nonlinear requantization characteristics (Section III-B). • Requantize image intensities and threshold values. • Create multiresolution image pyramids for multilevel optimization. MAIN REGISTRATION LOOP 1) Multilevel Preprocessing • Estimate optimal kernel width values for the current resolution of input images and number of samples (Section II-C-II). 2) Nonlinear Optimization until Convergence • Determine the joint histogram by sampling (Section II-B). • Apply coincidence weighting with the thresholds found in the preprocessing step (Section III-D). • Estimate the joint PDF using the efficient discretization scheme for the Parzen-window approach with the optimal kernel widths for this level (Section II-C-II). IV. RESULTS The described methods have been integrated into the NMI distance measure of a state-of-the-art rigid registration application. An evaluation based on the retrospective image registration evaluation project (RIRE version 2.0) database of brain images was performed. The database consists of CT, MR, and PET images. For some of the MR images, the database contains corrected images regarding scanner-dependent geometry distortions. These images are marked by the term rectified. The entire evaluation consists of CT–MR, PET–MR, as well as MR–MR image pairs, which yields 114 registrations in total. West et al. [37], [38] proposed a gold standard registration based on the detection of fiducial markers and evaluated the target registration error (TRE) for the transformations. The markers have been erased before the distribution of the data for a blind study. Using the RIRE data we compared the data-driven parameter selection methods to standard settings found in literature and also to a manual registration by a medical expert. To our knowledge, this is the first time that manual registration results are published for this database. The following parameter selection methods are compared. S K C R M
Standard parameter settings. Automatic Parzen-window kernel width selection. Coincidence weighting. Adaptive requantization with an automatic selection of the number of histogram bins. Manual registration by a medical expert.
HAHN et al.: AUTOMATIC PARAMETER SELECTION FOR MULTIMODAL IMAGE REGISTRATION
1149
Fig. 7. Joint density estimates for a PET-CT image pair after automatic selections of the number of bins, calculation of the adaptive bin layout, coincidence weighting and automatic calculation of the kernel width for the Parzen-window estimation. The number of samples for the estimation has been reduced to 10% (a), 1% (b), 0.1% (c), and to 0.01% (d) of the overlap domain in the highest resolution of the images.
Combinations between the techniques are also evaluated: for example the parameter-free NMI approach is achieved by the combination KCR. The effect of the number of bins used for the histograms, with respect to the registration accuracy, is analyzed as well. For the combinations without requantization (no R), the values 16, 64, and 256 denote the fixed setting for the histogram sizes. When R is enabled, the values are used as initializations in the minimization of the quantization error that yields the number of bins. For most of the medical images, the estimated number of bins is in the range of 30–60. The minimum requirements of 64 or 256 bins already fulfill the quantization error criterion in most of the cases and the resulting number of bins are then 64 or 256, respectively. For a comparison between the number of bins in the R combinations, we, therefore, suggest that one uses results from the entries for 16 and 256 bins presented in the following tables and plots. Quasi-random sampling was performed using Halton sequences with a length of 10% of the voxels contained within the overlap domain at the current iteration. A minimum number of 10 000 samples was used for lower resolutions. The jittering and partial volume interpolation was always performed, even when using S. These algorithm combinations not containing a specific identifier use the standard settings instead. For example, the CR method applies the default kernel widths instead of data-driven estimates. We used an Intel Core 2 Duo 2.6-GHz computer with 3 GB of main memory. The average registration time took approximately 20 s for a single CT-MR image pair and 10 s for MR-PET pairs, compared to several minutes needed with larger numbers of samples. A. Manual Registration The manual registration was performed with a rigid registration software which has been integrated into the commercial volume rendering application InSpace. It allows to interactively rotate and translate the template image within three adjustable multiplanar reconstruction views of the reference volume. The transformation parameters can be refined by mouse movements in a drag and drop fashion. The current registration accuracy can be directly assessed by a fusion visualization with color overlay or a linked side-by-side visualization with a duplicate cursor that points onto the corresponding position within the other image. The effect of the mouse movement onto the scale of the transformation parameter can be controlled by the zoom factor of the view. During the manual registration process, only the visual feedback was provided to the medical expert. Particularly, no additional information about the similarity measures for the
current transform parameters was accessible in order to achieve unbiased manual registration results. It took the medical expert an average (standard deviation) min for one registration and 6 h and 37 min time of 3.5 in total for all image pairs. These measurements do not include the loading of data or breaks during the registration process. B. Registration Approach and Standard Parameter Settings A state-of-the-art registration typically consists of a multiresolution representation of the input data and a numerical optimization scheme for the similarity measure values. The registration algorithm incorporates several multiresolution stages to increase the robustness. In our case, we applied a linear interpolation scheme to create multiresolution pyramids of both input images down to a minimal size of 32 along each direction. A single coarsening step reduces the number of voxels in each dimension to half the size. In cases of highly anisotropic voxel spacings, for example when the spacing between two slices is substantially bigger than the in-plane resolution, the coarsening is restricted to the dimensions of the smallest voxel spacing in favor of more isotropic image resolutions within the down-sampled images. As optimization scheme, a simple hill-climbing is used, which does not require the gradients of the similarity measure and solely relies on the numerical values at the parameter positions. Therefore, we can assure that no side effects from the similarity measure derivatives influence the comparison between the parameter selection methods. The same convergence criteria for the nonlinear optimization and the same pyramid coarsening schemes are used for the entire comparison between the parameter setting methods. The typical scheme for an implementation of a rigid registration is described, for instance, in [39]. The default method S consists of a Parzen-windowing with a fixed kernel size. The density estimation makes use of recursive Gaussian filtering of the discrete histogram with the value of set to the square of the bin width. Neither the proposed coincidence weighting nor the requantization of the intensities is applied. C. Sampling Percentage and Binning Threshold The proposed approach contains two parameters that are not estimated automatically, namely the sampling percentage and the quantization error, which is determined by the binning threshold. In order to examine the effect of those parameters on the registration algorithm, both the accuracy of the
1150
Fig. 8. Accuracy and runtime performance of the registration process evaluated on a subset of the RIRE database using different numbers of samples in the KCR 256 approach a) and varying values for the histogram binning tradeoff b). The accuracy is determined by the mean landmark TRE in mm, the runtime is provided in percentage of the largest mean registration time. Separate curves are shown for the accuracy values with respect to CT-MR and PET-MR (dashed lines), as well as the relative runtime of the registration process (solid lines).
resulting registration and its runtime have been compared to different settings. A subset of the RIRE database (Patient_001, Patient_005), consisting of 12 registrations for each setting between the rectified MR, CT and PET images, has been used in this experiment. Fig. 8(a) shows how the accuracy and the runtime of the registration process increases with a growing number of samples and smaller quantization errors for the histograms. For these results, a minimum number of 1000 samples has been used. In the first evaluation on the sampling percentage, the KCR approach has been applied with at least 256 histogram bins to exclude possible side effects from the histogram quantization. The accuracy is measured as the mean TRE between the fiducial markers. The runtime is provided in percentages of the largest mean registration time. A sampling rate of 10% has shown to be a good tradeoff between the resulting accuracy and the required processing time. In Fig. 8(b), the same data has been used to examine the effect of the binning threshold on the KCR method with at least 16 histogram bins. The smaller the threshold for the histogram quantization error, the larger the number of bins for the histogram becomes. In the CT registration cases the threshold values have no significant influence on the registration accuracy. For the PET cases, a larger number of histogram bins provides an additional improvement, however, the runtime drastically increases. Given these results, a sampling rate of 10% together with a binning threshold of 0.5% for the histogram quantization have been chosen for the following comparison between the parameter selection methods. In addition, the minimum number of samples has been increased to 10 000 in order to stabilize other methods within the lower resolutions of the images, as we encountered problems with the Parzen-window density estimation using the fixed standard thresholds in the coarse image registrations. Although we did not reduce the image sizes to less than 32 voxels along each dimension, some PET and MR images have less slices in their original resolution already and 10% of the number of initially overlapping voxels may be very low. The KCR approach is less variant to the minimal number of samples. For the other methods, however, it helps to eliminate misregistrations and to increase the accuracy. This is shown in Fig. 9, where we compare the effects of using a minimum number of samples of 1000
IEEE TRANSACTIONS ON MEDICAL IMAGING, VOL. 29, NO. 5, MAY 2010
Fig. 9. Accuracy with respect to varying sampling rates using the CR approach with 256 bins and 1000 a) and 10 000 b) minimum number of samples. Note that some values in the second plot coincide for small sampling rates, as the number of samples was raised to 10 000 in those cases.
and 10 000 for the CR approach with 256 bins. A comparison between the plots in Fig. 8(a) and Fig. 9(a) shows that the KCR approach is less variant to the number of samples and, therefore, more robust than the CR approach. D. Significance Tests A two-tailored paired -test at a 5% level of significance was used in analyzing the statistical differences between the various approaches on the basis of the median TRE values. Tables I and II present the TRE values for the CT-MR and PET-MR RIRE data registrations. The first tests comprise a statistical comparison between the proposed fully automatic NMI approach, i.e., the KCR method with an initialization of 16 bins, and an implementation using standard parameters from literature with 16, 64, and 256 histogram bins. KCR yields a significantly higher accuracy compared to S for 16, 64, and 256 bins. A comparison with the manual registration also results in a significantly higher accuracy in favor of KCR. The amount of improvement in accuracy slightly degrades when comparing KCR with 256 bins (cf. note above) and S (6.1% level of significance), and also KCR 256 with M (5.5% level of significance). We also examined whether a specific number of histogram bins performs better than another. There is indeed a significant difference within the results achieved by S 16 compared to S 64 and S 256, especially in the PET-MR registrations. Between S 64 and S 256, however, the observed improvement in performance was not so significant. In comparison, the proposed KCR approach performs consistently well, independent of the number of histogram bins. E. Target Registration Errors Figs. 10–12 show the mean TRE values of the various techniques along with the standard deviations for all the evaluated modality pairs. For the MP-Rage sequences all presented techniques achieve similar accuracies and a single, outstanding approach cannot be identified. The automatic CT-to-MP-Rage registrations show a slightly increased accuracy compared to the medical expert, which is the inverse of the MP-Rage-T2 pairs. In the plots of Fig. 10, which show the results of the CT-MR registrations, a clear improvement of most of the techniques is evident for the rectified MR sequences. In these cases, the automatic registration techniques yield accuracy improvements of
HAHN et al.: AUTOMATIC PARAMETER SELECTION FOR MULTIMODAL IMAGE REGISTRATION
1151
TABLE I MEDIAN TRE VALUES FOR CT AND MR MODALITY PAIRS. N DENOTES THE NUMBER OF PATIENTS AVAILABLE FOR EACH MODALITY COMBINATION
TABLE II MEDIAN TRE VALUES FOR PET AND MR MODALITY PAIRS. SEE NOTES IN TABLE I
up to one millimeter. The NMI implementation with all datadriven parameter selection methods enabled (KCR) shows consistently good performance for all image pairs. Similar statements can be made for the results of the PET-MR image pairs in Fig. 11. The coarse resolution of the PET data results in larger TRE values. The geometry correction of the MR images seems to play a more important role for PET combinations compared to CT. Again, the proposed KCR technique is performing very well for all PET-MR image pairs. The overall mean TRE measured for all image pairs (CT-MR, PET-MR and MR-MR) is 2.34 mm for the KCR technique with 16 bins, compared to 2.54 mm for the manual registration and 6.48 mm for a standard implementation with 64 bins. F. Acceptance Rates Besides the median and mean TRE analyses, we also investigated the overall landmark acceptance rates of the fully automatic KCR approach for the NMI starting with 16 number of
bins compared to the standard approach with 64 bins and the manual registration. The acceptance rate AR is determined, for a specific error threshold, as the ratio between the number of landmarks with a TRE smaller than the threshold and the total number of landmarks. Values for the acceptance rate are, there. The plots in Fig. 13 show the infore, in the range of crease in the acceptance rates as the error threshold increases. The visual appearance of the curves allows to directly compare the performance of the techniques for various modality pairs. One can think of the acceptance rate curves as a special form of receiver operating characteristics (ROC) curves, which are heavily used in pattern recognition [40]. Apart from small landmark error levels in the PET-MR rectified images, the KCR approach performs better than the standard. It yields a 90% acceptance rate for a TRE of 2.5 mm for distortion corrected CT-MR and 6 mm for PET-MR combinations. The manual registration by the medical expert achieves higher acceptance rates only for the PET combinations with the noncorrected MR images. In all
1152
IEEE TRANSACTIONS ON MEDICAL IMAGING, VOL. 29, NO. 5, MAY 2010
Fig. 10. Mean and standard deviation TRE values for CT to MR registrations: (a) CT-to-PD, (b) CT-to-T1, (c) CT-to-T2 and between the distortion corrected MR sequences (d) CT-to-PD rect., (e) CT-to-T1 rect. and (f) CT-to-T2 rect. For informations regarding the plot style see Fig. 12.
Fig. 11. Mean and standard deviation TRE values for PET to MR registrations: (a) PET-to-PD, (b) PET-to-T1, (c) PET-to-T2 and between the distortion corrected MR sequences (d) PET-to-PD rect., (e) PET-to-T1 rect. and f) PET-to-T2 rect.
other cases, the automatic registration using the KCR approach outperforms the manual registration as well. G. Influence of MR Distortion Correction West et al. [37] have statistically analyzed whether the geometry correction of the PD, T1 and T2 MR sequences yields a better registration accuracy. They found significant
differences between the registrations of MR images with and without corrections only for CT-T2 pairs in one out of eleven registration approaches. Other registrations showed minor improvements for CT-T2 and CT-T1 (10% level of significance). In contrast, statistical tests on our results confirm that the distortion correction yields a significant increase in performance. A comparison between the median TRE values with
HAHN et al.: AUTOMATIC PARAMETER SELECTION FOR MULTIMODAL IMAGE REGISTRATION
Fig. 12. Mean and standard deviation TRE values for MP-Rage MR sequence image pairs: (a) CT to MP-Rage and (b) MP-Rage to T2 combinations. The vertical bars depict the mean TRE for a specific parameter estimation technique together with the standard deviations (vertical lines). The solid horizontal line is the mean TRE of the medical expert, the horizontal gray band marks the corresponding standard deviation range. Results for 16, 64, and 256 bins for each parameter estimation technique are presented in order to examine the effects of the histogram size on the registration accuracy.
and without correction leads to 95% confidence intervals of for CT-MR images and for PET-MR pairs. V. DISCUSSION AND CONCLUSION In this paper, we have presented implementation aspects of estimating optimal parameter settings which are needed for multimodal similarity measures. The joint density between a reference and a template image is the basis for current state-of-the-art voxel based intensity similarity measures. The methods proposed in this article have been applied to NMI. For a discretization of the joint density, knowledge about the numerical details is crucial in order to avoid being trapped in a false optimum during the registration. We have briefly summarized problems that occur with regular sampling at grid positions and how jittering or quasi-random sequences provide acceptable solutions. The estimation of the discrete joint density can be tackled by various approaches. Some authors use histograms, others utilize continuous representations with Parzen-window estimations. We propose a combination of both and picked up an efficient discretization scheme proposed by Hermosillo et al. [6] based on recursive filtering of the histogram. In our method, the bin layout was nonlinearly adapted to minimize the quantization error for a specific number of bins, which is also determined automatically, and yields quasi-adaptive kernel widths for an adaption to the structure of the underlying PDF. The Max-Lloyd algorithm was used to calculate the bin sizes and also a binary threshold for the identification of background within the images. In medical images the percentage of background voxels may be very high, especially for molecular images. The otherwise homogeneously dark background region is overlaid with structured noise and other types of reconstruction artifacts that impair the registration accuracy. Ideally, the automatically calculated threshold separates the object from the background and can be applied for masking or coincidence thresholding. We loosened the rather strict application of a hard threshold and proposed the use of coincidence weighting instead. It ensures that background-to-background alignments are not dominating the entire similarity measure and that the robustness of the algorithm is not affected in a negative way.
1153
The presented data-driven parameter estimation techniques have been integrated into a state-of-the-art rigid registration application. We have carried out a comparison of automatic registrations using eight parameter estimation methods, each with three histogram size setups. In addition, a manual registration has been performed by a medical expert in this field of research. In order to get objective results, the RIRE database of human head images was used as input. The results for each method have been acquired from 114 individual registrations of CT-MR, PET-MR and also MR-MR image pairs. The gold standard was developed by West et al. and is based on the detection of implanted fiducial markers which had been removed prior to disclosure. The datasets were registered without knowledge about the position of the markers. Several aspects have been evaluated. The first investigation concerned the accuracy of the completely data-driven estimation of the parameter values for the joint density estimation, thus the entirely parameter-free NMI implementation. The proposed method (KCR with 16 initial bins) resulted in an overall mean TRE value of 2.34 mm compared to 2.54 mm for the manual registration and 6.48 mm for the best standard method with 64 bins. The parameter-free NMI implementation reached high accuracy values for all modality combinations. Registration accuracies of approximately 0.7 mm for CT with MR and 2.0 mm for PET with MR modality combinations have been achieved. According to West et al. [37] a retrospective registration technique with TRE values of 0.55 mm for CT- and 2.33 mm for PET-MR image pairs yields a similar accuracy as the gold standard. For the CT experiments, this accuracy was not exceeded in our results. However, the results for the PET registrations are very promising. In order to achieve further accuracy, it is possible to combine our proposed approach with the NPW method of Dowson et al. [22]. As the computational costs for the NPW density estimator are very high, it could be used only in just a few iterations in order to improve the registration result after our method has converged. As part of our study we investigated the impact on the registration of the number of histogram bins. Experiments of some authors lead to conclusions that a specific number of histogram bins is favorable. There is indeed a significant difference between 16 and 64 bins, when the kernel widths are set to fixed values, and between 256 bins if the background information dominates the joint histogram (K and KR). In the latter case, the automatic kernel width estimation is impaired by the strong background peak in the PDF. The median TRE values showed a significant difference for comparisons of S between 16 and 64 bin setups and a minor significance between 256 bins. The situation is different for the fully automatic approach, which includes the coincidence weighting. The results for KCR showed no statistically significant deviations between an automatically determined number of bins (usually 30–60) and a default value of 256. Our acceptance rate analysis suggested that the parameterfree NMI reaches higher landmark accuracies compared to an NMI implementation with standard parameter settings. It also achieved better rates than the medical expert, except for the noncorrected PET-MR registrations.
1154
IEEE TRANSACTIONS ON MEDICAL IMAGING, VOL. 29, NO. 5, MAY 2010
Fig. 13. Landmark acceptance rates for the modality combinations CT-MR (PD, T1, T2) (a), CT and geometric distortion corrected MR (b), PET-MR, (c) and PET with corrected MR d). The curves are plotted for the registration using the completely data-driven parameter selection for the NMI, a standard parameter set and the medical expert.
Finally, we compared registration results for MR images that were provided with and without a geometric distortion correction. A statistical analysis of our results showed that the correction leads to a significant improvement of the registration accuracy for all methods. The higher accuracy may be explained from the fact that the distortion correction helps limit non-stationary effects within the reconstructed MR images, i.e., intensity inhomogeneities also known as bias fields. A bias field on an MR image leads to a representation of the same tissue by different voxel intensity values. Therefore, this tissue contributes to several histogram bins—an effect that impairs the estimation of the intensity statistics and yields less accurate registration results. In addition to the preprocessing described in this article, a bias field correction may be performed on the MR images in general to achieve a higher registration accuracy for the MR cases. Our results show that the joint density estimation for multimodal similarity measures can be implemented with automatically determined, data-driven parameter selection. On the RIRE data the parameter-free NMI implementation performs very well for all modality combinations and independent of the number of bins, which is not the case for the NMI with standard settings. The geometric distortion correction yields additional registration accuracy and better results for the automatic compared to the manual image registration by the medical expert.
For PET and MR image pairs the accuracy approaches the gold standard. The various data-driven approaches for the parameter selection have been presented using the example of NMI integrated into a rigid registration algorithm. Of course, they can also be applied to nonrigid registrations (with some limitations on the sparse sampling for nonparametric nonrigid techniques). However, there is currently still a lack of a gold standard evaluation for nonrigid registrations. We would like to conclude our paper with a comment about the manual registration. The medical expert thoroughly investigated the registrations and allocated more time for specifying the transformations than would usually be available during the everyday clinical workflow. We, therefore, expect slightly worse manual registration results if performed under the usual time constraints and clinical stress. The methods for density estimation grew out of the research on image registration. The generality of the presented approaches, however, allows the application to a wide range of pattern recognition problems beyond image registration. ACKNOWLEDGMENT The authors would like to thank G. Wolz, MD for examining the manual registrations and HipGraphics for providing the volume rendering software InSpace.
HAHN et al.: AUTOMATIC PARAMETER SELECTION FOR MULTIMODAL IMAGE REGISTRATION
REFERENCES [1] F. Maes, A. Collignon, D. Vandermeulen, G. Marchal, and P. Suetens, “Multimodality image registration by maximization of mutual information,” IEEE Trans. Med. Imag., vol. 16, no. 2, pp. 187–198, Apr. 1997. [2] W. M. Wells, III, P. Viola, H. Atsumi, S. Nakajima, and R. Kikinis, “Multi-modal volume registration by maximization of mutual information,” Med. Image Anal., vol. 1, no. 1, pp. 35–51, Mar. 1996. [3] C. Studholme, D. L. G. Hill, and D. J. Hawkes, “An overlap invariant entropy measure of 3-D medical image alignment,” Pattern Recognit., vol. 32, no. 1, pp. 71–86, 1999. [4] A. Roche, G. Malandain, X. Pennec, and N. Ayache, “The correlation ratio as a new similarity measure for multimodal image registration,” in Proc. 1st Int. Conf. Proc. Med. Image Comput. Computer-Assisted Intervent. (MICCAI 1998),, Cambridge, MA, Oct. 1998, vol. 1496, pp. 1115–1124. [5] P. Viola, “Alignment by maximization of mutual information,” Ph.D. dissertation, Massachusetts Inst. Technol., Cambridge, 1995. [6] G. Hermosillo, C. C. d’Hôtel, and O. Faugeras, “Variational methods for multimodal image matching,” Int. J. Comput. Vis., vol. 50, no. 3, pp. 329–343, 2002. [7] V. Katkovnik and I. Shumulevich, “Kernel density estimation with adaptive varying window size,” Pattern Recognit. Lett., vol. 23, no. 14, pp. 1641–1648, Dec. 2002. [8] Z. F. Knops, J. B. A. Maintz, M. A. Viergever, and J. P. W. Pluim, “Normalized mutual information based registration using k -means clustering and shading correction,” Med. Image Anal., vol. 10, no. 3, pp. 432–439, Jun. 2006. [9] C. M. Bishop, Neural Networks for Pattern Recognition. Oxford, U.K.: Oxford Univ. Press, 1997. [10] C. E. Shannon, “A mathematical theory of communication (parts 1 and 2),” Bell Syst. Tech. J., vol. 27, pp. 379–473, 1948. [11] H. Neemuchwala, A. Hero, and P. Carson, “Image matching using alpha-entropy measures and entropic graphs,” Signal Process., vol. 85, no. 2, pp. 277–296, Feb. 2005. [12] M. R. Sabuncu and P. Ramadge, “Using spanning graphs for efficient image registration,” IEEE Trans. Image Process., vol. 17, no. 5, pp. 788–797, May 2008. [13] F. Maes, “Segmentation and registration of multimodal medical images: From theory, implementation and validation to a useful tool in clinical practice,” Ph.D. dissertation, Catholic Univ. Leuven, Leuven, Belgium, 1998. [14] P. Thévenaz, U. E. Ruttiman, and M. Unser, “A pyramid approach to subpixel registration based on intensity,” IEEE Trans. Image Process., vol. 7, no. 1, pp. 27–41, Jan. 1998. [15] P. Thévenaz and M. Unser, “Optimization of mutual information for multiresolution image registration,” IEEE Trans. Image Process., vol. 9, no. 12, pp. 2083–2099, Dec. 2000. [16] J. P. W. Pluim, J. B. A. Maintz, and M. A. Viergever, “Interpolation artefacts in mutual information-based image registration,” Comput. Vis. Image Understand., vol. 77, no. 9, pp. 211–232, Feb. 2000. [17] J. Tsao, “Interpolation artifacts in multimodality image registration based on maximization of mutual information,” IEEE Trans. Med. Imag., vol. 22, no. 7, pp. 854–864, Jul. 2003. [18] P. Thévenaz, M. Bierlaire, and M. Unser, “Halton sampling for image registration based on mutual information,” Sampling Theory Signal Image Process., vol. 7, no. 2, pp. 141–171, 2008. [19] E. Parzen, “On the estimation of probability density function and mode,” Ann. Math. Stat., vol. 33, no. 3, pp. 1065–1076, 1962. [20] R. O. Duda, P. E. Hart, and D. G. Stork, Pattern Classification. New York: Wiley, 2001. [21] S. Heldmann, O. Mahnke, D. Potts, J. Modersitzki, and B. Fischer, T. Tolxdorff, J. Braun, H. Hels, A. Horsch, and H. Meinzer, Eds., “Fast computation of mutual information in a variational image registration approach,” in Proceedings of the Bildverarbeitung für die Medizin, Berlin, Germany, 2004.
1155
[22] N. Dowson, T. Kadir, and R. Bowden, “Estimating the joint statistics of images using nonparametric windows with application to registration using mutual information,” IEEE Trans. Pattern Anal. Machine Intell, vol. 30, no. 10, pp. 1841–1857, Oct. 2008. [23] T. Kadir and M. Brady, W. Clocksin, A. Fitzgibbon, and P. Torr, Eds., “Estimating statistics in arbitrary regions of interest,” in Proc. 16th Br. Mach. Vis. Conf., Oxford, U.K., Sep. 2005, vol. 2, pp. 589–598. [24] A. Rajwade, A. Banerjee, and A. Rangarajan, “New method of probability density estimation with application to mutual information based image registration,” in Proc. IEEE Comput. Soc. Conf. Comput. Vis. Pattern Recognit. (CVPR 2006), New York, Jun. 2006, vol. 2, pp. 1769–1776. [25] R. Xu, Y. W. Chen, S. Y. Tang, S. Morikawa, and Y. Kurumi, “Parzenwindow based normalized mutual information for medical image registration,” IEICE Trans. Inf. Syst., vol. E91-D, no. 1, pp. 132–144, Jan. 2008. [26] T. Hastie, R. Tibshirani, and J. Friedman, The Elements of Statistical Learning. New York: Springer, 2001. [27] Y.-S. Chow, S. Geman, and L.-D. Wu, “Consistent cross-validated density estimation,” Ann. Statist., vol. 11, no. 1, pp. 25–38, Mar. 1983. [28] R. Deriche, “Fast algorithms for low-level vision,” IEEE Trans. Pattern Anal. Mach. Intell., vol. 12, no. 1, pp. 78–87, Jan. 1990. [29] M. Unser, A. Aldroubi, and M. Eden, “B-spline signal processing. I. Theory,” IEEE Trans. Signal Process., vol. 41, no. 2, pp. 821–833, Feb. 1993. [30] M. Unser, A. Aldroubi, and M. Eden, “B-spline signal processing. II. Efficient design and applications,” IEEE Trans. Signal Process., vol. 41, no. 2, pp. 834–848, Feb. 1993. [31] P. Brémaud, An Introduction to Probabilistic Modeling. New York: Springer, 1987, pp. 130–130. [32] T. Rohlfing, “Multimodale Datenfusion für die bildgesteuerte Neurochirurgie und Strahlentherapie,” Ph.D. dissertation, Tech. Univ. Berlin, Berlin, Germnay, 2000. [33] T. Rohlfing and J. Beier, D. J. Hawkes, D. L. G. Hill, and R. Gaston, Eds., “Improving reliability and performance of voxel-based registration by coincidence thresholding and volume clipping,” in Proc. Med. Image Anal. Understand., 1999, pp. 165–168. [34] T. Brox, B. Rosenhahn, D. Cremers, and H.-P Seidel, A. M. Elgammal, B. Rosenhahn, and R. Klette, Eds., “Nonparametric density estimation with adaptive, anisotropic kernels for human motion tracking,” in Workshop Human Motion, Rio de Janeiro, Brazil, Oct. 2007, vol. 4814, pp. 152–165. [35] S. P. Lloyd, “Least squares quantization in PCM,” IEEE Trans. Inf. Theory, vol. 28, no. 2, pp. 129–137, Mar. 1982. [36] J. Max, “Quantizing for minimal distortion,” IRE Trans. Inf. Theory, vol. 6, no. 1, pp. 7–12, Mar. 1960. [37] J. West, J. M. Fitzpatrick, M. Y. Wang, B. M. Dawant, C. R. Maurer, Jr, R. M. Kessler, R. J. Maciunas, C. Barillot, D. Lemoine, A. Collignon, F. Maes, P. Suetens, D. Vandermeulen, P. A. van de Elsen, S. Napel, T. S. Sumanaweera, B. Harkness, P. F. Hemler, D. L. G. Hill, D. J. Hawkes, C. Studholme, J. B. A. Maintz, M. A. Viergever, G. Malandain, X. Pennec, M. E. Noz, G. Q. Maguire, Jr, M. Pollack, C. A. Pelizzari, R. A. Robb, D. Hanson, and R. P. Woods, “Comparison and evaluation of retrospective intermodality brain image registration techniques,” J. Comput. Assist. Tomogr., vol. 21, no. 4, pp. 554–566, Jul. 1997. [38] J. M. Fitzpatrick, J. B. West, and C. R. Maurer, Jr., “Predicting error in rigid-body point-based registration,” IEEE Trans. Med. Imag., vol. 17, no. 5, pp. 694–702, Oct. 1998. [39] T. S. Yoo, Insight into Images: Principles and Practice for Segmentation, Registration, and Image Analysis, T. S. Yoo, Ed. Natick, MA: AK Peters, 2004. [40] J. P. Egan, Signal Detection Theory and ROC Analysis, ser. Series in Cognition and Perception. New York: Academic, 1975.