Automatic Filter Selection Using Image Quality Assessment Andrea Souza1, Mohamed Cheriet2,1, Satoshi Naoi3, Ching Y. Suen1 1. Centre for Pattern Recognition and Machine Intelligence Concordia University, Suite GM606, 1455 de Maisonneuve Blvd. West Montréal, Québec H3G 1M8, Canada 2. Laboratory for Imagery, Vision and Artificial Intelligence Laboratory École de Technologie Supérieure, University of Québec 1100, Notre-Dame West, Montréal, Quéebec H3C 1K3, Canada 3. Document Processing Lab Fujitsu Labs Ltd. Kawasaki 211-8588, Japan
[email protected] Abstract We present a method for automatically selecting the best filter to treat poor quality printed documents using image quality assessment. We introduce five quality measures to obtain information about the quality of the images, and morphological filters to improve their quality. A training set of 370 images was used to develop the system. Experimental results on the test set show a significant improvement in the recognition rate from 73.24% using no filter at all to 93.09% after applying a filter that was automatically selected.
1. Introduction Most of the time, poor quality printed documents yield low recognition rates when submitted to an OCR. One way of improving the quality of these documents is to apply a filter that can minimize the image degradations. However, it is difficult to find such a filter that can address different problems such as touching characters, broken characters, and salt-and-pepper noise. Here we present a method to automatically select the best filter suitable for an image depending on its degradation. Some works that present cleaning or restoration algorithms for degraded images focus only on single characters [9, 10]. Even in the cases that the algorithms are applied to a block of text, usually their databases do not have a large variety of problems. The work by Cannon et al [3] deals with different types of image degradations in the same database, such as
touching characters, broken characters and salt-andpepper noise. The solution found by them was to get information about the quality of the image prior to applying any restoration algorithm. An important characteristic of their database is that the images are typewritten, so the fonts have fixed width. The solution that we found for our database, which contains the same types of degradations, was also to obtain information on the type of problem prior to the selection of an appropriate filter. However, our database contains only printed documents with a variety of font sizes, types and styles. This represents a different challenge, and also the main difference from [3], because most printed characters do not have a fixed width, which makes the problem much more complicated. Other differences between the two works are the types of filter implemented, the number of images in the database, the method used to select the best filter for each image, as well as the way the quality measures are calculated. In section 2 we present the database used. In section 3 the filters used are presented. In section 4 we describe the six quality measures that were used to assess the image quality, as well as how they interact. Section 5 describes the automatic filter selection process. Experimental results appear in section 6, and section 7 presents our future work.
2. Database The database used consists of 736 documents divided in three sets. The images have different font sizes, types and styles, and almost all of them suffer from some type
Proceedings of the Seventh International Conference on Document Analysis and Recognition (ICDAR 2003) 0-7695-1960-1/03 $17.00 © 2003 IEEE
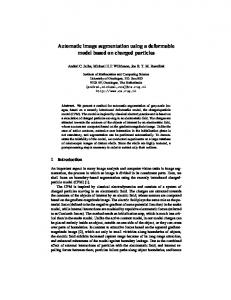
of degradation, such as broken characters, touching characters, salt-and-pepper noise, or the combination of two or more of these problems. All images contain only one printed text line in English. There are no graphics, tables, drawings or underlined text in any image. In order to develop the system, 370 images were used. Throughout the remaining of this report this set is called “training set”, although there is no actual learning by the system. These images were used to define the set of rules that make the automatic selection of the filter that should be applied to an image. The remaining images were divided in two groups: a validation test (183 images), which was used to verify the results obtained by the training set and make final adjustments to the set of rules, and a test set (183 images). Some examples of images of the database are:
Figure 1. Sample of images from our database
3. Filters The total number of filters implemented was 25. Almost all of them (24) use mathematical morphology operations, which “tend to simplify image data by preserving their essential shape characteristics and eliminating irrelevant noise” [5]. Four structuring elements were implemented: cross, square, horizontal line, and vertical line [6]. Each operation (erosion, dilation, opening, and closing) was implemented using each structuring element (cross, square, horizontal line, and vertical line). For the erosion and dilation operations, only one iteration was tested. For the opening and closing operations, one and two iterations were tested. In the end this gives a total of 24 options of filters: 4 erosions, 4 dilations, 8 openings, and 8 closings. The last filter consists of a technique called edge smoothing [5].
3.1. Reduction of filters Although 25 filters were implemented, this number had to be reduced in order to have an automatic selection. The 25 filters were applied to the 370 images of the training set. In order to select the best filter (or filters) for an image, a commercial OCR (identified in the remaining of this paper as OCR 1) was used. The output that had more characters correctly recognized was considered as the best filter for the image. The option of not applying any filter at all was also tested. So for each image there
were 26 outputs from the OCR 1 (25 filters plus no filter) to be analyzed, giving a total of 9620 output images. Based on the results of OCR 1, which were manually analyzed, 9 filters were eliminated: all openings and closings with 2 iterations (8 filters), and edge smoothing. The 2-iteration openings and closings were not appropriate for most of the images because they either added too many pixels (closings) or removed too many (openings). The number of images that had any of these filters as the best option was very small, in some cases even non-existent. The edge smoothing technique was not suitable because in many cases the “i” dots and/or punctuation marks were removed. The number of filters was then reduced to 16 plus the option of using no filter at all. The output images of the training set were submitted to two other commercial OCR’s (OCR 2 and OCR 3). The objective was to demonstrate that the improvement obtained in the recognition rate by applying the filters was not subject to only one OCR. The results were: Table 1. Comparison of OCR’s Recog. rate Recog. rate with best OCR without filter (manually chosen) filter OCR 1 65.05% 89.84% OCR 2 71.47% 86.65% OCR 3 64.22% 94.44% The best filter to each image was manually chosen based on the output that had more characters correctly recognized. OCR 3 was considered the best one because it obtained the highest recognition rate after applying the best filter for each image. Besides that, it allows the user to decide if options like “despeckle the image” should be used or not. This provides more control of the process at the same time that shows better the improvement that can be achieved when a better quality version of the image is tested. This may explain why this OCR had the lowest performance without using any filter at all, since it was not possible to “turn off” some preprocessing tasks of the other two OCR’s. OCR 3 was used for all the remaining tests. The number of filters was again reduced to the most efficient ones. The option of using no filter at all was eliminated because, although there were many images that had this option as one that provided the best result possible, this only happened probably because all OCR’s have some noise reduction algorithm already built in, and it was not possible to shut off completely this option in any case. Since almost all images have very poor quality, for this specific database it is better to always have some kind of filter applied. The remaining 16 filters were manually reduced to 4 also by checking the options that had more characters
Proceedings of the Seventh International Conference on Document Analysis and Recognition (ICDAR 2003) 0-7695-1960-1/03 $17.00 © 2003 IEEE
correctly recognized. The 4 filters selected as the most suitable ones for the training set were: • Erosion with structuring element Cross • Opening with structuring element Horizontal Line • Dilation with structuring element Cross • Closing with structuring element Vertical Line
wider. A connected component is wide enough to be considered as a touching character when its height-towidth ratio is less than 0.75. Small speckles and broken characters are avoided by disregarding connected components with fewer pixels than 3 * (font size). Big globs of background speckle are avoided by disregarding connected components taller than 2 * (font size) [3].
4. Quality measures
4.4. Small speckle factor
In order to assess the type of degradation of the image, five quality measures that correspond to the specific degradations found in the database were defined. Almost all of them are computed using two types of information: the connected components of the image, which are detected using region labeling [1], and the font size. This last one as well as the quality measures are described below. The skew angle is calculated using entropy [7], and the correction is made using the Hook transformation described in [8].
This factor measures the amount of small speckles in the image. Any connected component in which the number of pixels is less than or equal to 0.5 * (font size) is considered a small speckle.
4.1. Font size The font size refers to the height (or the distance in pixels) of characters that lie between the baseline and xheight, as illustrated in the figure below: x-height baseline Figure 2. Image with reference lines detected These reference lines are found using linear regression, based on [2]. The font size is given by: Font Size = Baseline – x-height For example, in the second text line in figure 1, the xheight is in row 18 and the baseline in row 34, therefore the font size is 16. Following our definition of font size, the latter has no unit, and it is image resolution independent.
4.5. Broken character factor This factor counts the number of connected components that are possible fragments of broken characters in the image. The calculation of this factor is based on what is defined in [4]. The bounding boxes are counted based on their height and width. This frequency distribution is plotted as a 3-D histogram (height, width and count of bounding boxes) divided in cells of one pixel by one pixel. The boxes that correspond to character fragments appear near the origin in a specific region called broken character zone. In order to eliminate the effects of font sizes, the bounding boxes must have height and width smaller than 75% of the average height and width, respectively. The formula to calculate the broken character factor (BCF) is: BCF = ∑ Frequency of Occupied Cells / Number of Cells
4.6. White speckle factor
The stroke thickness refers to the most frequent thickness measured horizontally. Each image row is scanned and searched for black pixels, either isolated or horizontally connected. A histogram is computed and its peak corresponds to the most frequent stroke thickness found in the image.
Images with characters that have thick strokes caused by distortions usually have touching characters. Another consequence of this situation is the reduction or even the elimination of the white loops in letters such as “b” or “e”. The white speckle factor detects these small white loops in the image [4]. The same algorithm used for detecting connected components is used but this time for white connected components smaller or equal to 3x3 pixels, which are considered as white speckles. The calculation of the white speckle factor is [4]: ∑ White Connected Components ≤ 3 x 3 WSF = ∑ White Connected Components
4.3. Touching character factor
4.7. Analysis of the quality measures
This factor verifies the number of touching characters in the image. A connected component that represents a single character is roughly square, while a connected component containing touching characters is usually
The detection of the stroke thickness is not precise in all cases but it is enough to identify the images that need a dilation/closing operation (the types of filter will be
4.2. Stroke thickness factor
Proceedings of the Seventh International Conference on Document Analysis and Recognition (ICDAR 2003) 0-7695-1960-1/03 $17.00 © 2003 IEEE
presented in the next section). Based on the training set, images with stroke thickness larger than 7 do not require a dilation/closing operation. Most of the images that need dilation/closing have the stroke thickness value between 1 and 5. Images that need an erosion/opening operation usually have the stroke thickness value starting at 4. Since there is an overlap between the two groups, which happens with all quality factors, it is necessary to analyze all quality factors as a whole to make a decision. The value of the touching character factor varies between 0 and 1 for most images that need a dilation/closing operation. Images that need an erosion/opening operation usually have this value larger than 0. Most of the time, images with reduced white loops have their white speckle factor larger than zero and need an erosion/opening operation, while images without this problem have this value equal to zero and need a dilation/closing operation. When the broken character factor is equal or less than 0.01, the image usually needs an erosion/opening operation. Otherwise, it needs a dilation/closing operation. The small speckle factor detects correctly the salt-andpepper noise but sometimes also mistakes small fragments of broken characters as noise. This happens especially when the image has thin strokes. The values vary a lot in both groups of cleaning operations, so this quality factor is usually analyzed with the others. A large value for the small speckle factor with a large value for stroke thickness or a large value for the touching character factor usually means that the image has a lot of salt-and-pepper noise with touching characters. However, a large value for the small speckle factor with a large value for broken character factor usually means that the image has many small fragments of broken characters.
5. Automatic filter selection The decision process for selecting the best filter for an image is divided in two stages. The first one is related to the type of operation that will be performed. There are two choices, either erosion/opening or dilation/closing. Erosion and opening are grouped together at this point because both refer to removing pixels from the image. Similarly, dilation and closing are grouped together because both refer to adding pixels to the image. Besides that, the values of the quality measures make a clear distinction between these two groups. The second stage is related to the structuring element that will be used. For the erosion/opening group, the choice is between cross and horizontal line. For the dilation/closing group, the options are cross and vertical line.
There are no specific values of each quality measure that lead to the selection of a particular filter for an image. It is rather the combination of these values that leads to a decision. A set of rules was defined based on the values observed in the training set, which were analyzed as described in section 4.7. A confidence level is computed for each option of filter and in the end the highest one is selected as the best filter for the image. One example of rule from each stage of decision is presented below: • If Broken Character Factor = 0 AND Small Speckle Factor ≥ 40 ==> Erosion/Opening • If White Speckle Factor > 0 AND Stroke Thickness Factor > 4 ==> Cross The table below shows the rate in which the two stages of the decision process were correctly made. Table 2. Automatic choice of filter Set First Stage Second Stage Training 97.57% (361/370) 90.58% (327/361) Validation 97.27% (178/183) 88.76% (158/178) Testing 96.17% (176/183) 85.80% (151/176) The calculation of the rates for the second stage was based on the results for the first one. For example, in the training set the right choice was made in 361 out of 370 cases for the first stage. So the statistics for the second stage are based on the total of 361 images, since it is not possible any more to achieve a correct choice in the second stage if the first one was wrong. Please note that the first stage of decision plays a critical role in improving the recognition rate, while the second stage indeed plays a complementary role. Hence even in one of the worst cases that the first stage of decision is always right and the second is always wrong, there will be an increase in the recognition rate from 66.86% to 71.65% in the training set. By choosing the correct option in the second stage, the recognition rate can increase up to 93.10% for the training set.
6. Experimental results The 4 filters selected were applied to the 370 images of the training set, and the output was submitted to OCR 3. The best filter among the 4 was manually chosen for each image based on the output with the highest number of characters correctly recognized. In some cases, more than one filter could provide the same best result. The original images were also submitted to the OCR in order to compare the recognition rates before and after applying the best filter. The original images of the training set were processed by the system to have the best filter for each of them automatically chosen and applied. The results could be verified because the best filter for each image was manually chosen previously.
Proceedings of the Seventh International Conference on Document Analysis and Recognition (ICDAR 2003) 0-7695-1960-1/03 $17.00 © 2003 IEEE
The same steps were repeated with a test set of 183 images to compare the results, which are presented in the table below: Table 3. Experimental results Set Trainin Validation Testing g Recognition rate 66.86% 71.73% 73.24% without filter Recognition rate 93.10% 95.45% 95.13% with best filter (manually chosen) Recognition rate 90.37% 93.97% 93.09% with best filter (automatically chosen) The testing set achieved better recognition rates even without any filter applied to the images probably because the images had better quality than the ones in the training set. Some examples of images after the automatic filter selection are presented below. These are the same images presented in section 2.
the system more generic, the use of a statistical classifier may be an option.
Acknowledgements This research was partially supported by the grants from the Natural Sciences and Engineering Research Council of Canada (NSERC), and Fonds pour la Formation de Chercheurs et l’Aide à la Recherche (FCAR).
8. References [1] L. O’Gorman, and R. Kasturi, Document Image Analysis, IEEE Computer Society Press, Los Alamitos, CA, 1995. [2] M. Schußler, and H. Niemann, “A HMM-based System for Recognition of Handwritten Address Words,” Proceedings of the Sixth International Workshop on Frontiers in Handwriting Recognition, Tajeon, Korea, 1998, pp. 505-514 [3] M. Cannon, J. Hochberg, and P. Kelly, “Quality Assessment and Restoration of Typewritten Document Images,” International Journal on Document Analysis and Recognition, Volume 2, Number 2, 1999, pp. 45-52. [4] L. Blando, J. Kanai, and T. Nartker “Prediction of OCR Accuracy Using Simple Image Features,” Proceedings of the Third International Conference on Document Analysis and Recognition, Montreal, Canada, 1995, pp. 319-322.
Figure 3. Output images after applying filter
7. Conclusion We have presented a method for automatic filter selection using image quality assessment. Quality measures are calculated and the results are used to select the best filter for an image. We consider the method successful given the significant increase in the recognition rate in the testing set from 73.24% using no filter at all to 93.09% after the automatic selection of a filter. Other types of filter that do not use mathematical morphology can also be used. The importance is that the filter is suitable for a considerable amount of documents in the database, and it is possible to make a correlation between the images that require a specific filter and the values of the quality measures. If other filters are used, the rules will probably need to be adjusted, we may not need the 2-stage decision process, and new quality measures may be necessary. Good quality images can be part of the database. This means that the option of not applying any filter at all to an image should be available in the system. In order to make
[5] X. Ye, M. Cheriet, and C. Y. Suen, “A Generic Method of Cleaning and Enhancing handwritten Data from Business Forms,” International Journal on Document Analysis and Recognition, Volume 4, Number 2, 2001, pp. 84-96. [6] J. Serra, Image Analysis and Mathematical Morphology, Academic Press Inc., London, 1982. [7] M. Cote’, E. Lecolinet, M. Cheriet, C. Suen, “Automatic Reading of Cursive Scripts Using a Reading Model and Perceptual Concepts – the PERCEPTO System,” International Journal on Document Analysis and Recognition, Volume 1, Number 1, 1998, pp. 3-17. [8] A. E. Yacoubi, “Modélisation Markovienne de l’Écriture Manuscrite Application à la Reconnaissance des Adresses Postales,” PhD Thesis, Université de Rennes 1, France, September 1996. [9] J. Wang, H. Yan, “Mending broken handwriting with a macrostructure analysis method to improve recognition,” Pattern Recognition Letters, 20, 1999, pp. 855-864. [10] H. Baird, “Document Image Quality: Making Fine Discriminations,” Proceedings of the Fifth International Conference on Document Analysis and Recognition, Bangalore, India, 1999, pp. 459-462.
Proceedings of the Seventh International Conference on Document Analysis and Recognition (ICDAR 2003) 0-7695-1960-1/03 $17.00 © 2003 IEEE