sensors Article
Automatic Recognition of Aggressive Behavior in Pigs Using a Kinect Depth Sensor Jonguk Lee 1 , Long Jin 2 , Daihee Park 1, * and Yongwha Chung 1, * 1 2
*
Department of Computer and Information Science, Korea University, Sejong Campus, Sejong City 30019, Korea;
[email protected] Ctrip Co., 99 Fu Quan Road, IT Security Center, Shanghai 200335, China;
[email protected] Correspondances:
[email protected] (D.P.);
[email protected] (Y.C.); Tel.: +82-44-860-1344 (D.P.); +82-44-860-1343 (Y.C.); Fax: +82-44-860-1584 (D.P. & Y.C.)
Academic Editor: Simon X. Yang Received: 3 March 2016; Accepted: 28 April 2016; Published: 2 May 2016
Abstract: Aggression among pigs adversely affects economic returns and animal welfare in intensive pigsties. In this study, we developed a non-invasive, inexpensive, automatic monitoring prototype system that uses a Kinect depth sensor to recognize aggressive behavior in a commercial pigpen. The method begins by extracting activity features from the Kinect depth information obtained in a pigsty. The detection and classification module, which employs two binary-classifier support vector machines in a hierarchical manner, detects aggressive activity, and classifies it into aggressive sub-types such as head-to-head (or body) knocking and chasing. Our experimental results showed that this method is effective for detecting aggressive pig behaviors in terms of both cost-effectiveness (using a low-cost Kinect depth sensor) and accuracy (detection and classification accuracies over 95.7% and 90.2%, respectively), either as a standalone solution or to complement existing methods. Keywords: pig aggression recognition; Kinect depth sensor; support vector machine
1. Introduction Recently, there has been increased interest in detecting abnormal behavior among domestic animals. If abnormal activity is not detected accurately and in a timely manner, efficient reproductive performance may be limited. Therefore, some recent studies have applied information technology to a livestock management system to minimize the damage resulting from such anomalies [1–6]. In this study, we aimed to detect and classify aggressive behaviors among weaning pigs in an intensive commercial pigsty. When unfamiliar pigs first meet after mixing group-housed weaning pigs, social conflict involving excessive aggression can occur. Aggression may be part of the behavioral repertoire that pigs exhibit to solve social conflicts [7]. When introduced to unfamiliar conspecifics, pigs naturally interact aggressively for social hierarchy status access to resources, such as space and feed [8–11]. These interactions may hamper animal welfare and increase wounding, leading to infections which may be lethal in extreme cases [12]. In addition, such aggression results in economic losses as weaker animals dominated by more aggressive ones may not have sufficient access to food so that their grow rates decrease and weight variability within the pen increases [13]. Therefore, aggression among pigs is one of the most important health, welfare, and economic problems in intensive farming [14,15]. Recently, two interesting analyses of pig aggression have been reported. First, Viazzi et al. [16] developed a method of detecting pigs’ aggressive behavior continuously and automatically through image processing, which enables obtaining information on the motions of pigs from historical images to find out aggressive interactions. Two features, the mean intensity of motion and the space occupation index, are derived from the segmented region of the motion history images and are used to classify Sensors 2016, 16, 631; doi:10.3390/s16050631
www.mdpi.com/journal/sensors
Sensors 2016, 16, 631
2 of 11
aggressive interactions during episodes through linear discriminant analysis. This method was the first attempt to use image analysis to automatically detect aggressive behaviors among pigs. Second, Oczak et al. [17] tested a method for automatically detecting aggressive behavior in pigs using an activity index and a multilayer feed-forward neural network. In that method, the activities of the animals are measured using videos, and software is used to calculate an activity index. Five features (average, maximum, minimum, summation, and variance of the activity index) are calculated based on the video recordings, and a multilayer feed-forward neural network is trained and validated to classify events involving high and medium aggression. Their results suggest that combining the activity index with a multilayer feed-forward neural network can be used to classify aggressive pig behavior. Recently, some advances have been made in pig monitoring using red, green, and blue (RGB)-based video data; however, to the best of our knowledge, no automated analysis of anomalies using a Kinect depth sensor has been reported yet. In contrast to current methods, in this study, we developed a non-invasive, inexpensive, and automatic monitoring prototype system that uses a Kinect depth sensor to monitor animal activity in a commercial pig facility. This proposed system notifies the farmer of an aggressive situation when it occurs in a hog barn. The method begins by extracting activity features from the Kinect depth information obtained in a pigsty. The detection and classification module, which employs two binary-classifier support vector machines (SVMs) in a hierarchical manner, detects aggressive behavior, and classifies it into aggressive sub-types such as head-to-head (or body) knocking and chasing. The results of our experiments indicate that the accuracy of aggression detection approached 95.7%, and the aggression classification approach (90.2% accuracy) was validated, where the recall and precision measures were satisfactory. As far as we know, this is the first report of aggression detection in weaning pigs by a pig monitoring system using Kinect depth data and SVMs. The results of this study suggest that Kinect depth sensors can be used to monitor the behavior of pigs. Furthermore, given the continuous and large stream of data coming from a pig monitoring system, the application of our data mining method is appropriate. The remainder of this paper is composed as follows. Section 2 describes the proposed aggressive behavior recognition system for pigs using a Kinect depth sensor, and it provides some information on the background concepts. Section 3 presents the simulation results and Section 4 presents the conclusions. 2. Aggressive Behavior Recognition of Pigs Using a Kinect Depth Sensor 2.1. The Proposed Pig Aggression Recognition System The proposed system for automatic detection and recognition of pig aggression consists of three modules (see Figure 1): the preprocessor, the feature generator, and the aggression detector and classifier. During preprocessing, the depth information related to pigs is obtained using a Kinect depth sensor. During the feature generation, five features (minimum, maximum, average, standard deviation of velocity, and distance between the pigs) are first extracted from the depth image. The third module uses the aggression detector and classifier to detect the aggressive behaviors, and then it classifies them hierarchically based on behavioral sub-types, such as head-to-head (or body) knocking and chasing. This study used two binary-classifier SVMs in a hierarchical manner [3,18–21]. Figure 2 shows the overall architecture of the SVM-based aggression detection and classification system.
Sensors2016, 2016,16, 16, 631 631 Sensors Sensors Sensors 2016, 2016, 16, 16, 631 631
of11 11 33of 33 of of 11 11
Figure 1. Overall structure of the pig aggression recognition system. Figure Figure 1. Overall structure of the pig aggression recognition system. system. Figure 1. 1. Overall Overall structure structure of of the the pig pig aggression aggression recognition recognition system.
Figure 2. Architecture for aggression detection and classification module based on hierarchical Figure 2. aggression detection and classification module based Figure 2. Architecture Architecture for aggression detection and classification module based on hierarchical hierarchical SVM. Figure 2. Architecture forfor aggression detection and classification module based on on hierarchical SVM. SVM. SVM.
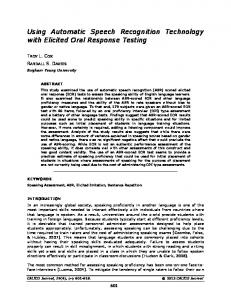
2.2. Binary Binary Classifier Classifier Support Support Vector VectorMachine Machine(SVM) (SVM) 2.2. 2.2. 2.2. Binary Binary Classifier Classifier Support Support Vector Vector Machine Machine (SVM) (SVM) The SVM SVM isis aasupervised supervised learning learning algorithm algorithm which which was was extensively extensively used used for for the theclassification classification The The SVM is a supervised learning algorithm which was extensively used for the classification The SVM is a supervised learning algorithm which was extensively used for the classification problem. The advantage of SVM is the calculation of the margin maximization that helps problem. The advantage of SVM is the calculation of the margin maximization that helps classification problem. The advantage of SVM is the calculation of the margin maximization that helps problem. The advantage of SVM is the calculation of the margin maximization that helps classification and performance and strong generalization capability withsamples limited data samples performance strong generalization capability with limited data [3,18–21]. The[3,18–21]. concept 𝑡 t x ` b capability classification performance and strong generalization data [3,18–21]. classification performance and strong generalization capability with limited data samples samples [3,18–21]. The concept linear SVM finds the optimal hyperplane +with 𝑏 =limited 0)two to separate twoaclasses with of linear SVMof finds the optimal hyperplane (w “ 0q(𝑤to 𝑥separate classes with maximum 𝑡𝑡 The concept of linear SVM finds the optimal hyperplane (𝑤 𝑥 + 𝑏 = 0) to separate two classes with The concept of linear SVM finds the optimal hyperplane (𝑤 𝑥 + 𝑏 = 0) to separate two classes with a maximum margin for linearly separable problem (see Figure 3). margin for linearly separable problem (see Figure 3). aa maximum maximum margin margin for for linearly linearly separable separable problem problem (see (see Figure Figure 3). 3).
Figure Figure3. 3. Geometric Geometric concept concept of of the the linear linearSVM SVMalgorithm. algorithm. Figure Figure 3. 3. Geometric Geometric concept concept of of the the linear linear SVM SVM algorithm. algorithm.
In the linearly separable case, let {𝑥1 , 𝑥2 , … , 𝑥𝑧 } be the training data set and let 𝑦𝑖 ∈ {−1, +1} be {𝑥 {𝑥11,, 𝑥𝑥22vector {−1, +1} In the linearly case, ,, … the In thelabel linearly separable case, let let … ,, 𝑥𝑥𝑧𝑧}}𝑥be the training training data data set set and let 𝑦𝑦𝑖𝑖 ∈ ∈ {−1, +1} be be the class of aseparable N-dimensional feature . The maximization of and the let margin corresponds 𝑖be the class the class label label of of aa N-dimensional N-dimensional feature feature vector vector 𝑥𝑥𝑖𝑖.. The The maximization maximization of of the the margin margin corresponds corresponds to [3,18–21]: to to [3,18–21]: [3,18–21]:
Sensors 2016, 16, 631
4 of 11
In the linearly separable case, let tx1 , x2 , . . . , xz u be the training data set and let yi P t´1, `1u be the class label of a N-dimensional feature vector xi . The maximization of the margin corresponds Sensors 2016, 16, 631 4 of 11 to [3,18–21]: ff « z ÿ 1 T min w w ` C 𝑧 ξi 21 (1) i“1 min ´ ¯ [ 𝑤 𝑇 𝑤 + 𝐶 ∑ 𝜉𝑖 ] 2 (1) T s.t. yi w xi ` b ě 1 ´ ξ i ; ξ i ě 𝑖=1 0; C ą 0; i “ 1, . . . , z 𝑠. 𝑡. 𝑦𝑖 (𝑤 𝑇 𝑥𝑖 + 𝑏) ≥ 1 − 𝜉𝑖 ; 𝜉𝑖 ≥ 0; 𝐶 > 0; 𝑖 = 1, … , 𝑧 Here, parameter C is a trade-off value between the training error term and the margin. Here, parameter 𝐶 is aξ trade-off value between the training error term and the margin. Additionally, slack variable i is a penalty for misclassification from the margin boundary or Additionally,within slack variable 𝜉𝑖 is a penalty forclasses misclassification from thelinearly, margin the boundary or classification the margin. When the two cannot be separated approach classification within the margin. When the two classes cannot be separated linearly, the approach described here for a linear SVM is needed to extend a nonlinear SVM. described hereof fornonlinear a linear SVM to extend a nonlinear The idea SVMisisneeded mapping the input trainingSVM. data into the higher-dimensional The idea of nonlinear SVM is mapping the input training (see data Figure into the4)higher-dimensional feature space with to the goal of obtaining linear separation [3,18–21]. In the feature space with to the goal of obtaining linear separation (see Figure 4) [3,18–21]. In thefunction general general mathematical formulation, K is defined as the dot product of the nonlinear kernel ` ˘ ` ˘ mathematical 𝐾 is defined as the dot product of the nonlinear kernel function T K xi , x j ” φ pxformulation, i q ¨ φ x j . In particular, a radial basis function (RBF) is commonly used for the 𝐾(𝑥𝑖 , 𝑥𝑗 ) ≡ 𝜙(𝑥𝑖 )𝑇 ∙ 𝜙(𝑥𝑗 ) . In particular, a radial basis function (RBF) is commonly used for the nonlinear kernel function as follows: nonlinear kernel function as follows: ´ ˇˇ ˇˇ2 ¯ ` ˘ K xi , x j “ exp ´γ ˇˇxi ´ x j ˇˇ2 , γ ą 0 (2) 𝐾(𝑥𝑖 , 𝑥𝑗 ) = 𝑒𝑥𝑝 (−𝛾‖𝑥𝑖 −𝑥𝑗 ‖ ) , 𝛾 > 0 (2) Here, Here, γ𝛾isisa astandard standarddeviation deviationparameter parameter[21]. [21].In Inour ourexperiments, experiments,we weemployed employed aa polynomial polynomial kernel function and an RBF kernel for detection and classification, respectively. kernel function and an RBF kernel for detection and classification, respectively.
Figure 4. 4. Geometric Geometric view view of of the the nonlinear nonlinear SVM. SVM. Figure
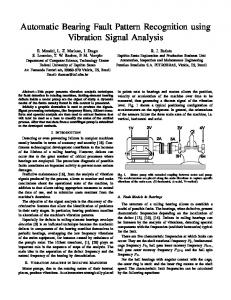
3. Results 3. Results 3.1. Data Data Collection Collection and and Data Data Sets Sets 3.1. The experiment experiment was was conducted conducted at at aa commercial commercial swine swine production The production farm farm located located in in Sejong Sejong City, City, Republic of Korea. In order to collect depth videos, the pen was monitored using a top-view Kinect Republic of Korea. In order to collect depth videos, the pen was monitored using a top-view Kinect camera (Version (Version 2, 2, Microsoft, Microsoft, USA). USA). Figure Figure 55 shows shows aa pig pig housing housing unit, unit, complete complete with with aa stationary stationary camera Kinect sensor. The pigsty contained 22 pigs ranging in weight from 25 kg to 30 kg. The resolution Kinect sensor. The pigsty contained 22 pigs ranging in weight from 25 kg to 30 kg. The resolution ofof a a captured image was 512 424pixels pixelswith withaaframe framerate rateof of30 30fps. fps. Based Based on on 50 50 hh of of recorded recorded Kinect Kinect captured image was 512 ˆ×424 depth videos, videos, 330 330 episodes episodes of of interactions interactions (115 (115 aggressive aggressive interactions: interactions: 61 head-to-head (or (or body) body) depth 61 head-to-head knocking, 54 chasing, and 215 normal interactions) were identified and labeled manually by a human knocking, 54 chasing, and 215 normal interactions) were identified and labeled manually by a human operator. In In this this study, an aggressive operator. study, an aggressive interaction interaction was wasdefined definedas asaaclose closephysical physicalcontact contactthat thatlasted lasted1 knocking or or chasing chasing 1s sininwhich whichatatleast leastone oneof ofthe theinteracting interactingpigs pigs exhibited exhibited head-to-head head-to-head (or (or body) body) knocking behaviors. Figure 6 shows sample images of various behaviors, and the descriptions of these behaviors. Figure 6 shows sample images of various behaviors, and the descriptions of these behaviors behaviors are summarized are summarized in Table 1. in Table 1.
Sensors 2016, 16, 631 Sensors 2016, 2016,16, 16,631 631 Sensors
5 of 11 of 11 11 55 of
Figure 5. 5. Pig Pig housing housing unit unit installed installed with with aa stationary stationary Kinect Kinect sensor. sensor. Figure
Figure 6. Sample Sample images showing showing behaviors among among the pigs: pigs: (a) Normal: Normal: walking alone; alone; (b) Normal: Normal: Figure Figure 6. 6. Sample images images showing behaviors behaviors among the the pigs: (a) (a) Normal: walking walking alone;(b) (b) Normal: walking together; (c) (c) Aggression: head-to-head head-to-head knocking; and and (d) Aggression: Aggression: chasing. chasing. walking walking together; together; (c) Aggression: Aggression: head-to-head knocking; knocking; and (d) (d) Aggression: chasing.
Aggressive Type Type Aggressive Aggressive Type Head knocking knocking Head Head knocking Chasing Chasing Chasing
Table 1. Labeled Labeled pig behaviors behaviors [17]. Table Table 1. 1. Labeled pig pig behaviors [17]. [17]. Behavior Label Description Behavior Label Description Head-to-head knocking Hitting the snout against the head head of of the the receiving receiving pig pig Behavior Label Description Head-to-head knocking Hitting the snout against the Head-to-body knocking Hitting the snout against the body of the receiving pig Head-to-head knocking Hitting Hitting the snout against the head the receivingpig pig Head-to-body knocking the snout against the body ofof the receiving Following another pig rapidly, usually with biting or Following another pig rapidly, usually with biting or Chasing knocking Head-to-body Hitting the snout against the body of the receiving pig Chasing attempted biting biting attempted Following another pig rapidly, usually with biting or Chasing attempted biting
Duringthe the activity activityfeature featureextraction extractionprocess, process,the themoving movingpigs pigswere werelabeled labeledas asregions regionsof ofinterest interest During (ROIs) and the barycentric coordinates of the ROIs were obtained. In general, barycentric coordinates (ROIs) and the barycentric coordinates of the ROIs were obtained. In general, barycentric coordinates During the activity feature process, thefor moving pigspig were labeled as regions interest follow piece-wise straight lines,extraction and two two coordinates coordinates for the same same pig in consecutive consecutive framesofare are very follow piece-wise straight lines, and the in frames very (ROIs) the barycentric ofmeasure the ROIsthe were obtained. In barycentric close to toand each other. Thus, ititcoordinates is possible possible to to measure the similarity of the thegeneral, two coordinates coordinates bycoordinates calculating close each other. Thus, is similarity of two by calculating follow piece-wise straight lines, and two coordinates for the same pig in consecutive frames very the Euclidean distance between them and determining whether they are the same based onare given the Euclidean distance between them and determining whether they are the same based on aa given close to each other. Thus, it is possible to measure the similarity of the two coordinates by calculating threshold. Consequently, Consequently, the the moving moving pigs pigs can can be be identified identified and and tracked tracked successfully successfully in in consecutive consecutive threshold. the Euclidean distance between them and determining whether they are the same based a given frames [22]. We used an index algorithm to track the pigs in the pigsty [22]. In this study, we extracted frames [22]. We used an index algorithm to track the pigs in the pigsty [22]. In this study, weon extracted threshold. Consequently, the moving pigs can be identified and tracked successfully in consecutive five features (minimum, maximum, average, standard deviation of velocity, and distance between five features (minimum, maximum, average, standard deviation of velocity, and distance between frames [22]. We used anStudio index algorithm to track the pigs in the pigsty [22]. In this we extracted the pigs) pigs) using Visual Studio 2012 (Microsoft, (Microsoft, Redmond, WA, USA) based onstudy, the depth depth videos. the using Visual 2012 Redmond, WA, USA) based on the videos. five features (minimum, maximum, average, standard deviation of velocity, and distance between the Figure 7 shows a schematic drawing of the minimum circumscribed rectangle. In the pig activity Figure 7 shows a schematic drawing of the minimum circumscribed rectangle. In the pig activity pigs) using Visual Studio 2012 (Microsoft, Redmond, WA, USA) based on the depth videos. Figure monitoring system using a Kinect depth sensor, the pigs could be identified as either standing or7 monitoring system using a Kinect depth sensor, the pigs could be identified as either standing or shows a schematic drawing of the minimum rectangle. In the pig activity monitoring lying based based on the the Kinect Kinect depth criterion (seecircumscribed Figure 8). 8). lying on depth criterion (see Figure system using a Kinect depth sensor, the pigs could be identified as either standing or lying based on the Kinect depth criterion (see Figure 8).
631 Sensors 2016, 16, 631 Sensors 2016, 16, 631
6 of 11 6 of 11
Figure Figure 7. 7. Minimum Minimum circumscribed circumscribed rectangle. rectangle. Figure 7. Minimum circumscribed rectangle.
Figure 8. based on on thethe Kinect depth criterion: (a) All by a Kinect Figure 8. Example Exampleofofpig pigdetection detection based Kinect depth criterion: (a)pigs All detected pigs detected by a Figure 8. Example of pig detection based on the Kinect depth criterion: (a) All pigs detected by a sensor (the star(the symbols (b) Only standing pigsstanding detected pigs by a Kinect sensor. Kinect sensor star indicate symbolsstanding indicatepigs); standing pigs); (b) Only detected by a Kinect sensor (the star symbols indicate standing pigs); (b) Only standing pigs detected by a Kinect sensor. Kinect sensor.
3.2. The Pig Aggression Detection and Classification Results 3.2. Pig Aggression Detection and Classification Results 3.2. The The Aggression Detectionand andclassification Classificationmodule Results shown in Figure 1 represents the aggression ThePig aggression detection detector and classifier used to detect aggressive behaviors, and it classifies them hierarchically based The The aggression aggression detection detection and and classification classification module module shown shown in in Figure Figure 11 represents represents the the aggression aggression on aggression sub-types, such as theaggressive aggressivebehaviors, behaviorsand associated with head-to-head (or based body) detector and classifier used to detect it classifies them hierarchically detector and classifier used to detect aggressive behaviors, and it classifies them hierarchically based ® knocking and chasing. A personal computer (PC)behaviors (Intel i7-3770K CPU, 8 GB memory) was used to on on aggression aggression sub-types, sub-types, such such as as the the aggressive aggressive behaviors associated associated with with head-to-head head-to-head (or (or body) body) implementand thechasing. proposedAsystem, and a Weka 3.6 [23] was®® used. In addition, a 10-fold cross-validation knocking personal computer (PC) (Intel i7-3770K CPU, 8 GB memory) was used knocking and chasing. A personal computer (PC) (Intel i7-3770K CPU, 8 GB memory) was used to to was performed in all of the experiments. implement the proposed system, and a Weka 3.6 [23] was used. In addition, a 10-fold cross-validation implement the proposed system, and a Weka 3.6 [23] was used. In addition, a 10-fold cross-validation First, we distinguished between aggressive and normal behaviors through an identification test was was performed performed in in all all of of the the experiments. experiments. First, we distinguished between and an conducted using the proposed method.aggressive The performance of thebehaviors proposedthrough system was evaluated viatest the First, we distinguished between aggressive and normal normal behaviors through an identification identification test conducted using the proposed method. The performance of the proposed system was evaluated via aggression detection rate (ADR), the false positive rate (FPR), and the false negative rate (FNR) [24,25]. conducted using the proposed method. The performance of the proposed system was evaluated via the detection rate the positive rate and false negative rate True positive (TP) is the aggressive behavior correctly identified as aggression; (FP) is the aggression aggression detection rate (ADR), (ADR), the false false positive rate (FPR), (FPR), and the the false falsepositive negative rate (FNR) [24,25]. True positive (TP) is the aggressive behavior correctly identified as aggression; false the normal behavior incorrectly identified as aggression; true negative (TN) is the normal behavior (FNR) [24,25]. True positive (TP) is the aggressive behavior correctly identified as aggression; false positive is normal behavior incorrectly identified as true is correctly identified normal; and false negative (FN) is the aggressive behavior incorrectly identified positive (FP) (FP) is the theas normal behavior incorrectly identified as aggression; aggression; true negative negative (TN) (TN) is the the normal behavior correctly identified as normal; and false negative (FN) is the aggressive behavior as normal. These were determined as follows: normal behavior correctly identified as normal; and false negative (FN) is the aggressive behavior incorrectly as incorrectly identified identified as as normal. normal. These These were were determined determined as follows: follows: TP ADR “𝑇𝑃 ˆ 100 (3) TP ` FN 𝑇𝑃 × 100 (3) 𝐴𝐷𝑅 = (3) 𝐴𝐷𝑅 = 𝑇𝑃 + 𝐹𝑁 × 100 𝑇𝑃 + 𝐹𝑁 FP FPR “𝐹𝑃 ˆ 100 (4) 𝐹𝑃 (4) FP ` TN 𝐹𝑃𝑅 (4) 𝐹𝑃𝑅 = = 𝐹𝑃 + 𝑇𝑁 × × 100 100 𝐹𝑃 + 𝑇𝑁 FN FNR “ 𝐹𝑁 ˆ 100 (5) 𝐹𝑁 (5) 𝐹𝑁𝑅 100 `× (5) 𝐹𝑁𝑅 = = 𝑇𝑃 +TP ×FN 100 𝐹𝑁 𝑇𝑃 + 𝐹𝑁 The detection results obtained for aggressive The detection results obtained for aggressive behavior behavior are are summarized summarized in in Table Table 2. 2. The The results results of of our experiment indicated that the detection accuracy of the proposed system was 95.7%, where our experiment indicated that the detection accuracy of the proposed system was 95.7%, where FPR FPR
Sensors 2016, 16, 631
7 of 11
The detection results obtained for aggressive behavior are summarized in Table 2. The results of our experiment indicated that the detection accuracy of the proposed system was 95.7%, where FPR and FNR were 4.2% and 4.3%, respectively. As shown in Figure 2, the SVM1 detector was used in this experiment. We employed a polynomial kernel function, and the trade-off constant C was set to 4.5. Table 3 provides a summary of the quantitative/qualitative analysis with existing RGB-based methodologies. Note that Jin [26] proposed a method of detecting aggressive behavior in pigs using two features (mean circumscribed rectangle and velocity) extracted from the RGB-based video recordings and a SVM. In previous studies, no attempts were made to detect and classify aggressive behaviors using a Kinect depth map; thus, a performance comparison could not be conducted. Table 2. Aggressive behavior detection performance of the proposed system. Aggression Detector
ADR
FPR
FNR
SVM 1
95.7%
4.2%
4.3%
ADR(aggression detection rate); FPR(false positive rate); FNR(false negative rate).
Table 3. Summary of the quantitative/qualitative analysis for the aggressive behavior detection. Parameter
Viazzi et al. [16]
Jin [26]
Proposed Method
Normal data size Aggressive data size Used data Camera type Camera resolution Tracking
150 150 Private Color 1032 ˆ 778 N/A
60 60 Private Color 1280 ˆ 960 Yes
Features
Mean activity and occupation index
Mean circumscribed rectangle and velocity
Feature vector dimension Method ADR FPR FNR
2 Linear discriminant analysis 88.7% 10.7% 11.3%
2 SVM 93.3% 8.3% 6.7%
215 115 Private Depth 512 ˆ 424 Yes Minimum, maximum, average, standard deviation of velocity, and distance between the pigs 5 SVM 95.7% 4.2% 4.3%
Furthermore, we classified aggressive behaviors into head-to-head (or body) knocking and chasing. The classification accuracy of the proposed system was measured using precision and recall as the performance measurements [24,25]: Precision “ Recall “
TP ˆ 100 TP ` FP
(6)
TP ˆ 100 TP ` FN
(7)
The classification results obtained for the aggression behaviors analyzed in this study are summarized in Table 4. The results of our experiment indicated that the average classification accuracy was 90.2%, where the average precision and recall were 90.2% and 90.1%, respectively. The SVM 2 classifier was used in this experiment, as shown in Figure 2. We employed an RBF kernel, and the trade-off constant C and the Gamma value were set at 4.5 and 3.5, respectively. We also summarized the quantitative/qualitative analysis with the existing RGB-based method (in Table 5). Table 4. Performance metrics for aggressive behavior classification. Aggression Classifier SVM 2
Class
Precision
Recall
Head-to-head (or body) knocking Chasing Average
88.9% 91.5% 90.2%
92.3% 87.8% 90.1%
Sensors 2016, 16, 631
8 of 11
Table 5. Summary of the quantitative/qualitative analysis for the aggressive behavior classification. Sensors 2016, 16, 631 Parameter
Oczak et al. [17]
Proposed Method
8 of 11
Aggressive behavior Head-to-head (or body) knocking Medium and high aggression type and chasing Table 5. Summary of the quantitative/qualitative analysis for the aggressive behavior classification. Aggressive behavior 634/1253 seconds 61/54 episodes dataParameter size Oczak et al. [17] Proposed Method Used data Private Private Head-to-head (or body) knocking Aggressive behavior type Medium and high aggression Camera type Color Depth and chasing Aggressive behavior data size 634/1253 seconds 61/54 episodes 1032 × 778 512 × 424 Camera resolution Used data Private Private Tracking N/A Yes Camera type Color Depth Average, maximum, minimum, Minimum, maximum, average, Camera resolution 1032 ˆ 778 512 ˆ 424 Features summation and varianceN/A of activity standard deviation of Tracking Yesvelocity, and Minimum, maximum, average, Average, indexmaximum, minimum, distance between the pigs Features summation and variance of standard deviation of velocity, and Feature vector 5 activity index distance5between the pigs dimension Feature vector dimension 5 5 Method Artificial neural network SVM Method Artificial neural network SVM Precision 87.7% 87.7% 90.2% Precision 90.2% 90.1% RecallRecall 81.9% 81.9% 90.1%
3.3. 3.3. Discussion Discussion According According to to the the Welfare Welfare Quality® Quality® Assessment protocols, protocols, farmers farmers should should assess assess injuries injuries in in the the pen pen indicating indicating the the occurrences occurrences of of aggression aggression as as aa way way of of checking checking the the health health and and welfare welfare status status of of their their animals animals [27]. [27]. Since Since this this procedure procedure requires requires large large amounts amountsof of time time and and labor, labor, both both farmers farmers and and animals animals should should benefit benefit from from an an automatic automatic aggression aggression monitoring monitoring system [14]. [14]. Although Although aarich richvariety variety of of methods methods in in behavior behavior recognition recognition for for humans humans and and animals animals using using RGB RGB video video data datahave have already already been been introduced introduced in in the the literature literature [14,17,28–32], [14,17,28–32], to to the the best best of our knowledge, knowledge, an an automated automated analysis analysis of of anomalies anomalies for for the the detection detection of of aggression aggression in in aa pigsty pigsty using using aa Kinect Kinect depth depth sensor sensor has has not not yet yet been been reported. reported. When WhenaaKinect Kinectsensor sensorisis used, used, aa real-time real-time depth depth map map can can be be easily easily captured captured through through aa simple simple operation operation and and aa friendly friendly application application programming programming interface interface [33]. [33]. Depth Depth images images have have several several advantages advantages over over RGB RGB images: images: they theyare arerobust robust to to changes changes in incolor color and andvariations variationsin intextures, textures,and andthey they are robusttotocircumventing circumventing problem of shadows and illumination. Depthprovide imagesimproved provide are robust thethe problem of shadows and illumination. Depth images improved with respect to[28–30,34]. occlusionIn[28–30,34]. particular, the hog barn robustnessrobustness with respect to occlusion particular,In controlling thecontrolling hog barn temperature is temperature is one of the most important issues in pig management. However, inof winter, some of the one of the most important issues in pig management. However, in winter, some the pigs captured pigs from acannot RGB camera cannot be detected due to theofstrong impact of As a heating fromcaptured a RGB camera be detected correctly due tocorrectly the strong impact a heating lamp. shown lamp. As 9, shown Figure 9, some areasbeindetected a pigstycorrectly cannot even be detected correctly even with in Figure some in areas in a pigsty cannot with complicated histogram complicated histogram equalization techniques, such ashistogram contrast equalization limited adaptive histogram equalization techniques, such as contrast limited adaptive (CLAHE) [35]. In equalization (CLAHE) [35].solution In orderfor to the provide a robust solution forand the problem of winter, illumination and order to provide a robust problem of illumination shadow in it is more shadow in winter, it is more appropriate to consider the depth Compared to thesolution, typical appropriate to consider the depth information. Compared to theinformation. typical stereo-camera-based stereo-camera-based solution, an infrared (IR)-based sensor can provide morelower accurate an infrared (IR)-based Kinect sensor can provide more Kinect accurate information at a much cost, information at a much lowercalibration cost, without complicated camera calibration without complicated camera and stereo-matching operations [36]. and stereo-matching operations [36].
Figure 9. Pig detection failure due to a heating lamp in winter: (a) RGB input image; (b) CLAHE Figure 9. Pig detection failure due to a heating lamp in winter: (a) RGB input image; (b) CLAHE output image; and (c) Kinect depth image. output image; and (c) Kinect depth image.
Sensors 2016, 16, 631
9 of 11
Generally, each pig either rests or sleeps throughout most of the day and night. A single standing pig (i.e., detected with a depth threshold) is also excluded from this present study’s consideration. On average, less than one interacting pig (i.e., standing pigs detected as a group whose size is larger than one pig) is detected from an input depth frame, and thus needs to be classified. As explained in Section 3.1, 330 episodes of interactions were obtained from 50 h of depth videos. Therefore, real-time execution can be achieved, as shown in Table 6. Table 6. Summary of the computational cost of each step. Parameter
Execution Time (ms)
Frame Rate (fps)
Depth information acquisition (per frame) Feature extraction (per interacting pigs) Aggressive detection/classification (per episode) Total *
56 10 1 1981 (per episode)
17.85 100 30,000 15.14
* Computed as one interacting-pig, assumed to be detected from one 30-framed episode.
This study aimed to detect and classify aggressive behaviors among weaning pigs in an intensive commercial pigsty. Toward that end, it extracted activity features from the Kinect depth sensor information obtained in a pigsty and used two binary-classifier SVMs in a hierarchical manner to detect and classify aggressive events that were transformed into the five-dimensional feature vector space. Meanwhile, the support vector data description (SVDD) could be used to detect aggressive behaviors, as it is a natural anomaly or novelty detector in intelligent systems. Likewise, other classifiers that consider spatio-temporal features, such as the conditional random field, the recurrent neural networks, and the Markov model, are additional candidate methods that could be considered. This has yet to be investigated. As far as we know, this study is the first to report on the aggression detection of weaning pigs in a pig monitoring system using Kinect depth data and SVMs. This study’s results suggest that analysis of Kinect depth information could be a creditable method for understanding pig behavior. Because the depth map acquired from even a low-cost Kinect depth sensor can detect pig aggressive behaviors accurately and economically without causing any additional stress to the pigs, our proposed method can be used either as a standalone solution or as a way to complement other known methods in order to obtain a more accurate solution. Furthermore, even when a new aggression class appears, it can be easily adapted to our proposed system for incremental updating and scaling without reconstructing the entire system. For future work, we will consider the multi-modality of the RGB video and depth information. Our proposed system can be tested and refined further in commercial production settings, including more aggressive animal behaviors, as necessary. Thus, a complete real-time system that can incorporate the automatic detection of pig aggressive behaviors is a part of our ongoing research. 4. Conclusions In the management of group-housed livestock, detecting anomalies early is very important. In particular, failure to detect aggression in a timely and accurate manner in intensive commercial pigsties could seriously limit efficient reproductive performance. In this study, we developed a low-cost, non-invasive, and automatic prototype system to monitor animal activity in a commercial pig farm, which notifies the farmer of aggression situations in the pigsty. The proposed system preprocesses an activity-feature subset by analyzing the pig activities acquired using a Kinect depth sensor. The recognition module detects aggressive behaviors and classifies them hierarchically based on aggression sub-types, such as head-to-head (or body) knocking and chasing. In our experiments, we found that the accuracy of the aggressive behavior detection obtained using the proposed system was 95.7%, and the aggressive behavior classification measures were satisfactory. Acknowledgments: This research was supported by the Basic Science Research Program through the NRF funded by MEST (No. 2015R1D1A1A09060594).
Sensors 2016, 16, 631
10 of 11
Author Contributions: Jonguk Lee, Long Jin, Daihee Park, and Yongwha Chung designed the overall proposed automatic pig aggression detection and recognition system using sound analysis. In addition, they wrote and revised the paper. Jonguk Lee and Long Jin collected sound data, and Jonguk Lee, Long Jin, Daihee Park, and Yongwha Chung implemented the proposed method, and helped with the experiments. Conflicts of Interest: The authors declare no conflicts of interest.
References 1. 2. 3. 4.
5.
6.
7. 8. 9. 10. 11. 12. 13. 14. 15.
16.
17.
18. 19. 20.
Chung, Y.; Oh, S.; Lee, J.; Park, D.; Chang, H.; Kim, S. Automatic detection and recognition of pig wasting diseases using sound data in audio surveillance systems. Sensors 2013, 13, 12929–12942. [CrossRef] [PubMed] Chung, Y.; Lee, J.; Oh, S.; Park, D.; Chang, H.; Kim, S. Automatic detection of cow’s oestrus in audio surveillance system. Asian Austr. J. Anim. Sci. 2013, 26, 1030–1037. [CrossRef] [PubMed] Lee, J.; Noh, B.; Jang, S.; Park, D.; Chung, Y.; Chang, H.-H. Stress detection and classification of laying hens by sound analysis. Asian Austr. J. Anim. Sci. 2015, 28, 592–598. [CrossRef] [PubMed] Mendes, L.B.; Ogink, N.W.; Edouard, N.; Van Dooren, H.J.C.; Tinôco, I.D.F.F.; Mosquera, J. NDIR gas sensor for spatial monitoring of carbon dioxide concentrations in naturally ventilated livestock buildings. Sensors 2015, 15, 11239–11257. [CrossRef] [PubMed] Lee, J.; Zuo, S.; Chung, Y.; Park, D.; Chang, H.-H.; Kim, S. Formant-based acoustic features for cow's estrus detection in audio surveillance system. In Proceedings of the 11th IEEE International Conference on Advanced Video and Signal Based Surveillance (AVSS 2014), Seoul, Korea, 26–29 August 2014; pp. 236–240. Ahmed, S.T.; Mun, H.S.; Islam, M.M.; Yoe, H.; Yang, C.J. Monitoring activity for recognition of illness in experimentally infected weaned piglets using received signal strength indication ZigBee-based wireless acceleration sensor. Asian Austr. J. Anim. Sci. 2016, 29, 149–156. [CrossRef] [PubMed] Camerlink, I.; Turner, S.P.; Ursinus, W.W.; Reimert, I.; Bolhuis, J.E. Aggression and affiliation during social conflict in pigs. PLoS ONE 2014, 9, e113502. [CrossRef] [PubMed] Mendl, M.; Zanella, A.J.; Broom, D.M. Physiological and reproductive correlates of behavioural strategies in female domestic pigs. Anim. Behav. 1992, 44, 1107–1121. [CrossRef] Forde, J.N.M. Piglet-and stockperson-directed sow aggression after farrowing and the relationship with a pre-farrowing, human approach test. Appl. Anim. Behav. Sci. 2002, 75, 115–132. [CrossRef] D’Eath, R.B.; Turner, S.P. The natural behaviour of the pig. In The Welfare of Pigs; Springer: Dordrecht, The Netherlands, 2009; pp. 13–45. Poletto, R.; Kretzer, F.C.; Hötzel, M.J. Minimizing aggression during mixing of gestating sows with supplementation of a tryptophan-enriched diet. Physiol. Behav. 2014, 132, 36–43. [CrossRef] [PubMed] McGlone, J.J.; Kelley, K.W.; Gaskins, C.T. Lithium and porcine aggression. J. Anim. Sci. 1980, 51, 447–455. [PubMed] Stookey, J.M.; Gonyou, H.W. The effects of regrouping on behavioral and production parameters in finishing swine. J. Anim. Sci. 1994, 72, 2804–2811. [PubMed] Faucitano, L. Causes of skin damage to pig carcasses. Can. J. Anim. Sci. 2001, 81, 39–45. [CrossRef] Bracke, M.B.M.; Spruijt, B.M.; Metz, J.H.M.; Schouten, W.G.P. Decision support system for overall welfare assessment in pregnant sows A: Model structure and weighting procedure. J. Anim. Sci. 2002, 80, 1819–1834. [PubMed] Viazzia, S; Ismayilovab, G.; Oczaka, M.; Sonodac, L.T.; Felsc, M.; Guarinob, M.; Vrankena, E.; Hartungc, J.; Bahra, C.; Berckman, D. Image feature extraction for classification of aggressive interactions among pigs. Comput. Electron. Agric. 2014, 104, 57–62. Oczak, M.; Viazzi, S.; Ismayilova, G.; Sonoda, L.T.; Roulston, N.; Fels, M.; Bahr, C.; Hartung, J.; Guarino, M.; Berckman, D.; Vranken, E. Classification of aggressive behaviour in pigs by activity index and multilayer feed forward neural network. Biosyst. Eng. 2014, 119, 89–97. [CrossRef] Cristianini, N.; Shawe-Taylor, J. An Introduction to Support Vector Machines and Other Kernel-Based Learning Methods; Cambridge University Press: Cambridge, UK, 2000. Kim, H.; Lee, S.; Lee, D.; Choi, S.; Ju, J.; Myung, H. Real-time human pose estimation and gesture recognition from depth images using superpixels and SVM classifier. Sensors 2015, 15, 12410–12427. [CrossRef] [PubMed] Lee, J.; Choi, H.; Park, D.; Chung, Y.; Kim, H.-Y.; Yoon, S. Fault detection and diagnosis of railway point machines by sound analysis. Sensors 2016, 16, 549. [CrossRef] [PubMed]
Sensors 2016, 16, 631
21. 22. 23. 24. 25. 26. 27. 28.
29.
30.
31. 32.
33.
34.
35. 36.
11 of 11
Kavzoglu, T.; Colkesen, I. A kernel functions analysis for support vector machines for land cover classification. Int. J. Appl. Earth Obs. Geoinf. 2009, 11, 352–359. [CrossRef] Zuo, S.; Jin, L.; Chung, Y.; Park, D. An index algorithm for tracking pigs in pigsty. WIT Trans. Eng. Sci. Southampt. 2014, 93, 797–803. Hall, M.; Frank, E.; Holmes, G.; Pfahringer, B.; Reutemann, P.; Witten, I. The WEKA data mining software: An update. SIGKDD Explor. 2009, 11, 10–18. [CrossRef] Han, J.; Kamber, M.; Pei, J. Data Mining: Concepts and Techniques, 3rd ed.; Morgan Kaufman: San Francisco, CA, USA, 2012. Theodoridis, S.; Koutroumbas, K. Pattern Recognition, 4th ed.; Academic Press: Kidlington, UK, 2009. Jin, L. Automatic Detection of Abnormal Behavior in Video Monitoring System. Master’s Thesis, Department of Computer and Information Science, Korea University, Sejong, Korea, February 2015. Dalmau, A.; Temple, D.; Rodriguez, P.; Llonch, P.; Velarde, A. Application of the welfare quality® protocol at pig slaughterhouses. Anim. Welf. 2009, 18, 497–505. Ni, B.; Dat, N.C.; Moulin, P. RGBD-camera based get-up event detection for hospital fall prevention. In Proceedings of the IEEE International Conference on Acoustics, Speech and Signal Processing (ICASSP 2012), Kyoto, Japan, 25–30 March 2012; pp. 1405–1408. Ni, B.; Wang, G.; Moulin, P. Rgbd-hudaact: A color-depth video database for human daily activity recognition. In Proceedings of the IEEE International Conference on Computer Vision Workshops (ICCV 2011), Barcelona, Spain, 6–13 November 2011; pp. 193–208. Xia, L.; Aggarwal, J.K. Spatio-temporal depth cuboid similarity feature for activity recognition using depth camera. In Proceedings of the IEEE Conference on Computer Vision and Pattern Recognition Workshops (CVPR 2013), Portland, OR, USA, 23–28 June 2013; pp. 2834–2841. Antonakaki, P.; Kosmopoulos, D.; Perantonis, S.J. Detecting abnormal human behaviour using multiple cameras. Sign. Process. 2009, 89, 1723–1738. [CrossRef] Datta, A.; Shah, M.; Lobo, N.D.V. Person-on-person violence detection in video data. In Proceedings of the 16th International Conference on Pattern Recognition (ICPR 2002), Quebec, QC, Canada, 11–15 August 2002; pp. 433–438. Shen, Y.; Hao, Z.; Wang, P.; Ma, S.; Liu, W. A novel human detection approach based on depth map via Kinect. In Proceedings of the IEEE Conference on Computer Vision and Pattern Recognition Workshops (CVPR 2013), Portland, OR, USA, 23–28 June 2013; pp. 535–541. Xia, L.; Chen, C.C.; Aggarwal, J.K. Human detection using depth information by Kinect. In Proceedings of the IEEE Conference on Computer Vision and Pattern Recognition Workshops (CVPR 2011), Colorado Springs, CO, USA, 20–25 June 2011; pp. 15–22. Zuiderveld, K. Contrast limited adaptive histogram equalization. In Graphics Gems IV; Academic Press: Cambridge, MA, USA, 1994; pp. 474–485. Han, J.; Shao, L.; Xu, D.; Shotton, J. Enhanced computer vision with Microsoft Kinect sensor: A review. IEEE Trans. Cybernet. 2013, 43, 1318–1334. © 2016 by the authors; licensee MDPI, Basel, Switzerland. This article is an open access article distributed under the terms and conditions of the Creative Commons Attribution (CC-BY) license (http://creativecommons.org/licenses/by/4.0/).