European Journal of Remote Sensing - 2016, 49: 239-259
doi: 10.5721/EuJRS20164914 Received 04/09/2015 accepted 11/04/2016
European Journal of Remote Sensing An official journal of the Italian Society of Remote Sensing
www.aitjournal.com
Automatic Segment-Level Tree Species Recognition Using High Resolution Aerial Winter Imagery Anton Kuzmin1*, Lauri Korhonen1, Terhikki Manninen2 and Matti Maltamo1 School of Forest Sciences, P.O. Box 111, University of Eastern Finland, FI-80101, Joensuu, Finland 2 Finnish Meteorological Institute, P.O. Box 503, FI-00101, Helsinki, Finland *Corresponding author, e-mail address:
[email protected]
1
Abstract
Our objective was to automatically recognize the species composition of a boreal forest from high-resolution airborne winter imagery. The forest floor was covered by snow so that the contrast between the crowns and the background was maximized. The images were taken from a helicopter flying at low altitude so that fine details of the canopy structure could be distinguished. Segments created by an object-oriented image processing were used as a basis for a linear discriminant analysis, which aimed at separating the three dominant tree species occurring in the area: Scots pine, Norway spruce, and downy birch. In a cross validation, the classification showed an overall accuracy of 81.9%, and a kappa coefficient of 0.73. Keywords: Remote sensing, tree species, high resolution images, boreal forest, object oriented image analysis, uav.
Introduction
Exact information on the forest structure is needed for many environmental, monitoring or protection tasks. Albedo of different forest types is needed in climate models [e.g. Bonan, 2008]. Canopy structure has a large effect on albedo especially in the snow-covered season [Ni and Woodcock, 2000; Lukeš et al., 2014]. Remotely sensed estimates of leaf area index (LAI), canopy cover, and tree height, have therefore been noticed useful in albedo modelling [Manninen et al., 2009; Kuusinen et al., 2016]. However, one of the key variables controlling the forest albedo, the tree species composition [Bright et al., 2013], is difficult to estimate directly from remote sensing, and even with field-calibrated empirical models errors are common [Dalponte et al., 2014; Vauhkonen et al., 2014]. Boreal forests are mostly dominated by coniferous species, but the fraction of deciduous species is not negligible. From the climate point of view, it is essential that in winter the surface albedo of the forested area is determined by the snow albedo of the forest floor and the LAI of the canopy [Manninen and Stenberg, 2009]. In addition, partitioning of net radiation into sensible and latent heat in boreal forests, causes a significant impact on the seasonal and annual climatology of the Northern Hemisphere [Bonan et al., 1995]. The 239
Kuzmin et al.
Automatic tree species recognition from aerial images
positive forcing on climate induced by decreases in albedo due to coniferous species can offset the negative forcing that is expected from carbon sequestration [Betts, 2000]. As the deciduous species are leafless in winter, the winter time albedo of the forests increases, when the fraction of deciduous species increases. Hence, changing the species fraction affects the energy budget of the forested area. The role of boreal forests as increasing or mitigating climate change depends much on the deciduous/coniferous species balance. Recently, Manninen et al. [2009, 2012] developed a method for estimating LAI from digital aerial photographs taken in snowy conditions to support albedo modelling [Manninen et al., 2009] and validation of optical satellite products [Fang et al., 2012]. Their LAI estimation was based on images taken from a helicopter flying at low altitudes (30-100 m) above the snow-covered ground. Because of the white background, thresholding the images was considerably easier than in the summer. Thus the LAI could be estimated from the gap fraction values using methodology similar to field-based LAI estimation from hemispherical photographs. Such data can provide strips of accurate LAI samples for northern, difficultto-access regions, where field work is difficult to conduct especially in late winter when the snow is deep, but the daylight is increasing and the albedo effects become increasingly important. Complete reference data for albedo modelling should however include also the species composition. Images similar to Manninen et al. [2009, 2012] can show the canopy structure with a very high level of detail, so that even individual shoots are visible from low altitude images. As the canopy structure is species dependent, it is interesting to study how accurately the tree species can be estimated using this information. The case of snowcovered background is a good starting point, because the canopy structure is clearly visible without the hindrance of green understory vegetation that is commonly present in boreal forests in the summer. Including both LAI and species composition into the models derived from aerial image data would be highly desirable from the perspective of climate studies. The use of aerial images as one of the main data sources for forest inventory was researched intensively before the emergence of airborne laser scanning technology [Hyyppä et al., 1998; Brandtberg, 1999; Gong et al., 1999]. Currently in forest inventory, aerial images are regarded as auxiliary data source to LiDAR to support tree species recognition [Leckie et al., 2003; Packalen et al., 2009]. Many studies have focused on segmentation of individual tree crowns from high spatial resolution images. Different techniques such as template matching, valley following, local maximum filtering, edge detection, spatial clustering, watershed transformation or combinations of these have been tested with promising results [Brandtberg and Walter, 1998; Culvenor, 2002; Pouliot et al., 2002; Erikson, 2003a; Erikson, 2003b; Wang, 2010]. Meyer et al. [1996] presented a semi-automated procedure for the tree species classification, and achieved an overall accuracy of 80%. Haara and Haarala [2002] applied a semi-automatic pattern recognition technique and reached an overall accuracy of 54-91% based on the spectral properties of trees. Korpela [2004] used multiple CIR aerial images and spectral classification of individual trees, achieving overall accuracies between 78% and 90%. Brandtberg [2002] developed a method for classification of the tree crowns using fuzzy sets with overall accuracy of 67% and Gougeon et al. [1999] developed a method using spectral signatures and achieved overall classification accuracy of 59.8%. The Illumination Dependent Colour Channels (IDCC) method presented by Puttonen [2010] provided an overall accuracy of 70.8% correctly classified tree species. Species classification of the 240
European Journal of Remote Sensing - 2016, 49: 239-259
tree crowns from extremely high resolution images (less than 5 cm) has been studied less [Gini et al., 2014; Lisein et al., 2015]. Michez et al. [2016] achieved overall accuracies of 72%, 68%, and 97% for I. glandulifera, Japanese knotweed, and H. mantegazzianum, respectively, in riparian invasive species classification. Object-oriented image analysis was presented in 1980 by Landgrebe [1980]. It is a technique used to analyze digital imagery, and was developed relatively recently compared to traditional pixel-based image analysis [Burnett and Blaschke, 2003]. Contrary to the pixel based image analysis, object-based image analysis utilizes information from a set of similar pixels called objects or image objects. More specifically, image objects are groups of pixels that are similar to one another based on a measure of spectral properties (i.e., color), size, shape, and texture, as well as context from a neighborhood surrounding the pixels. This method has become accessible to scientists due to the software eCognition [Definiens AG, 2007a]. Results of tree species classification in these studies [Ke and Quackenbush, 2007; Voss and Sugumaran, 2008; Kim et al., 2011; Lamonaca et al., 2008; Waser et al., 2011] were better than using the previous methods but still not sufficiently good to use it on operational level. In this study our objective was to test species recognition using object-oriented image analysis and very high resolution aerial winter images obtained for LAI estimation and albedo modelling. After the separation of the canopy and the background, we split the canopy layer into the segments using object-oriented image analysis. We assumed that the shape, texture, and spectral values of the segments would be different among the three tree species occurring in the area, and used linear discriminant analysis to establish a classifier for the segments. Thus, the species proportions of each image could be evaluated as the fraction of segments representing each species, and the results can be used to calculate LAI fractions by species for albedo modelling. We also assessed the influence of different predictors and tested how well the model would perform without using the spectral features, which are more dependent on the illumination than the shape or texture features.
Data acquisition
Study Area The study area is located in Sodankylä, Northern Finland (67°22’ N, 26° 38’ E). The landscape is heterogeneous and consists of forests, open or sparsely wooded peatlands and water bodies. The forests are managed for timber production, and different thinning, clear cut and regeneration operations make the forest stands structurally different. The soils are generally poor and therefore the main tree species is Scots pine (Pinus sylvestris L.), but also Norway spruce (Picea abies L. [H] Karst) and birches (Betula spp. L.) are common on more fertile and humid soils. The number of stems ranges from >5000 ha-1 in very dense seedling stands to 300-500 ha-1 in old-growth forests on the poorest soils. A height of 20 meters is only reached at the best fertility sites, and the canopy cover values are typically fairly low (30-70%) even in mature stands. The snow cover in the area during the data acquisition was approximately 80 cm thick, but the trees were free of packed snow. Airborne Measurements The images were obtained over the same region during the SNORTEX campaign in March 19, 2010 at 11:20-15:00 local time [Roujean et al., 2010; Manninen and Roujean, 2014]. 241
Kuzmin et al.
Automatic tree species recognition from aerial images
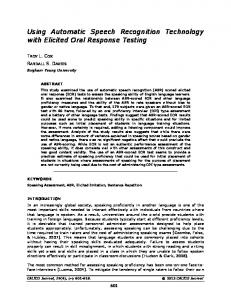
For the image acquisition a pocket camera Canon Powershot A640 with a 0.7 × wide angle conversion lens WC-D58N was attached to the helicopter landing gear so that it was looking orthogonally downwards [Manninen et al., 2009]. The images were taken every 3 seconds and the 3-D GPS coordinates were registered for each image. The helicopter visited a set of field plots where LAI measurements had been obtained earlier, and acquired images from several altitudes. We selected the lowest altitude image from each plot (n=18), and set of other low-altitude images taken while flying from plot to plot so that the final number of images used in the analyses was 37. The image altitudes above ground level varied from 27 to 71m, corresponding spatial resolutions 0.8-2.1 cm at nadir. The images were stored in standard jpg format directly to a laptop used for operating the camera. We did not calibrate the camera nor the images photogrammetrically, but applied each image as a sample of species composition corresponding to the same exact view that was used to estimate the LAI [Manninen et al., 2009]. The weather conditions during the flights were not optimal, i.e., instead of having the desired completely overcast sky, the Sun was shining, so the snow at the forest floor was striped by tree shadows (Fig. 1).
Figure 1 - One of the measurement plots seen from the helicopter. The black cross sign indicates the plot center.
Methods
Image Segmentation The aerial images were processed using the Definiens Developer version 7.0.6 (formerly known as eCognition software). This software is a platform for multi-dimensional image analysis. It contains the client and server software needed to extract information from a digital image in a fully-automated or semi-automated way. The aim of the analysis is 242
European Journal of Remote Sensing - 2016, 49: 239-259
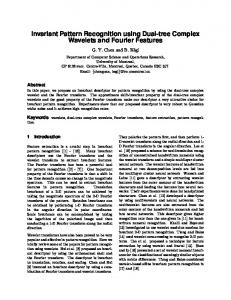
image object classification that enables the generation of numerical values and statistics. Automatic detection of objects in a digital image starts with cutting the image into pieces called image object primitives that are rather homogeneous inside and have shape and size such that they can serve as building blocks for further processing. This step is called segmentation [Definiens AG, 2007a]. The quad tree based and multi-resolution algorithms are used for segmentation. The quad tree based segmentation algorithm splits the image into a quad tree grid formed by square objects. The quad tree structure is built in a way that each square has firstly the maximum possible size and secondly fulfills the homogeneity criteria as defined by the mode and scale parameter. It repeats until the homogeneity criterion is met at each square. The scale parameter to define an upper limit of color difference within each square was set to 15, in order to have better processing performance. Afterwards, the multiresolution segmentation algorithm will consecutively merge the existing image objects in several loops to larger units as long as an upper threshold of homogeneity is not exceeded locally. This homogeneity criterion is customized as a combination of shape and compactness criteria. The size of the segments can be changed in this calculation by modifying the scale parameter [Definiens AG, 2007b]. We found that the optimal thresholds for shape and compactness criteria were 0.1 and 0.5, respectively, and the optimal value for the scale parameter was 100. This way we obtained the homogenous segments that represented a single crown, crown parts that were illuminated differently, shadowed snow, or illuminated snow, depending on the imaging altitude and the size of the trees (Fig. 2).
Figure 2 - An example of the segmentation.
243
Kuzmin et al.
Automatic tree species recognition from aerial images
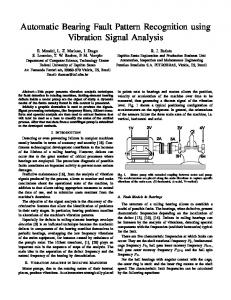
Feature Extraction The next step of the process was to build a set of classification rules in the eCognition software in order to exclude the segments belonging to snow. The assign class algorithm was used with the threshold condition based on spectral values to determine whether an image object belonged to the background or the vegetation (Fig. 3). We found that separation of snow and shadows from the vegetation functioned best using the threshold parameter of 130 for 8-bit mean brightness. Some errors were however included into the classification process, for example a few shadows from groups of the trees were misclassified, as well as some of the birch branches. Segments classified as vegetation layer were used to estimate the species composition. Different features describing the shape, spectral and texture values of the segments were then calculated. The shape features describe, for example, the roundness, asymmetry, length and width of the segment. Texture features were calculated from the gray-level co-occurrence matrix (GLCM) as suggested by Haralick et al. [1973]. The spectral values of blue, green, and red bands were normalized by dividing the RGB vector by its norm. Thus the sum of RGB values was always one for each segment. The rest of the spectral features were included as such. Appendix 1 contains explanations and abbreviations for all of the features.
Figure 3 - Background extraction.
For the 37 images used in the analysis, we aimed to have ten training segments from each image. Since spruce and birch only appeared on 24 images out of 37, we sampled 15 segments of those from each image. A total of 1134 segments representing the spruce 244
European Journal of Remote Sensing - 2016, 49: 239-259
(n=380), pine (n=370), and birch (n=384) were selected randomly from different parts of the 37 training images and used to train the species classifier. The tree species was interpreted visually from the high-resolution images for each segment. Shape, texture and spectral features of the selected segments were exported for further classification with linear discriminant analysis. Statistical analysis The segment data were imported into statistical software R [R Core Team, 2013] for classification with the linear discriminant analysis (LDA). The LDA is implemented in additional library MASS [Venables and Ripley, 2002]. We chose to apply classification model to current data set in order to separate the three species simultaneously with and without spectral features. Before classification, each variable vector was normalized by subtracting the mean from the individual values, and then dividing it by the standard deviation. Equal priors were assumed for all classes. Confusion matrices and kappa coefficients were calculated for the estimates using leaveimage-out cross validation. The segments from an image were left out, the model was refitted using the remaining images and the same predictors, and finally the species of the omitted segments were predicted using the re-estimated model coefficients. The process was repeated separately for each image.
Results
Results for the Training Data We applied LDA to obtain discriminant functions for the tree species classification using the combination of the spectral, shape and texture features (Tab. 1). Texture variable GLCM dissimilarity had the largest absolute coefficient and contribution to the first discriminant, followed by the normalized greenness and two other texture variables: GLCM homogeneity and contrast. The second discriminant was dominated by GLCM dissimilarity and contrast. The first linear discriminant explained 88.3% of the between-group variation, i.e. the contribution of the second discriminant was reasonably small. This is visualized better in Figure 4, where the class separation is plotted based on the two discriminant axes. The birches are reasonably well separated from the conifers. The pine segments seem fairly homogeneous, but the variability within spruce segments is large and some of the spruce segments overlap with pine segments in the classification. Table 1 - Coefficients of the discriminant functions in the classification. See Appendix A for explanation of the variables. Predictor
Feature type
Discriminant 1
Discriminant 2
GLCMDissim
Texture
-1.878
-2.907
GLCMContra
Texture
1.369
2.356
Radiusofsm
Shape
0.2263
0.4214
GLCMStdDev
Texture
-0.6907
0.2918
GLCMHomoge
Texture
-1.383
0.6524
NormGreen
Spectral
-1.568
-0.4275
245
Kuzmin et al.
Automatic tree species recognition from aerial images
Figure 4 - Class separation by the two discriminant axes in the classification.
The confusion matrix derived from the leave-image out cross validation is shown in Table 2. The overall accuracy of the model was 81.9% and the kappa coefficient 0.73, indicating that the classification functioned reasonably well. The confusion matrix highlights the same problem that is visible in Figure 4: pine and spruce were mixed, and the user’s accuracies for these species were 73.5% and 75%, respectively. However, almost all of the birch segments were classified correctly (user’s accuracy 96.9%), but the producer’s accuracy was only 87.1%, i.e. some of the conifer segments were erroneously classified as birch. Table 2 - Confusion matrix of the cross-validated results for the classification. The kappa coefficient was 0.73. Observed Spruce
Pine
Birch
Total
Producer’s accuracy, %
285
68
0
353
80.7
70
272
12
354
76.8
25
30
372
427
87.1
Total
380
370
384
1134
User’s accuracy, %
75
73.5
96.9
Spruce Predicted Pine Birch
246
81.9
European Journal of Remote Sensing - 2016, 49: 239-259
Based on the means species-wise means of the classification variables (Tab. 3), the large discriminant coefficients of the texture variables are mainly related to the separation of spruce, as the spruce segments have, on average, large values in GLCM homogeneity and small values in dissimilarity, contrast and standard deviation. The textures of leaf-off birch and pine were however fairly similar. The separation of pine and birch is mainly based on the normalized greenness and the shape variable Radiusofsm (radius of smallest enclosing ellipse), which Radiusofsm describes how much the object shape deviates from an ellipse. The segments of leaf-off birches represented mainly stems and could therefore have very long and narrow shapes. Many of the pine trees had segments representing stems as well, which were sometimes classified as birch because of the shape similarity. The Radiusofsm average values for the pine segments was 1.86 and for birch segments 2.17, i.e. the birches deviated more from the ellipsoidal shape. Some of the birch segments that were reasonably close to an elliptic shape were also misclassified as pines (Fig. 5). For the birch segments in Figure 5, the Radiusofsm ranged from 1.48 to 2.03, which strongly contributed to the misclassification. However, these cases represented only 3% of the birch segments (Tab. 2). Table 3 - Comparison table of mean values for the features selected into the final model. Variable
Species
Min
Mean
Max
SD
GLCMDissim
Spruce
2.029
5.608
25.495
2.911
Pine
3.629
8.832
24.671
3.433
Birch
3.842
9.047
23.366
3.769
Spruce
6.375
78.191
1073.783
100.856
Pine
23.104
165.736
1032.969
133.835
Birch
26.028
184.136
911.193
158.033
Spruce
1.126
1.749
3.242
0.324
Pine
1.275
1.856
3.036
0.319
Birch
1.269
2.166
4.361
0.477
Spruce
2.967
10.988
42.044
5.480
Pine
5.598
15.983
37.407
5.487
Birch
7.291
16.087
32.993
5.331
Spruce
0.037
0.189
0.342
0.061
Pine
0.035
0.122
0.228
0.038
Birch
0.041
0.123
0.220
0.039
Spruce
0.330
0.367
0.411
0.014
Pine
0.331
0.355
0.388
0.013
Birch
0.318
0.332
0.346
0.004
GLCMContra
Radiusofsm
GLCMStdDev
GLCMHomoge
NormGreen
247
Kuzmin et al.
Automatic tree species recognition from aerial images
Figure 5 - Example of misclassified birch segments as pine due to shape similarity of segments. The values for variable Radiusofsm in image panes from top-left to bottom-right are 1.78, 1.84, 1.60, 2.03 and 1.47, respectively.
Next, we tested the performance of the classification model without using the spectral features. Other predictors remained the same, but the normalized green was removed from the list of variables. The discriminant functions (Tab. 4) show that the coefficients are fairly close to each other, except that GLCM homogeneity had roughly three times larger influence on the discriminant score than the other variables. The first discriminant explained 78% of the between-group variation. The discriminant plot (Fig. 6) indicates that the birch segments now overlap considerably more with pine and spruce. This is confirmed by the confusion matrix (Tab. 5), where the user’s accuracies of spruce, pine, and birch decreased by 11.3, 9.2, and 41.7 percent points, respectively. The kappa coefficient decreased from 0.73 to 0.42 and the overall accuracy from 81.9% to 61.0%. Table 4 - Coefficients of the discriminant functions in the classification without spectral variables. See Appendix A for explanation of the variables.
248
Predictor
Feature type
Discriminant 1
Discriminant 2
GLCMDissim
Texture
0.4279
-3.603
GLCMContra
Texture
-0.4017
2.910
Radiusofsm
Shape
0.2580
1.042
GLCMStdDev
Texture
-0.5717
-0.0322
GLCMHomoge
Texture
-1.478
-0.4614
European Journal of Remote Sensing - 2016, 49: 239-259
Figure 6 - Class separation by the two discriminant axes in the classification without spectral variables. Table 5 - Confusion matrix of the cross-validated results for the classification without spectral variables. The kappa coefficient was 0.42. Observed
Producer’s accuracy, %
Spruce
Pine
Birch
Total
242
41
56
339
71.4
88
238
116
442
53.8
50
91
212
353
60.1
Total
380
370
384
1134
User’s accuracy, %
63.7
64.3
55.2
Spruce Predicted Pine Birch
61.0
249
Kuzmin et al.
Discussion
Automatic tree species recognition from aerial images
Compared with the earlier studies of the species classification in the boreal forests, our results (kappa = 0.73, overall accuracy = 81.9%) are promising. The birch segments could be separated very well based on their smaller greenness, which was expected as they did not have leaves, and more elongated shape. All of the misclassified birch segments were classified as pine because of the shape similarity. Texture features formed a majority of the predictor variables in most of our models, and contributed especially to the separation of pine and spruce, although they were still difficult to distinguish. Although the aerial images had very high resolution, in some cases even the visual interpretation of the conifer species was difficult. In such cases perfect separation of the species using the machine vision may not be possible. Despite the high resolution of the images, the inclusion of spectral variables clearly improved the classification accuracy over, as the model without spectral data only reached a kappa coefficient 0.42, which is much lower than the kappa = 0.73 obtained by including the spectral variables. The use of spectral information is therefore justified, although the illumination effects have a larger contribution to the spectral than the textural features. For example, the changing position of the Sun caused variable shadowing between the trees and their surroundings, which led to incorrect classification of pine segments as spruces. Although normalizing the RBG vectors decreased the influence of weather conditions, the flights should be arranged so that the weather conditions remain the same during the whole flight campaign. In our case the weather was sunny during the flight, but when the last plots were photographed the Sun was only 17° above the horizon. Thus especially the sharpness of the shadows varied within our data set. In addition, shadows may introduce errors into the vegetation-background classification, which will also influence the estimation results. Such errors were not included in our statistical analysis, but visual inspection of the vegetation layer classification suggested that the number of such errors was small. In the workflow of object-based image analysis, image segmentation is the first and critical procedure, thus the quality of image segmentation has a decisive effect on the quality of object based image analysis [Baatz and Schäpe, 2000; Baatz et al., 2008]. In segmentation algorithms, one or several thresholds are commonly used for generating forest/non-forest or shadowed area masks [Warner et al., 1999; Leckie et al., 2005]. To produce segments in Definiens, thresholds are also a necessary component of the rule base. However, when images from different seasons, areas (forest types) or sensors are used, these thresholds may require adjustment although the basic sequence of processing and concepts behind each step will remain the same. Most of the studies mentioned here were applied to temperate forests of the northern hemisphere, especially for coniferous forests. There are only a few studies utilizing proposed method for crown segmentation in tropical ecosystems, where the forest is denser and has more diverse species composition. The highest overall accuracy for species classification in such conditions has been 83% and kappa coefficient 0.76 [Singh et al., 2015]. However, given that only the canopy segments visible to the camera need to be classified to support albedo modelling, the density of the forest does not matter, if the canopy-background separation can be performed reliably. The increasing density can however be a problem if the aim is to estimate species composition for traditional forest inventory, because for larger view angles, the smaller trees would easily become invisible. 250
European Journal of Remote Sensing - 2016, 49: 239-259
The most obvious solution would be to increase the flight altitude and classify only the middle part of the image. The high resolution image data that we obtained from a helicopter is very similar to the imagery taken from many UAV (Unmanned Aerial Vehicle) platforms. Given the current interest in developing new UAVs, high resolution aerial images may become commonly available with fairly low costs [Puliti et al., 2015]. In addition, we used a consumer grade camera. Modern cameras designed for UAV remote sensing should provide higher quality images, which should further improve the possibilities of image-based species recognition. The image acquisition will also become cheaper, because better sensors enable acquisition of images with similar resolution from higher altitudes, which reduces the costs of data collection. If the tree species could be determined reliably from the UAV data with a reasonable cost, the UAV imagery could be used to complement airborne laser scanning data correspondingly as aerial images. The UAV flights could also be focused on smaller areas where the accuracy of species detection is assumed to be low. Although the main idea of this study was to examine species recognition in the light of forest structure to support the LAI data acquisition for albedo modelling, there are applications also for stand level forest inventory. The current operational system is based on the combined use of ALS data, aerial images and field plots [Maltamo and Packalen, 2014]. This system is highly cost efficient, especially for large areas. On the other hand, for a small areas not covered by this system such an approach is very expensive due to the data acquisition. One option would then be to use existing data sources such as national laser scans [Villikka et al., 2012] or National Forest Inventory field plot data [Tuominen et al., 2014]. Local species data acquisition could then be made by applying UAV based or other very high resolution optical data. However, before practical applications an investigation of how well the segment-wise classification corresponds to field-measured species proportions is needed. Unfortunately, we did not have a field data suitable for studying it. Our method is intended to assist albedo modelling and field data collection in areas that are difficult to access. It is applicable in the boreal zone in winter time. Application of the method in summer conditions remains a topic for further studies. The task of separating the tree crowns from the background becomes more challenging when the background is not snowy, at least in boreal forests where the forest floor can be spectrally similar to the canopy. However, recent studies [Wang, 2010; Jing et al., 2012; Singh et al., 2015] showed that it is possible to extract the tree crowns from very high resolution optical data with high accuracy. Further classification can then be done utilizing the method described in this paper. Merging the texture and shape information from the images with the 3D point information that can be obtained from several overlapping images using e.g. semi-global matching [Hirschmuller, 2005; White et al., 2013] offers a possibility for even more detailed characterization of tree species and canopy structure.
Acknowledgements
The study was financially supported by CBU scholarship for postgraduate studies, strategic funds of the University of Eastern Finland, and the Academy of Finland.
251
Kuzmin et al.
Automatic tree species recognition from aerial images
Appendix A Table of abbreviations of the features as shown in the Definiens Reference Book [Definiens AG, 2007b]. Feature class Texture features after Harralick
Spectral features
252
Abbreviation
Description
GLCMMean
The GLCM mean is the average expressed in terms of the grey level co-occurrence matrix. The gray level co-occurrence matrix (GLCM) is a tabulation of how often different combinations of pixel gray levels occur in an image. The pixel value is not weighted by its frequency of occurrence itself, but by the frequency of its occurrence in combination with a certain neighbor pixel value.
GLCMHomoge
GLCM homogeneity - If the image is locally homogeneous, the value is high if GLCM concentrates along the diagonal. Homogeneity weights the values by the inverse of the Contrast weight with weights, decreasing exponentially according to their distance to the diagonal.
GLCMContra
GLCM contrast - contrast is the opposite of homogeneity. It is a measure of the amount of local variation in the image.
GLCMDissim
GLCM dissimilarity. Similar to contrast, but increases linearly. High if the local region has a high contrast
GLCMStdDev
GLCM standard deviation uses the GLCM, therefore it deals specifically with the combinations of reference and neighbor pixels. Thus, it is not the same as the simple standard deviation of gray levels in the original image.
GLCM correlation
Measures the linear dependency of gray levels of neighboring pixels.
GLDVEntrop
GLDV entropy. The values are high if all elements have similar values.
GLCMEntrop
GLCM entropy. The value for entropy is high, if the elements of GLCM are distributed equally. It is low if the elements are close to either 0 or 1.
Brightness
Brightness - sum of the mean values of the layers containing spectral information divided by their quantity computed for an image object (mean value of the spectral mean values of an image object).
Max. diff.
To calculate Max Diff. the minimum mean value belonging to an object is subtracted from its maximum value. To get the maximum and minimum value the means of all layers belonging to an object are compared with each other. Subsequently the result is divided by the brightness.
European Journal of Remote Sensing - 2016, 49: 239-259
Table of abbreviations of the features as shown in the Definiens Reference Book [Definiens AG, 2007b]. (Continued) Feature class
Shape features
Abbreviation
Description
NormBlue
Normalized spectral value of the blue band. The normalization was done by dividing the RGB vector by its norm.
NormGreen
Normalized spectral value of the green band. The normalization was done by dividing the RGB vector by its norm.
NormRed
Normalized spectral value of the red band. The normalization was done by dividing the RGB vector by its norm.
MeanLayer
Layer mean value calculated from the layer values of all pixels forming an image object.
Standardde
Standard deviation calculated from the layer values of all n pixels forming an image object.
Radiusofsm
Radius of smallest enclosing ellipse - an ellipse with the same area as the object is first created based on the covariance matrix. This ellipse is then enlarged until it’s enclosing the object in total. The ratio of the radius of this smallest enclosing ellipse to the radius of the original ellipse is returned for this feature.
Radiusofla
Radius of largest enclosed ellipse - An ellipse with the same area as the object is first created based on the covariance matrix. This ellipse is then scaled down until it’s totally enclosed by the object. The ratio of the radius of this largest enclosed ellipse to the radius of the original ellipse is returned for this feature.
Rectangula
Rectangular fit. A first step in the calculation of the rectangular fit is the creation of a rectangle with the same area as the considered object. In the calculation of the rectangle the proportion of the length to the width of the object in regarded. After this step the area of the object outside the rectangle is compared with the area inside the rectangle, which is not filled out with the object.
Roundness
Difference of enclosing/enclosed ellipse as the radius of the largest enclosed ellipse is subtracted from the radius of the smallest enclosing ellipse.
Shape index
Mathematically the shape index is the border length of the image object divided by four times the square root of its area.
253
Kuzmin et al.
Automatic tree species recognition from aerial images
Table of abbreviations of the features as shown in the Definiens Reference Book [Definiens AG, 2007b]. (Continued) Feature class
254
Abbreviation
Description
Width
The width of an image object is calculated using the lengthto-width ratio.
Length
The length can be calculated using the length-to-width ratio derived from a bounding box approximation.
Length/Wid
The ratio length/width is identical to the ratio of the eigenvalues of the covariance matrix with the larger eigenvalue being the numerator of the fraction
Maindirect
Main direction of an image object is the direction of the eigenvector belonging to the larger of the two eigenvalues derived from the covariance matrix of the spatial distribution of the image object.
EllipticFi
Elliptic fit. As a first step in the calculation of the elliptic fit is the creation of an ellipse with the same area as the considered object. In the calculation of the ellipse the proportion of the length to the width of the Object is regarded. After this step the area of the object outside the ellipse is compared with the area inside the ellipse that is not filled out with the object. While 0 means no fit, 1 stands for a complete fitting object.
Density
The density can be expressed by the area covered by the image object divided by its radius.
Compactness
This feature is similar to the border index, however instead of order based it is area based.
Border length
Border length. The border length of an image object is defined as the sum of edges of the image object that are shared with other image objects or are situated on the edge of the entire scene.
Border index
Border index. Similar to shape index, but border index uses a rectangular approximation instead of a square. The smallest rectangle enclosing the image object is created. The border index is then calculated as the ratio of the Border length of the image object to the Border length of this smallest enclosing rectangle.
Asymmetry
The more longish an image object, the more asymmetric it is. For an image object, an ellipse is approximated which can be expressed by the ratio of the lengths of the minor and the major axis of this ellipse. The feature value increases with the asymmetry.
Area
In non-georeferenced data the area of a single pixel is 1. Consequently, the area of an image object is the number of pixels forming it. If the image data is georeferenced, the area of an image object is the true area covered by one pixel times the number of pixels forming the image object.
European Journal of Remote Sensing - 2016, 49: 239-259
References
Baatz M., Schäpe M. (2000) - Multiresolution segmentation: An optimization approach for high quality multi-scale image segmentation. In: Strobl J., Blaschke T., Griesebner G. (Eds.), Angewandte Geographische Informations-Verarbeitung XII, Wichmann Verlag, Karlsruhe, pp. 12-23. Baatz M., Hoffmann C., Willhauck G. (2008) - Progressing from object-based to objectoriented image analysis. In: Blaschke T., Lang S. (Eds.), Object-based Image Analysis: Spatial Concepts for Knowledge-driven Remote Sensing Applications, Springer-Verlag, Berlin. doi: http://dx.doi.org/10.1007/978-3-540-77058-9_2. Betts R.A. (2000) - Offset of the potential carbon sink from boreal forestation by decreases in surface albedo. Nature, 408: 187-190. doi: http://dx.doi.org/10.1038/35041545. Bonan G.B., Chapin F.S. III, Thompson S.L. (1995) - Boreal forest and tundra ecosystems as components of the climate system. Climatic Change, 29: 145-167. doi: http://dx.doi. org/10.1007/BF01094014. Bonan G.B. (2008) - Forests and climate change: Forcings, feedbacks, and the climate benefits of forests. Science, 320: 1444-1449. doi: http://dx.doi.org/10.1126/ science.1155121. Brandtberg T., Walter F. (1998) - Automatic delineation of individual tree crowns in high spatial resolution aerial images by multiple-scale analysis. Machine Vision and Applications, 11 (2): 64-73. doi: http://dx.doi.org/10.1007/s001380050091. Brandtberg T. (1999) - Remote Sensing for Forestry Applications-A Historical Retrospect. Available online at: http://www.dai.ed.ac.uk/CVonline/LOCAL_COPIES/ BRANDTBERG/UK.html. Brandtberg T. (2002) - Individual tree-based species classification in high spatial resolution aerial images of forests using fuzzy sets. Fuzzy Sets and Systems, 132: 371-387. doi: http://dx.doi.org/10.1016/S0165-0114(02)00049-0. Bright R.M., Astrup R., Strømman A.H. (2013) - Empirical models of monthly and annual albedo in managed boreal forests of interior Norway. Climatic Change, 120 (1): 183196. doi: http://dx.doi.org/10.1007/s10584-013-0789-1. Burnett C., Blaschke T. (2003) - A multi-scale segmentation/object relationship modeling methodology for landscape analysis. Ecological Modeling, 168: 233-249. doi: http:// dx.doi.org/10.1016/S0304-3800(03)00139-X. Culvenor D.S. (2002) - TIDA: An algorithm for delineation of tree crowns in high spatial resolution remotely sensed imagery. Computers & Geosciences, 28 (1): 33-44. doi: http://dx.doi.org/10.1016/S0098-3004(00)00110-2. Dalponte M., Ørka H.O., Ene L.T., Gobakken T., Næsset E. (2014) - Tree crown delineation and tree species classification in boreal forests using hyperspectral and ALS data. Remote Sensing of Environment, 140: 306-317. doi: http://dx.doi.org/10.1016/j. rse.2013.09.006. Definiens AG. (2007a) - Definiens Developer 7 user guide. Munich: Difiniens AG, p. 506. Definiens AG. (2007b) - Definiens Developer 7 Reference book. Munich: Definiens AG, p. 197. Erikson M. (2003a) - Segmentation of individual tree crowns in colour aerial photographs using region growing supported by fuzzy rules. Canadian Journal of Forest Research, 33 (8): 1557-1563. doi: http://dx.doi.org/10.1139/x03-062. 255
Kuzmin et al.
Automatic tree species recognition from aerial images
Erikson M. (2003b) - Structure-preserving segmentation of individual tree crowns by Brownian motion. Proceedings of the 13th Scandinavian conference on image analysis, June 29 - July 2, 2003, Gothenburg, Sweden. Lecture Notes in Computer Science, 2749: 283-289, Berlin, Germany: Springer-Verlag. doi: http://dx.doi.org/10.1007/3-54045103-X_39. Fang H., Wei S., Liang S. (2012) - Validation of MODIS and CYCLOPES LAI products using global field measurement data. Remote Sensing of Environment, 119: 43-54. doi: http://dx.doi.org/10.1016/j.rse.2011.12.006. Gini R., Passoni, D., Pinto, L., Sona, G. (2014) - Use of Unmanned Aerial Systems for multispectral survey and tree classification: a test in a park area of northern Italy. European Journal of Remote Sensing, 47: 251-269. doi: http://dx.doi.org/ 10.5721/ EuJRS20144716. Gong P., Biging G.S., Lee S.M., Mei X., Sheng Y., Pu R., Xu B., Schwarz K.P., Mostafa M. (1999) - Photo-econometrics for forest inventory. Geographic Information Sciences, 5 (1): 9-14. Gougeon F.A., Leckie D.G., Paradine D., Scott I. (1999) - Individual tree crown species recognition: The Nahmint study. In D. Hill, D. Leckie (Eds.), Automated interpretation of high spatial resolution digital imagery for forestry, pp. 209-223. Haara A., Haarala M. (2002) - Tree species classification using semi-automatic delineation of trees on aerial images. Scandinavian Journal of Forest Research, 17: 556-565. doi: http://dx.doi.org/10.1080/02827580260417215. Haralick R.M., Shanmungam K., Dinstein I. (1973) - Textural Features of Image Classification. IEEE Transactions on Systems, Man, and Cybernetics, 3 (6): 610-621. doi: http://dx.doi.org/10.1109/TSMC.1973.4309314. Hirschmuller H. (2005) - Accurate and efficient stereo processing by semi-global matching and mutual information. IEEE Computer Society Conference on Computer Vision and Pattern Recognition, CVPR 2005, 2: 807-814. doi: http://dx.doi.org/10.1109/ CVPR.2005.56. Hyyppä J., Hyyppä H., Inkinen M., Engdahl M., Linko S., Zhu Y.-H. (1998) - Accuracy of different remote sensing data sources in the retrieval of forest stand attributes. Proceedings of the First International Conference on Geospatial Information in Agriculture and Forestry. Lake Buena Vista, FL, USA, 1-3 June 1998, 1: 370-377. Jing L., Hu B., Noland T., Li J. (2012) - An individual tree crown delineation method based on multi-scale segmentation of imagery. ISPRS Journal of Photogrammetry and Remote Sensing, 70: 88 - 98. doi: http://dx.doi.org/10.1016/j.isprsjprs.2012.04.003. Ke Y., Quackenbush L.J. (2007) - Forest species classification and tree crown delineation using quickbird imagery. ASPRS 2007, Annual Conference, Tampa, Florida, May 7-11, 2007. Kim S.-R., Lee W.-K., Doo-Ahn Kwak D.-A., Biging G.S., Gong P., Jun-Hak Lee J.-H., Cho H.-K. (2011) - Forest cover classification by optimal segmentation of high resolution satellite imagery. Sensors, 11: 1943-1958. doi: http://dx.doi.org/10.3390/s110201943. Korpela I. (2004) - Individual Tree Measurements by Means of Digital Aerial Photogrammetry. Silva Fennica Monographs, 3: 93 pp. Kuusinen N., Stenberg P., Korhonen L., Rautiainen M., Tomppo E. (2016) - Structural factors driving boreal forest albedo in Finland. Remote Sensing of Environment, 175: 256
European Journal of Remote Sensing - 2016, 49: 239-259
43-51. doi: http://dx.doi.org/10.1016/j.rse.2015.12.035. Lamonaca A., Corona P., Barbati A. (2008) - Exploring forest structural complexity by multi-scale segmentation of VHR imagery. Remote Sensing of Environment, 112 (6): 2839-2849. doi: http://dx.doi.org/10.1016/j.rse.2008.01.017. Landgrebe D. (1980) - The development of a spectral-spatial classifier for earth observational data. Pattern Recognition, 12: 165-175. doi: http://dx.doi.org/10.1016/00313203(80)90041-2. Leckie D., Gougeon F., Hill D., Quinn R., Armstrong L., Shreenan R. (2003) - Combined high-density lidar and multispectral imagery for individual tree crown analysis. Canadian Journal of Remote Sensing, 295: 633-649. doi: http://dx.doi.org/10.5589/ m03-024. Leckie D.G., Gougeon F.A., Tinis S., Nelson T., Burnett C.N., Paradine D. (2005) Automated tree recognition in old growth conifer stands with high resolution digital imagery. Remote Sensing of Environment, 94: 311-326. doi: http://dx.doi.org/10.1016/j. rse.2004.10.011. Lisein J., Michez A., Claessens H., Lejeune P. (2015) - Discrimination of Deciduous Tree Species from Time Series of Unmanned Aerial System Imagery. PLoS ONE, 10 (11): e0141006. doi: http://dx.doi.org/10.1371/journal.pone.0141006. Lukeš P., Rautiainen M., Manninen T., Stenberg P., Mõttus M. (2014) - Geographical gradients in boreal forest albedo and structure in Finland. Remote Sensing of Environment, 152: 526-535. doi: http://dx.doi.org/10.1016/j.rse.2014.06.023. Maltamo M., Packalén P. (2014) - Species-specific management inventory in Finland. In: Maltamo M., Næsset E., Vauhkonen J. (Eds.), Forestry applications of airborne laser scanning- concepts and case studies, Managing Forest Ecosystems, 27: 241-252. doi: http://dx.doi.org/10.1007/978-94-017-8663-8_12. Manninen T., Stenberg P. (2009) - Simulation of the effect of snow covered forest floor on the total forest albedo. Agricultural and Forest Meteorology, 149 (2): 303-319. doi: http://dx.doi.org/10.1016/j.agrformet.2008.08.016. Manninen T., Korhonen L., Voipio P., Lahtinen P., Stenberg P. (2009) - Leaf area index (LAI) estimation of boreal forest using wide optics airborne winter photos. Remote Sensing, 4: 1380-1394. doi: http://dx.doi.org/10.3390/rs1041380. Manninen T., Korhonen L., Voipio P., Lahtinen P., Stenberg P. (2012) - Airborne estimation of boreal forest LAI in winter conditions: a test using summer and winter ground truth. IEEE Transactions on Geoscience and Remote Sensing, 50 (1): 68-74. doi: http://dx.doi. org/10.1109/TGRS.2011.2173939. Manninen T., Roujean J.-L. (2014) - Snortex, snow reflectance transition experiment. Finnish Meteorological Institute, Reports, 2014 (7) 68 p. Meyer P., Staenz K., Itten K.I. (1996) - Semi-automated procedures for tree species identification in high spatial resolution data from digitized colour infrared aerial photography. ISPRS Journal of Photogrammetry and Remote Sensing, 51: 5-16. doi: http://dx.doi.org/10.1016/0924-2716(96)00003-2. Michez A., Piégay H., Lisein J., Claessens H., Lejeune P. (2016) - Mapping of riparian invasive species with supervised classification of Unmanned Aerial System (UAS) imagery. International Journal of Applied Earth Observation and Geoinformation, 44: 88-94. doi: http://dx.doi.org/10.1016/j.jag.2015.06.014. 257
Kuzmin et al.
Automatic tree species recognition from aerial images
Ni W., Woodcock C.E. (2000) - Effect of canopy structure and the presence of snow on the albedo of boreal conifer forests. Journal of Geophysical Research Atmospheres, 105: 11879-11888. doi: http://dx.doi.org/10.1029/1999JD901158. Packalén P., Suvanto A., Maltamo M. (2009) - A two stage method to estimate speciesspecific growing stock. Photogrammetric Engineering and Remote Sensing, 75 (12): 1451-1460. doi: http://dx.doi.org/10.14358/PERS.75.12.1451. Pouliot D.A., King D.J., Bell F.W., Pitt D.G. (2002) - Automated tree crown detection and delineation in high-resolution digital camera imagery of coniferous forest regeneration. Remote Sensing of Environment, 82: 322- 334. doi: http://dx.doi.org/10.1016/S00344257(02)00050-0. Puliti S., Ørka H.O., Gobakken T., Næsset E. (2015) - Inventory of Small Forest Areas Using an Unmanned Aerial System. Remote Sensing, 7: 9632-9654. doi: http://dx.doi. org/ 10.3390/rs70809632. Puttonen E., Litkey P., Hyyppä J. (2010) - Individual tree species classification by illuminated-shaded area separation. Remote Sensing, 2: 19-35. doi: http://dx.doi.org/ 10.3390/rs2010019. R Core Team (2013) - R: A language and environment for statistical computing. R Foundation for Statistical Computing, Vienna, Austria. Available online at: http:// www.R-project.org/. Roujean J.-L., Manninen T., Sukuvaara T., Peltoniemi J., Kaasalainen S., Hautecoeur O., Lahtinen P., Riihelä A., Siljamo N., Lötjönen M., Karjalainen T., Kontu A., Suokanerva H., Aulamo O., Lemmetyinen J., Suomalainen J., Hakala T., Kaartinen H., Thölix L., Meinander O., Karhu J. (2010) - SNORTEX: Remote sensing measurement of snowmelt in European boreal forest. iLEAPS Newslett, 9: 56-58. Singh M., Evans D., Tan B.S., Nin C.S. (2015) - Mapping and Characterizing Selected Canopy Tree Species at the Angkor World Heritage Site in Cambodia Using Aerial Data. PLoS ONE, 10 (4): e0121558. doi: http://dx.doi.org/10.1371/journal.pone.0121558. Tuominen S., Pitkänen J., Balazs A., Korhonen K.T., Hyvönen P., Muinonen E. (2014) NFI plots as complementary reference data in forest inventory based on airborne laser scanning and aerial photography in Finland. Silva Fennica, 48: 1-20. doi: http://dx.doi. org/10.14214/sf.983. Vauhkonen J. Ørka H.O., Holmgren J., Dalponte M., Heinzel J., Koch B. (2014) - Tree species recognition based on airborne laser scanning and complementary data sources. In: Maltamo M., Næsset E., Vauhkonen J. (Eds.), Forestry applications of airborne laser scanning- concepts and case studies. Managing Forest Ecosystems, 27. doi: http:// dx.doi.org/10.1007/978-94-017-8663-8_7. Venables W.N., Ripley B.D. (2002) - Modern Applied Statistics with S-PLUS. Statistics and Computing, Springer. doi: http://dx.doi.org/10.1007/978-0-387-21706-2. Villikka M., Packalén P., Maltamo M. (2012) - The suitability of leaf-off airborne laser scanner data in an area-based forest inventory of coniferous and deciduous trees. Silva Fennica, 46: 99-110. doi: http://dx.doi.org/10.14214/sf.68. Voss M., Sugumaran R. (2008) - Seasonal effect on tree species classification in an urban environment using hyperspectral data, LiDAR, and an object-oriented approach. Sensors, 8: 3020-3036. doi: http://dx.doi.org/10.3390/s8053020. Wang L. (2010) - A multi-scale approach for delineating individual tree crowns with very 258
European Journal of Remote Sensing - 2016, 49: 239-259
high resolution imagery. Photogrammetric Engineering and Remote Sensing, 76 (4): 371-378. doi: http://dx.doi.org/10.14358/PERS.76.4.371. Warner T.A., Lee J.Y., McGraw J.B. (1999) - Delineation and identification of individual trees in the eastern deciduous forest. Proceedings of the international forum: Automated interpretation of high spatial resolution digital imagery for forestry, Canadian Forest Service Pacific Forestry Centre Victoria, British Columbia, pp. 81-91. Waser L.T., Ginzler C., Kuechler M., Baltsavias E., Hurni L. (2011) - Semi-automatic classification of tree species in different forest ecosystems by spectral and geometric variables derived from Airborne Digital Sensor (ADS40) and RC30 data. Remote Sensing of Environment, 115: 76-85. doi: http://dx.doi.org/10.1016/j.rse.2010.08.006. White J.C., Wulder M.A., Vastaranta M., Coops N.C., Pitt D., Woods M. (2013) - The Utility of Image-Based Point Clouds for Forest Inventory: A Comparison with Airborne Laser Scanning. Forests, 4: 518-536. doi: http://dx.doi.org/10.3390/f4030518. © 2016 by the authors; licensee Italian Society of Remote Sensing (AIT). This article is an open access article distributed under the terms and conditions of the Creative Commons Attribution license (http://creativecommons.org/licenses/by/4.0/).
259