Progress In Electromagnetics Research B, Vol. 30, 157–175, 2011
AUTOMATIC THRESHOLD SELECTION IN OS-CFAR RADAR DETECTION USING INFORMATION THEORETIC CRITERIA B. Magaz1, * , A. Belouchrani1 , and M. Hamadouche2 1 Electronics
Department, Ecole Nationale Polytechnique, Algiers,
Algeria 2 Department
of Physics, University of Boumerdes, Boumerdes, Algeria
Abstract—This paper proposes a new approach for efficiently determining the unwanted interfering samples in the reference window, for the ordered statistics constant false alarm rate detector, based on the application of the information theoretic criteria principle. The proposed processor termed as Forward Automatic Order Selection Ordered Statistics Detector (FAOSOSD) does not require any prior information about the number of interfering targets. The proposed design aims to improve the Ordered Statistics Constant False Alarm Rate detector performance under severe interference situations. The number of interfering targets is obtained by minimizing the information theoretic criteria. Simulation results that illustrate the performance of the proposed method versus the classical OS-CFAR, the AND-CFAR and the OR-CFAR detectors are presented and discussed. 1. INTRODUCTION Radar is an electromagnetic system that detects, locates, and recognizes target objects. Radar transmits electromagnetic signal and then receives echoes from target objects to get their location or other information. The received signal is frequently corrupted by noise and clutter. The disturbances may cause serious performance issues with radar systems by concluding these signals as targets [1]. To make a right censoring decision, the receiver is desired to achieve a constant false alarm rate (CFAR) and a maximum probability of target detection. Modern radars usually detect targets by comparing with adaptive thresholds based on a CFAR processor. In this processor, Received 25 December 2010, Accepted 4 May 2011, Scheduled 10 May 2011 * Corresponding author: Boualem Magaz (
[email protected]).
158
Magaz, Belouchrani, and Hamadouche
the threshold is determined dynamically based on the local background noise/clutter power. The CFAR detectors have been widely used in radar signal processing applications to detect the targets from noisy background. In [2], the authors list more than 90 papers about CFAR detection in several radar situations. The signal returns from radar targets are usually buried in thermal noise and clutter. Target detection is commonly performed by comparing radar returns to an adaptive threshold such that a constant false alarm rate (CFAR) is maintained [3]. The threshold in a CFAR detector is set on a cell by cell basis according to the estimated noise/clutter power, which is determined by processing a group of reference cells surrounding the cell under investigation. For example, the cell-averaging CA-CFAR processor adaptively sets the threshold by estimating the mean level in a window of N range cells. The detection performance of the CA-CFAR processor is optimum in a homogeneous background [20, 23] when the reference cells contain independent and identically distributed (i.i.d) observations governed by an exponential distribution. In practice, the environment is usually non-homogeneous due to the presence of multiple targets and/or clutter edges in the reference window. However, there is a significant decrease in performance when the assumption of homogeneous environment is not met [3]. Modifications of the CA-CFAR schemes (such as greatest of CFAR and smallest of CFAR [4]) have been proposed to improve the original CA-CFAR performance for regions with either clutter transitions or multi-targets. The order statistics (OS) detectors have been known to yield a good performance as long as the non-homogeneous background and outlying returns are properly discarded. The OS-CFAR scheme is suitable to alleviate these problems above to some degree. Its performance in a multiple target environment is clearly superior [5]. The OS-CFAR processor exhibits some loss of detection power in homogenous background compared with the CA-CFAR processor. For complex environment such as anti-collision radars, where the environment changes abruptly, these conventional detectors cannot detect targets properly. However, most of the works in the literature consider some type of censoring based on a priori knowledge [6–8] and some approaches based on automatic censoring of unwanted cells have been proposed in the literature [9, 10]. In this paper, we consider the problem of automatic determination of the unknown number of interfering targets using the Information Theoretic Criteria principle. The main motivation behind the development of such automatic detection of the number of interfering
Progress In Electromagnetics Research B, Vol. 30, 2011
159
targets is the degradation of the OS-CFAR performance when the number of interfering targets exceeds a known integer threshold. This is to reduce the CFAR loss and improve the detection probability of the OS-CFAR processor. The proposed processor is referred to as Forward Automatic Order Selection Ordered Statistics Detector (FAOSOSD). The paper is organized as follow. In Section 2, we formulate the problem and introduce the limitation of the OS-CFAR processor in severe multitargets radar situations. In Section 3, we describe the proposed detector structure. In Section 4, we present the interfering targets number estimation approach. In Section 5, we show the simulation results that demonstrate the improved performance of the proposed detector with regard to the classical OS-CFAR, the ORCFAR and the AND-CFAR detectors. Finally, in Section 6 we present the conclusion. 2. PROBLEM FORMULATION In a radar system, it is needed to determine the power threshold from which any return can be considered a target. In most radar detectors, the threshold is set in order to reach a required probability of false alarm rate. In natural environment, unwanted clutter and interference sources change spatially and temporally. In this situation, an adaptive threshold should be employed, where the threshold level is changed to maintain a constant probability of false alarm. This method is known as constant false alarm rate (CFAR) detection [3]. A typical CFAR detector is shown in Figure 1. The input signals are set serially in a shift register. The content
Figure 1. The bloc diagram of a typical CFAR detector.
160
Magaz, Belouchrani, and Hamadouche
of the cells surrounding the cell under test (X0 ) are processed by a CFAR processor to get the adaptive threshold. The cell under test is declared as a target if its value exceeds the threshold. The early CFAR detector called cell-averaging CFAR (CA-CFAR) was proposed by Finn and Johnson in [11]. In this detector, the adaptive threshold is the arithmetic mean of its reference cells. Many CFAR algorithms are developed to meet different situations namely in a transition in the clutter power distribution [12, 13] and the presence of interfering targets [5, 6, 8, 14, 15, 21, 22, 24] which refer to targets present in the reference window cells. When the number of interfering targets exceeds the supposed one, the developed detectors exhibit a serious performance degradation. The bloc diagram of the OS-CFAR detector is presented in Figure 2.
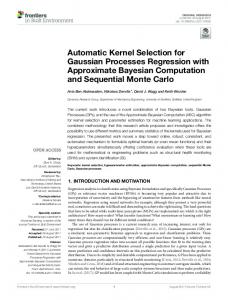
Figure 2. The bloc diagram of the OS-CFAR algorithm. The adaptive threshold of OS-CFAR processors is formally defined in terms of ranked samples of reference cells. To reduce the CFAR loss and improve the detection probability of OS-CFAR processors, the largest sample of ranked cells, involved in the computation of detection threshold, can be properly selected when the exact number of interfering targets is accurately determined. In Figure 3, we consider radar signal detection using the classical OS-CFAR detector with a sliding reference window size, N = 16, a threshold sample order, K = 3N 4 = 12 which is known to be the optimum value [5] and a probability of false alarm, Pf a = 10−5 , in presence of two clusters. The first one contains three targets (cells 14, 15 and 16), while the second contains seven targets (from cell 45 to 52) with different signal to noise ratios. The application of the OS-CFAR
Progress In Electromagnetics Research B, Vol. 30, 2011 OS CFAR Detection Threshold P
fa
161
5
= 10 et N = 16
35 OS CFAR Threshold Input Signal
30
Power (dB)
25
20
15
10
5
0
0
10
20
30 Range samples
40
50
60
Figure 3. The OS-CFAR detector limitation in severe multi-targets situation. detector permits the detection of all the targets of the first cluster, while all the targets of the second cluster are missed. We observe also that the target at cell 41 is masked by the power of the second cluster targets. This situation presents a limitation for the OS-CFAR detection when the number of interfering targets forming the group exceeds the supposed number. The performance degradation of the OS-CFAR detector in this kind of situation is due to the fact that if the number of interfering targets exceeds a known integer threshold which is defined in [5] to be (N − K); the threshold estimate considers the sample corresponding to an interfering target which has an important power compared to that of the noise. The detection threshold will be higher and invokes a masking effect of the target in the cell under test. Therefore, our proposed method has an attractive feature by adding to the available OS-CFAR detector the potential to determine efficiently the unwanted interfering samples in the reference window, which may cause a poor probability of detection. Some combinations of the CA-CFAR and the OS-CFAR detectors are proposed in the literature [16]. We take as examples the ANDCFAR and the OR-CFAR detectors. The corresponding bloc diagram is shown in Figure 4. T1 , T2 and Z1 , Z2 represent the scale factors, to maintain a given constant false alarm rate, and the threshold estimates for the CA-CFAR and the OS-CFAR detectors respectively. The final decision is made according to the binary fusing rule “OR”
162
Figure 4. detectors.
Magaz, Belouchrani, and Hamadouche
The bloc diagram of the OR-CFAR and AND-CFAR
or “AND”. It is shown that these detectors have better detection probabilities than OS-CFAR in special situations under different false alarm probabilities [16]. The performance of the proposed detector are also compared with these detectors in presence of interfering targets. 3. THE PROPOSED DETECTOR The bloc diagram of the proposed detector is depicted in Figure 5. The radar echo is received and the square law detected range samples are sent to a window register of length N + 1, the statistic Z is obtained from the noise power formed by processing the contents of N reference cells surrounding the cell under test (CUT). The radar outputs Xi : i = 0, 1, . . . , XN are stored in a tapped delay line. The cell with the subscript 0 is the cell under test, where it contains the signal which should be detected as a target or not. The last N surrounding cells are the auxiliary cells used to construct the CFAR threshold. In this paper, it is assumed that the random variables of the reference window are independent and identically distributed (iid) and are governed by an exponential distribution with probability density function (pdf): 1 x f (x) = e− λ , x ≥ 0 (1) λ and the distribution function (df): x
F (x) = 1 − e− λ ,
x≥0
(2)
Progress In Electromagnetics Research B, Vol. 30, 2011
163
Figure 5. The bloc diagram of the FAOSOSD detector. Under the null hypothesis H0 of no target in the cell under test, λ is the total background noise power, which is denoted by µ. Under hypothesis H1 in presence of a target, λ is λ = µ(1 + S), where S is the average signal to noise ratio (SNR) of the target. We assume that a Swerling I mode for the radar returns from the target and Gaussian statistics for the noise. Therefore, for the cell under test, the value of λ is λ = µ, under hypothesis H0 and λ = µ(1 + S), under hypothesis H1 . The assumption of an exponential distribution is justified for the square law detector in the case of normally distributed noise in the video range. The proposed detector referred to as Forward Automatic Order Selection Ordered Statistics Detector (FAOSOSD), consists of five fundamental steps. These steps are performed dynamically by using a suitable set of ranked cells to estimate the unknown background level and set the adaptive threshold accordingly. This detector does not require any prior information about the clutter parameters nor the number of interfering targets. The procedure first ranks the outputs of all reference range cells in ascending order according to their magnitudes as follows:
164
Magaz, Belouchrani, and Hamadouche
Step 1 : Sorting the samples of the reference window; X(1) ≤ X(2) ≤ . . . ≤ X(k) ≤ . . . ≤ X(N )
(3)
Step 2 : Computing the corresponding information theoretic criteria for the sorted window; Step 3 : Estimating the optimal order for the OS-CFAR detector Kopt ; Step 4 : Selecting the corresponding scale factor and computing the threshold level. T Z = T X(Kopt ) (4) Step 5 : The cell under test is compared with the derived threshold and a decision is made according to the tests: H1 : X0 ≥ T X(Kopt )
(5)
H0 : X0 < T X(Kopt )
(6)
Hypothesis H1 denotes the presence of target in the test cell, while H0 denotes there is no target. In the FAOSOSD detector, the threshold multiplier T is defined according to the estimated number of interfering targets. Note that in case when the estimated number exceeds 3N 4 or less than N2 , we keep the classical OS-CFAR threshold for k = 3N 4 or N k = 2 respectively. The proposed detector requires the estimation of the interfering targets number to set the corresponding threshold. The scale factor is selected with respect to the estimated interfering targets number from a pre-organized lookup table. The proposed algorithm consists of detecting the corrupted reference cells and adjusting the OSCFAR detector parameters to minimize the CFAR loss. Both steps are performed dynamically by using a suitable set of ranked cells to estimate the unknown background level and set the adaptive thresholds accordingly. The effectiveness of the FAOSOSD algorithm is assessed by computing, using Monte Carlo simulations. The obtained performances are compared to the classical OS-CFAR, the AND-CFAR and the OR-CFAR detectors. 4. INTERFERING TARGETS NUMBER ESTIMATION The proposed approach proceeds as follow. First, we sort the reference window samples in increasing order. Then, we apply the information theoretic criteria, ITC(k), for each sample. We determine the minimum of the ITC and the corresponding sample order. The obtained order
Progress In Electromagnetics Research B, Vol. 30, 2011
165
represents the estimated number of interfering targets. The ITC is defined as [17–19]: µ ¶ G(λk+1 , . . . , λN ) + 2k(2N − k) (7) AIC(k) = −2(N − k)N ln A(λk+1 , . . . , λN ) for Akaike, AIC, criteria, and ¶ µ G(λk+1 , . . . , λN ) 1 MDL(k) = −(N −k)N ln + k(2N −k) ln(N ) (8) A(λk+1 , . . . , λN ) 2 for the minimum description length, MDL, criterion. Where λ1 ≥ λ2 . . . ≥ λN denote in our case the samples of the reference window† , N the number of samples, and G and A denote respectively, the geometric and the arithmetic means of their arguments. The k order of the OS-CFAR detector is taken to be the value of k ∈ {0, 1, . . . , N − 1} for which either AIC(k) or MDL(k) is minimized. In this paper, we are interested in the MDL criterion. This approach allows to perform an automatic detection of the interfering target groups. We present the simulation results that illustrate the performance of the proposed method applied to the OS-CFAR detector in multi-target situations. Several scenarios are conducted to show the effectiveness of the proposed method, we present herein just two significant examples. In the first one, illustrated in Figure 6, we considered a reference window of 32 cells with the presence of five interfering targets at cell numbers 17, 18, 19, 20 and 24 with equal Interference to Noise Ratio, INR = 20 dB as shown in Figure 6(a). Observing the gradual decrease of the ordered samples in Figure 6(b) it is clear that the separation of the five largest samples from the smallest ones is an easy task. In Figure 6(c), we present the Information Theoretic Criteria, ITC, variation. We observe a minimum at cell number 27 which separates the two regions of noise and interfering targets. The number of interfering targets is determined as the value for which the ITC criterion is minimized. The position of this minimum, Kopt , indicates the first interfering target order in the ordered reference window. The above (N − Kopt + 1) cells correspond to interfering targets. In the second example, shown in Figure 7, we considered the same reference window size, and the number of interfering targets is increased to eight, and we have decreased the INR to 7 dB to have a small gap between the noise and target samples. We observe in †
Note that these samples are positive values since they come from the square law detector.
166
Magaz, Belouchrani, and Hamadouche
SdB
20 10 0
0
5
10
15 20 Range Samples
25
30
35
25
30
35
25
30
35
(a) Received Samples WdB
20 10 0
0
5
10
15 20 Range Samples
(b) Ranked Samples ITC(k)
1 0.5 0
0
5
10
15 20 Int. Estimated Rank k
(c) Estimated Interference Rank
Figure 6. Interference samples number estimation in presence of five interfering targets with INR = 15 dB.
SdB
20 10 0
0
5
10
15 20 Range Samples
25
30
35
25
30
35
25
30
35
(a) Received Samples WdB
20 10 0
0
5
10
15 20 Range Samples
(b) Ranked Samples ITC(k)
1 0.5 0
0
5
10
15 20 Int. Estimated Rank k
(c) Estimated Interference Rank
Figure 7. Interference samples number estimation in presence of eight interfering targets with INR = 7 dB.
Progress In Electromagnetics Research B, Vol. 30, 2011
167
Figure 7, that the ITC estimates eight as the number of interfering targets. For the OS-CFAR order selection, we use the N −(Kopt +1) ordered sample to prevent the use of an interfering target sample to compute the threshold. This technique reduces the effect of target masking when the number of interfering targets exceeds the supposed limit. 5. RESULTS AND DISCUSSIONS In this section, we evaluate the performance of the proposed algorithm in different interfering target situations. The simulated data are generated according to an exponential i.i.d random variables for the reference window samples. For targets, the corresponding data consider the signal to noise ratio, SNR, for the cell under test and the corresponding interference to noise ratio, INR, for the interfering targets samples. This model is known for its property of coming close to reality [5]. We consider the detection thresholds of the classical OS-CFAR detector for K = 12 and the FAOSOSD for Pf a = 10−5 and N = 16. We present three interfering target situations. In Figure 8, we consider three separated targets at range cells 2, 14 and 41. Both the OS-CFAR and the FAOSOSD detect the three targets and the corresponding threshold levels are close to each other. Thresholds Levels 25 Radar signal OS-CFAR FAOSOSD
Power (dB)
20
15
10
5
0
0
10
20
30 40 Range cell number
50
60
Figure 8. CFAR thresholds in presence of three separated targets, Pf a = 10−5 , N = 16 and K = 12.
168
Magaz, Belouchrani, and Hamadouche
In Figure 9, we present a radar signal in presence of two separated targets and a group of four targets (less than or equals to (N − K)). The separated targets present at cells 2 and 14 and the group of targets centered at cell 50 are easily detected by the two detectors. Thresholds Levels 25 Radar signal OS-CFAR FAOSOSD
Power (dB)
20
15
10
5
0
0
10
20
30 40 Range cell number
50
60
Figure 9. CFAR thresholds in presence of two separated targets and a group of four interfering targets, Pf a = 10−5 , N = 16 and K = 12. Thresholds Levels 35 Radar signal OS-CFAR FAOSOSD
30
Power (dB)
25
20
15
10
5
0
0
10
20
30 40 Range cell number
50
60
Figure 10. CFAR thresholds in presence of a group of eight interfering targets, and five interfering signals, Pf a = 10−5 , N = 16 and K = 12.
Progress In Electromagnetics Research B, Vol. 30, 2011
169
In Figure 10, we observe that the group of targets are not detected by the classical OS-CFAR detector because the number of interfering targets exceeds four, for K = 12 and N = 16, while the FAOSOSD detects the eight targets present in the group by reducing the threshold sample order accordingly to the obtained estimated interfering targets number. Similarly, the FAOSOSD detects all the five targets present between cell range 10 and 20, while the OS-CFAR misses the target with the lower SNR present at cell range 11. The missed target is masked by the interfering signals present in the reference window. Other scenarios have been conducted in several interfering target situations. 5.1. Detection Performance A total number of 104 independent trials were used to obtain the estimates of the detection probability. Note that the Interference to noise ratio, INR, is taken equal to signal to noise ratio, SNR, in all the simulations. The obtained results show that the FAOSOSD has a much better performance than the classical OS-CFAR, in terms of detecting groups of close targets or targets masked by interfering signals. As the number of interfering targets present in the reference window increases, the detection performance of the OS-CFAR processor decreases, while the detection probability of the FAOSOSD is relatively maintained, as shown in Figure 12. The probabilities of detection of the OS-CFAR detector, K = 12, and the FAOSOSD, K = Kopt , are obtained by Monte Carlo simulations in presence of eight interfering targets. We notice the performance degradation of the OS-CFAR because the number of interfering targets exceeds the supposed one (four in this special case). For example, to achieve a probability of detection of 0.6, the OS-CFAR detector requires additional signal to noise ratio of about 12 dB more than the FAOSOSD detector. The performances of the FAOSOSD in severe interference situations are compared also with the AND-CFAR and OR-CFAR detectors. The corresponding detection probabilities are plotted in Figure 12. It can be seen that the FAOSOSD yields the best detection of all the three detectors. The AND-CFAR detection performance is the worst among the three CFAR detectors. This is due to the performance degradation of the OS-CFAR detector because the number of the interfering targets exceeds the upper limit which is four in this case, and on the other hand the CA-CFAR detector presents the worst performance in presence of interfering targets. The OR-CFAR detector
170
Magaz, Belouchrani, and Hamadouche
remains subject to the performances of the CA-CFAR and the OSCFAR detectors separately. In order to generalize the obtained results, other simulations have been conducted for different values of the false alarm probability, Pf a , and the size of the reference window, N . Pfa = 0.0001, N = 16, k = 12 1 OS-CFAR AND-CFAR OR-CFAR FAOSOSD
0.9
Detection Probability
0.8 0.7 0.6 0.5 0.4 0.3 0.2 0.1 0
Figure 11. Pf a = 10−4 .
0
5
10
15 SNR (dB)
20
25
30
Detection probabilities for N = 16, K = 12 and Pfa = 1e-005, N = 16, k = 12 1 OS-CFAR AND-CFAR OR-CFAR FAOSOSD
0.9
Detection Probability
0.8 0.7 0.6 0.5 0.4 0.3 0.2 0.1 0
Figure 12. Pf a = 10−5 .
0
5
10
15 SNR (dB)
20
25
30
Detection probabilities for N = 16, K = 12 and
Progress In Electromagnetics Research B, Vol. 30, 2011
171
Pfa = 1e-006, N = 16, k = 12 1 OS-CFAR AND-CFAR OR-CFAR FAOSOSD
0.9
Detection Probability
0.8 0.7 0.6 0.5 0.4 0.3 0.2 0.1 0
Figure 13. Pf a = 10−6 .
0
5
10
15 SNR (dB)
20
25
30
Detection probabilities for N = 16, K = 12 and
Figures 11, 12 and 13 show the detection probabilities of the FAOSOSD, the OS-CFAR, the AND-CFAR and the OR-CFAR detectors for different values of the false alarm rate, Pf a = 10−4 , Pf a = 10−5 and Pf a = 10−6 , respectively, in presence of eight interfering targets, for N = 16 and K = 12. It can be seen that when the false alarm probability increases the detection probability increases and the FAOSOSD detector is again the best among all CFAR schemes. Notice that the OS-CFAR and the OR-CFAR detectors have the same performance because of the significant detection loss of the CA-CFAR detector in severe interference situations (presence of eight interfering targets), hence the OR-CFAR selects the OS-CFAR in such environment conditions. Figure 14 shows the detection probabilities of the FAOSOSD, the OS-CFAR, the AND-CFAR and the OR-CFAR detectors for Pf a = 10−5 and K = 3N 4 different values of N , N = 24 (Figure 14(a)) and N = 32 (Figure 14(b)), in presence of eight interfering targets. It is noted that higher values of N yield better detection probabilities and the FAOSOSD detector has always the better performance. 5.2. False Alarm Regulation In this subsection, we present the effects of the interfering targets in the reference window on the false alarm control of the proposed detector.
172
Magaz, Belouchrani, and Hamadouche
(a)
(b)
Figure 14. Detection probabilities for Pf a = 10−5 , K = N = 24. (b) N = 32.
3N 4 .
(a)
The number of interfering targets in these simulations, Ni , is chosen to be equal to N − K + 1. The results are obtained by Monte Carlo experimentations using a total of 106 independent trials for the false alarm performance assessment for different reference window sizes. In each case we consider a desired Pf a = 10−5 and Ni = N − K + 1. Figure 15 shows the effective false alarm performance of the proposed detector in presence of N − K + 1 interfering targets for different INR values. It can be seen that the effective Pf a exhibits a slight
Progress In Electromagnetics Research B, Vol. 30, 2011
173
-5 -5.5 -6 Effective Pfa (log10)
N = 16 N = 24
-6.5
N = 32 N = 48
-7
N = 64
-7.5 -8 -8.5 -9
0
5
10
15
20
25
30
Interference to Noise Ratio, INR, dB
Figure 15. Effect of the INR on the effective Pf a of the FAOSOSD detector in presence of N − K + 1 interfering targets: Desired Pf a = 10−5 , N = 16, 24, 32, 48 and 64. fluctuations relatively to the desired one for high values of N and low INRs. So, according to these results, we can conclude that the effective false alarm rate of the proposed detector is relatively maintained close to the desired one for large reference window size. 6. CONCLUSION A new approach to the detection of the number of interfering target samples in the CFAR reference window has been presented. The approach is based on the application of the information theoretic criteria principle to improve radar detection under severe interference situations. Unlike the conventional detection hypothesis test based approach, the new processor referred to as Forward Automatic Order Selection Ordered Statistics Detector (FAOSOSD) does not require any prior information about the number of interfering targets. The number of interfering samples is determined merely by minimizing the ITC. The obtained number is exploited to determine the optimal sample order to establish accordingly the detection threshold level. The detection problem addressed in this paper is a part of a more complex radar detection system. It should be pointed out that the obtained simulation results based on synthetic data show that the FAOSOSD processor has a much better performance than the classical OS-CFAR, the AND-CFAR and the OR-CFAR detectors in severe interference radar situations.
174
Magaz, Belouchrani, and Hamadouche
REFERENCES 1. Skolnik, M. I., Introduction to Radar Systems, 3rd edition, McGraw-Hill Book Company Wiley-Interscience, USA, 2001. 2. Gini, F., A. Farina, and M. Greco, “Selected list of references on radar signal processing,” IEEE Transactions on Aerospace and Electronic Systems, Vol. 29, No. 1, 329–360, Jan. 2001. 3. Skolnik, M. I., Radar Handbook, 3rd edition, McGraw-Hill, USA, 2008. 4. Liu, N. N., J. Li, and Y. Cui, “A new detection algorithm based on CFAR for radar image with homogeneous background,” Progress In Electromagnetics Research C, Vol. 15, 13–22, 2010. 5. Habib, M. A., M. Barkat, B. Aissa, and T. A. Denidni, “CA-CFAR detection performance of radar targets embedded in “non centred Chi-2 Gamma” clutter,” Progress In Electromagnetics Research, Vol. 88, 135–148, 2008. 6. Barkat, M., Signal Detection and Estimation, 2nd edition, Artech House, Norwood, MA, 2005. 7. Rohling, H., “Radar CFAR thresholding in clutter and multiple target situations,” IEEE Transactions on Aerospace and Electronic Systems, Vol. 19, 608–621, Jul. 1983. 8. Rickard, J. T. and M. Dillard, “Adaptive detection algorithms for multiple target situations,” IEEE Transactions on Aerospace and Electronic Systems, Vol. 13, No. 4, 338–343, Jul. 1977. 9. Barkat, M., S. D.Himonas, and P. K. Varshney, “CFAR detection for multiple target situations,” IEE Proceedings, Vol. 136, No. 5, 1989. 10. El Mashade, M. B., S. D. Himonas, and P. K. Varshney, “Analysis of the censored-mean level CFAR processor in multiple target and uniform clutter,” IEE Proceedings Radar, Sonar and Navigation, Vol. 142, No. 5, 259–266, 1995. 11. Himonas, S. D. and M. Barkat, “Automatic censored CFAR detection for nonhomogeneous envirments,” IEEE Transactions on Aerospace and Electronic Systems, Vol. 28, No. 1, 286–304, Jan. 1992. 12. Farrouki, A. and M. Barkat, “Automatic censoring CFAR detector based on ordered data variability for nonhomogeneous envirenments,” IEE Proc., Radar, Sonar, Navig., Vol. 152, No. 1, Feb. 2005. 13. Finn, H. M. and R. S. Johnson, “Adaptive detection mode with threshold control as a function of spatially sampled clutter level
Progress In Electromagnetics Research B, Vol. 30, 2011
14.
15. 16.
17. 18. 19. 20.
21. 22. 23. 24.
175
estimates,” RCA Review, Vol. 29, 414–464, Sep. 1968. Hansen, V. G. and J. H. Sawyers, “Detectability loss due to greatest of selection in a cell-averaging CFAR,” IEEE Transactions on Aerospace and Electronic Systems, Vol. 16, 115– 118, Jan. 1980. Trunk, G. V., “Range resolution of targets using automatic detection,” IEEE Transactions on Aerospace and Electronic Systems, Vol. 14, No. 5, 750–755, Sep. 1978. Khalighi, M. A. and G. M. Bastani, “Adaptive CFAR processor for nonhomogeneous environments,” IEEE Transactions on Aerospace and Electronic Systems, Vol. 36, No. 3, 889–897, Jul. 2000. Gandhi, P. P. and A. Kassam, “Analysis of CFAR processors in nonhomogenous background,” IEEE Transactions on Aerospace and Electronic Systems, Vol. 24, No. 4, 427–445, Jul. 1988. Qu, Y. and C. K. Nemai, “Novel CFAR detection,” Third International conference on Electrical and Computer Engineering, ICECE 2004, Daka, Bangladash, Dec. 28–30, 2004. El Mashade, M. B., “Analysis of CFAR detection of fluctuating targets,” Progress In Electromagnetics Research C, Vol. 2, 65–94, 2008. Xue, W. and X.-W. Sun, “Multiple targets detection method based on binary hough transform and adaptive time-frequency filtering,” Progress In Electromagnetics Research, Vol. 74, 309– 317, 2007. El Mashade, M. B., “Performance analysis of OS structure of CFAR detectors in fluctuating target environments,” Progress In Electromagnetics Research C, Vol. 2, 127–158, 2008. Grunwald, P. D., I. J. Myung, and M. A. Pitt, Advances in Minimum Description Length Theory and Applications, The MIT Press, Cambridge, Massachusetts, London, England, 2005. Wax, M. and T. Kailath, “Detection of signals by information theoritic criteria,” IEEE Transactions on Acoustics, Speech, and Signal Processing, Vol. 33, No. 2, Apr. 1985. Magaz, B., A. Belouchrani, and M. Hamadouche, “Automatic order selection for OS-CFAR detection improvement under severe interference situations using information theoretic criteria,” IEEE Transactions on Aerospace and Electronic Systems, Proc. International Radar Conference, Bordeaux, France, Oct. 2009.