Sep 23, 2011 - Autonomous quality assurance and troubleshooting. Ronald F. DuPlainab, Nicole M. Radziwilla, Amy L. Sheltona. aNational Radio Astronomy ...
Autonomous quality assurance and troubleshooting Ronald F. DuPlainab, Nicole M. Radziwilla, Amy L. Sheltona a National Radio Astronomy Observatory, P.O. Box 2, Green Bank, WV 24944 USA b University of Cincinnati, 2600 Clifton Avenue, Cincinnati, OH 45221 USA ABSTRACT To improve operational availability (the proportion of time that a telescope is able to accomplish what a visiting observer wants at the time the observation is scheduled), response time to faults must be minimized. One way this can be accomplished is by characterizing the relationships and interdependencies between components in a control system, developing algorithms to identify the root cause of a problem, and capturing expert knowledge of a system to simplify the process of troubleshooting. Results from a prototype development are explained, along with deployment issues. Implications for the future, such as effective knowledge representation and management, and learning processes which integrate autonomous and interactive components, are discussed. Keywords: expert systems, data quality, troubleshooting, rules engine, autonomous (autonomic) computing
1. INTRODUCTION Efficient operation of a complex, dynamic system like a radio telescope requires rapid identification of and recovery from system failures and an efficient means of evaluating the quality of data from observations. Each hour of observing on a radio telescope costs thousands of dollars, therefore it is important to ensure that the hardware and software are in good shape for observations. However, the nature of research presents a major challenge to this goal. Research pushes the limits of the telescope, making it very difficult to monitor the ongoing health of the system and the quality of its data. The Robert C. Byrd Green Bank Telescope (GBT) at the National Radio Astronomy Observatory (NRAO) in Green Bank, W.Va., is a highly dynamic system. An observer can configure the GBT in thousands of different modes, and the telescope continuously receives new systems and features. The emerging quality program in Green Bank seeks to assure that, regardless of how the GBT is configured, the telescope has proper “fitness for use,”1 such that any astronomer who receives approved telescope time can expect the returned data to be accurate, consistent, and free of excessive noise, resulting in a product that fulfills the scientific purpose of observation. The goal of the quality program is to capture these expectations and assure that they are met. At a research facility like the NRAO, “the data product is the primary reason for the existence of the production facility.”2 As such, the quality program in Green Bank has worked on a software quality diagnostics application over the past two years that shifts the focus from the traditional approach of troubleshooting devices to diagnosing the quality of data and its analysis. Several prototyping exercises are now underway to help understand not only what quality systems can and cannot do for telescope operations but also how to build them. The results of these exercises will provide greater understanding of the quality needs and challenges of Green Bank observations, but in order to sustain ongoing commitment to this goal, the quality program needs strong evidence of its value for the Green Bank facility. Quality assurance (QA) is an investment. It costs time and money to implement QA practices, develop or install tools, and learn how to use the tools and interpret QA results to ensure that software services and products meet the needs of users. Empirical evidence on the efficacy of the QA process can be used to determine whether quality practices are costeffective, yield the anticipated reductions in operating costs, and ultimately whether they contribute to user satisfaction. Without these supporting facts, it can be difficult to justify a dedicated investment in quality, particularly for scientific facilities with tightly stretched budgets. Currently, an experiment is underway to produce empirical evidence that an autonomous quality assurance program improves the operational availability of the GBT.
Advanced Software and Control for Astronomy, edited by Hilton Lewis, Alan Bridger, Proceedings of SPIE Vol. 6274, 62740O, (2006) · 0277-786X/06/$15 · doi: 10.1117/12.670470
Proc. of SPIE Vol. 6274 62740O-1 Downloaded from SPIE Digital Library on 23 Sep 2011 to 66.165.46.178. Terms of Use: http://spiedl.org/terms
2. BACKGROUND When working with telescope quality assurance, it is essential to be familiar with the nature of quality issues in telescope operations and how intelligent systems would be able to address them. 2.1. Quality issues in telescope operations To optimize scientific return from telescopes, operations must be able to simultaneously recover quickly from failures and understand the integrity of the observations that are produced. As a result, it is important to ensure that the hardware and software powering a telescope are in good shape for observations. This suggests that quality of telescope operations can be defined by operational availability - the visiting observer being able to satisfy their scientific intent (what they need) at the time the observation is executed (when they need it). This implies that there is a strong coupling between data quality assurance and effective scheduling. Software will not produce high quality output if the input data does not match the level of quality that is expected by the programs. Along these same lines, it is not appropriate to attribute problems to the software when the input data are of insufficient quality. This can result in wasted effort spent troubleshooting software which is performing exactly as intended. Detailed error checks in each software application would require substantial programming effort. This is not a maintainable design; however, if quality checks are performed centrally, each software system will have consistent quality information available to it, ensuring that decisions within the software can be made consistently as well.3 Furthermore, information about the quality of a dataset must be archived alongside raw data and science data. A researcher in the future using datasets mined from the Virtual Observatoryi must have a basis to choose between competing datasets, particularly if the same astronomical objects are observed in similar ways. Using data quality objectives as decision criteria remains a problem for active research. 2.2. Quality improvement through intelligent systems Intelligent systems are described by many labels, including autonomic computing (autonomous systems), expert systems, pervasive computing, and ubiquitous computing. Within each category, being able to discover information about an application’s environment and immediately apply that information to decisions is the shared focus. This challenge requires context awareness that is often expressed by human thinking, but rarely by machines.4 Autonomic systems are self-aware and self-managing, that is, they monitor their environment and adapt to changes. In order to achieve the most advanced levels of software maturity using the Capability Maturity Model (CMM), or project management maturity using the Organizational Project Management Maturity Model (OPM3), autonomous concepts are prerequisite.5 In autonomic computing, these systems are applications which can be software-only, hardware-only, or a combination thereof. An example might be a financial transaction processing system that automatically adds new processors whenever the load surpasses an upper limit. Expert systems seek to recognize logical patterns and imitate human reasoning, a characteristic which is not necessarily shared by an autonomic system. Pervasive computing and ubiquitous computing are essentially synonyms, embodying the concept of an always-on network where diverse applications can acquire information for decision support in realtime. Autonomous computing integrates all of these concepts, and seeks to increase responsiveness to the availability of new information, so that applications can quickly integrate and use new information. This provides the basis for using autonomic systems in quality assurance processes for telescope operations. What has not been explored (for either astronomical systems or computing in general) is the concept that adaptive human intervention, when managed by an application, can simulate a fully autonomic system. The goal of the present investigation is to develop a prototype and evaluate the utility of a system for distributed management of data quality knowledge. i
www.us-vo.org
Proc. of SPIE Vol. 6274 62740O-2 Downloaded from SPIE Digital Library on 23 Sep 2011 to 66.165.46.178. Terms of Use: http://spiedl.org/terms
3. QUALITY CATEGORIES When assessing the quality of radio astronomy data, it is important to understand the dimensions of the problem. Of course, the instrument itself must be functional, but device diagnostics do not entirely capture the essence of an observing session. An ideal observation has a full and clear measurement of a source, and the data produced by the observation is consistent, complete, and free of noise. In 2005, four categories were identified for observational quality, as follows:3 1. 2. 3. 4.
Observing system quality captures how well the instrument performs according to its design. From the underlying computer network to electronics to the software constructs, the observing system must be fully operational in order to produce proper data. Observability describes whether a given observation is able to take place. Even fully operational devices cannot produce proper data if the source is not able to be observed, because the source is not in view, the weather is adverse, etc. Raw data quality assesses the completeness of the data produced by the instrument and verifies that it is consistent not only across data points, but according to the standards for the mode of observation. An assessment of newly collected data provides input to software which monitors, analyzes, and reduces the data. Derived data quality identifies how well the data matches an observer’s intent. Beyond the basic requirements, a researcher matches the data with scientific criteria, such as “rms of spectra, signal to noise, and dynamic range.”3
Hanuschik et al. of the European Southern Observatory presented a similar classification in 2002, but it is expanded here and includes a category for observability.6 Prototyping exercises on observing system and raw data quality are discussed throughout the following sections.
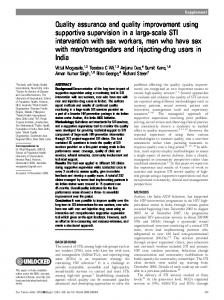
4. CONTROL SYSTEM DIAGNOSTICS The telescope has a long list of components, and when a component fails to perform properly, it may corrupt the researcher's data produced by the instrument. In the event of failure of a given device, several symptoms may result and troubleshooting can be very difficult. Control system diagnostics focuses on how to identify the root cause of failures, because one problem can often cause many symptoms. A prototype for control system diagnostics emerged by first characterizing interdependencies, then identifying an algorithm for root cause analysis, and finally attempting to capture expert knowledge for a software diagnostics application for the control system. 4.1. Characterizing interdependencies To identify the root cause of failures, it is necessary to understand the dependencies within the data production process. For the GBT, a two-dimensional matrix identifies how devices are interrelated and what problems may occur, providing a method of identifying the root cause of failures. The vertical axis of the matrix contains a list of devices in order of dependency, from the most fundamental network server to the high level software constructs. The construction of this axis involved identifying all of the components which support the telescope operations, then “building" these components from the bottom up, listing the devices using a topological sort technique, such that a component was only added to the axis after all of its dependencies were listed. The horizontal axis contains the questions that a troubleshooter would answer when working with these devices. In a fashion similar to the vertical axis, construction of the horizontal axis involved identifying each step of troubleshooting a device, then verifying the proper order by identifying the dependencies. A troubleshooter might step through these questions as follows: Is it on? Is it responding? Is it communicating? Is it initialized? Is it healthy? Does it have expected values? Are there any device-specific issues? Is it reporting any errors?
Proc. of SPIE Vol. 6274 62740O-3 Downloaded from SPIE Digital Library on 23 Sep 2011 to 66.165.46.178. Terms of Use: http://spiedl.org/terms
81
itreporting ant
nrr5r5
Is
Are there any denice specitic scene?
ithealthy?
Does ithane nepnstnd colLies?
Is
it in initialized?
CottSnUtICtting?
itresponding? Is
I
'
° &
°X
•
Ct>
U fl U
>
i'
a
8
Ut
CtO
H I
nO oct
ii Hr I
Ut
Is iten?
An example of a dependency matrix is shown in Figure 1.
Figure 1: A simple dependency matrix
Each cell of the matrix holds the result of the test of the given component; for simplicity, this result can be a pass/fail metric. As an example, the most fundamental problem could be a main network server that is off, such that networked computers would be unable to work; the least fundamental problem could be a high-level, informational software application (upon which no other control software is dependent) that is reporting an error. 4.2. An algorithm for root cause analysis The dependency matrix provides for a simple algorithm that theoretically shows the root cause of failures. The elements along the axes are ordered fundamentally, by dependency, so the error that occurs closest to the origin of the two axes of the matrix is likely the root cause, and this error should receive attention first.ii
f ( x, y ) = x 2 + y 2
(1)
In this equation, x and y are the horizontal and vertical coordinates of a cell on the matrix, respectively. Equation 1 is applied to each cell of the matrix, and the cell with the lowest value is likely the root cause of the failure. In certain situations, there are cases where an element is listed on the vertical axis but is not in use or of concern with current observations, so the algorithm must be adjusted accordingly.
f ( x, y , u ) = x 2 + ( y − u ) 2
(2)
In equation 2, u is the number of elements along the vertical axis from 0 to y that are determined not to be in use. Therefore, the first question to ask is “Is it in use?” which adds a new column to the horizontal axis. This is essential where different backend data processing computers could be used, where a backend not in use should not be considered in troubleshooting. ii
assuming no hazards, disasters, power outages, etc.
Proc. of SPIE Vol. 6274 62740O-4 Downloaded from SPIE Digital Library on 23 Sep 2011 to 66.165.46.178. Terms of Use: http://spiedl.org/terms
Even with only a theoretical matrix, a troubleshooter could identify the root cause of the system by stepping through each cell of the matrix manually. When many faults occur, this metric will help identify what issue to correct first, as it may be causing other faults. 4.3. Capturing expert knowledge When designing the queries that report the answer to each cell of the matrix, it was essential to meet with the expert of each device in question. The software must know what the experts know in order to answer each question (along the horizontal axis) for each device (along the vertical axis). The process was very time consuming and presented a design that was not maintainable, given that the telescope is a dynamic system. In order to determine the quality of observations, the diagnostics tool must capture the expert knowledge and be as dynamic as the instrument itself. 4.4. Lessons learned A prototype software application implemented the dependency matrix, and it was apparent that filling in every cell of the matrix was very time-consuming, as some of the cells involved complicated queries. The prototype ran for a few months, and although it did not cover all of the prescribed tests, it did produce a significant portion of the diagnostics. Since many problems that occur in the observing system show symptoms of lost communication between devices, having a diagnostics application that polled the components of the system provided clear returns; even a basic prototype pointed to many failures. While the prototype application could not stand alone, it acted as an aid to troubleshooting, especially when offsite, because it gave important information to troubleshooting. The prototype produced three important results: 1. 2. 3.
The dependency matrix provides a solid framework for device diagnostics, and problems can be detected with even just a few columns to indicate that devices are on and responding. An exhaustive diagnostics system is not feasible. Devices, standards, and behaviors change, so to maintain a diagnostics application to keep up with a dynamic system would be difficult and costly. Though the application clearly and accurately portrayed the root cause of the problem at the control system level, it did not answer the question of how to fix the problem, nor did it answer the question of whether the observing session was correctly carrying out the observer's intent, i.e. it didn’t indicate that the newly collected data provided what the user wanted.
Limited knowledge of the physical structure is available to the software without feedback from the device in question, i.e. exhaustive control system diagnostics might not be feasible without sensors and monitors built into the instrument. Software cannot collect information about the physical structure of the instrument without feedback sensors; hence, software might not be able to indicate the root cause of a physical failure. The prototype ultimately indicated that control system diagnostics cannot produce a complete picture of operational availability in a maintainable, cost-effective manner.
5. RAW DATA QUALITY In addition to control system diagnostics, it is necessary to assess data quality in order to verify that the observation fulfills the researcher’s intent. Operations should focus initially on raw data quality when introducing a quality program at a data production facility, since the data is central to operations. Data quality management can represent knowledge
Proc. of SPIE Vol. 6274 62740O-5 Downloaded from SPIE Digital Library on 23 Sep 2011 to 66.165.46.178. Terms of Use: http://spiedl.org/terms
and standards through rules, which can be used to assess the quality of newly collected data by means of an expert system.2, 7 5.1. Start with raw data After working with a software prototype to automatically assess the health of the observing system, it became clear that a quality program is more effective when starting with raw data diagnostics, based on the following observations: Device diagnostics require the knowledge of each of the experts at the institution, whereas the expectations on the data product are understood by all. These expectations provide a common ground for all of the stakeholders. It is over-ambitious to provide an exhaustive diagnostic test on a sophisticated system like the GBT. As stated in the previous section, the device diagnostics can only go so far if there is little knowledge of the physical structure of the instrument. If the raw data produced by an instrument matches the prescribed expectations, then it is likely that the instrument is performing well enough for successful operations. Control system diagnostics cannot provide strong implications of data quality, but data assessment can imply proper function of the instrument. 5.2. Knowledge representation and management Knowledge management is the process of assessing the value of a data product and adjusting policies to maximize its value. At a data production facility like the NRAO, knowledge representation formulates the standards for assessing the data product’s value. Rules which declare some truth about the system can formally represent expert knowledge. Over time, these rules can be added, modified, and removed in order to reflect changes in the system or develop a better means for evaluation. Instead of spending time manually troubleshooting the system after a failure, an expert can represent expectations and standards, i.e. knowledge, through rules and interpret the test results of these rules.7 5.3. Universal approach to data quality A rule structure can treat derived data and raw data in the same manner. With a rule-based approach, generalized rules assess the raw data, and user-specified rules assess the derived data quality. The distinction is as follows: assertions relevant to all observations and all of observations of the current mode provide a means to assess raw data quality; assertions that are specific to a given observer’s intent provide a means to assess the derived data quality. Therefore, a rule-based approach could be considered a universal approach to data quality assessment.
6. RULE-BASED APPROACH All businesses and institutions have operations which are defined through rules and policies. For a data production facility, these rules dictate the optimal output of data products. Business rules as data quality rules can test the data product, and an expert system centered about these rules provides an autonomous quality assurance tool for troubleshooting the data production process.7 The emerging quality program in Green Bank is developing a prototype rule-based expert system for autonomous quality assurance, and an experiment is underway for testing the value of quality assurance within telescope operations.
Proc. of SPIE Vol. 6274 62740O-6 Downloaded from SPIE Digital Library on 23 Sep 2011 to 66.165.46.178. Terms of Use: http://spiedl.org/terms
6.1. Business rules A business rule states, in natural language, a policy or standard for operation. A rule consists of an action and a condition, where the action is executed based on the result of testing. Some examples of business rules:
All visiting observers are assigned a support scientist. If winds exceed 40 mph, put the telescope in stow position. No observer should use the telescope for more than 24 consecutive hours.
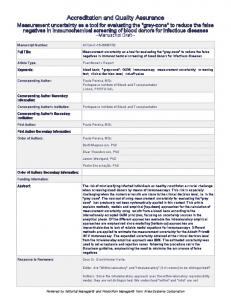
When applied to data production, business rules specify and assert the properties that should be contained in a data set. In this case, business rules can also be called data quality rules. 6.2. Data quality rules Through exploratory analysis, researchers often compare raw data to some standard or expected result; when formalized, this is a data quality rule. Business rules as data quality rules can have pre- and post-conditions associated with them. Preconditions must be met before the rule can be applied; these are often verified by other rules. Post-conditions hold true if the rule is not broken, and effectively answer the question, "why should the user want to know that this rule is followed?" Data quality rules can also have conditional assertions, actions that should take place if the rule is satisfied. Use cases can be used to quickly generate data quality rules. Consider the following example. An observer might state, "The output data should show the availability of data from Device X." This case is broken down into following components: Pre-condition: An observing session has been completed or is in progress. Rule: Metadata should be stored for each observing session, specifying what physical output is expected. Rule: All data specified in this listing should be present in a data set. Rule: If device X is used, the corresponding data file should be present. Conditional Assertion: If any file is missing, send a message to the appropriate parties to inform them of the issue and start troubleshooting Post-condition: All required output is present. Rules like those shown here populate a database and are processed by a rules engine to automatically investigate data quality. 6.3. The autonomous data quality assessment tool A rules engine executes knowledge representation. The class diagram in Figure 2 shows the architecture for the rulebased expert system currently under development using the Python programming language. The software application design is general in order to support any data processing pipeline with any data format, but several classes are custom built for the GBT. These classes are children of the generic classes, with methods and attributes rewritten where necessary. This approach isolates the custom-built modules, which for GBT support its data sources, observing procedures, and the FITS data format.
Proc. of SPIE Vol. 6274 62740O-7 Downloaded from SPIE Digital Library on 23 Sep 2011 to 66.165.46.178. Terms of Use: http://spiedl.org/terms
In addition to the core application, there is a report viewer, report annotator, and rules interface. The report viewer and report annotator packages interface with the Report class, which translates a data quality report from an eXtensible Markup Language (XML) file to a Python data structure, and vice versa. The viewer allows a user to see the contents of a data quality report in a user-friendly format; the annotator allows a user to append comments to a report. The rules interface interacts with a database containing rules appropriate for the observational data, and this interface allows a user to add and modify rules that govern the target qualities of a data set. The rules interface interacts with these rules through the GBTRulesKeeper (a child of the RulesKeeper class), which connects to the database using the RulesDatabaseConnection (a child of the DatabaseConnection class). The application design supports online and offline execution in order to assess data quality as the telescope creates new data or while a researcher works with an existing data set, respectively. In both cases, a trigger is sent to the GBTDirector (a child of the Director class) to start execution of the application. The GBTDirector generates dictionaries containing the metadata of the project and the criteria for the rules which should evaluate the data, and passes these dictionaries to the GBTMixer (a child of the Mixer class)iii for conditioning before the rules engine processes them. The GBTMixer is central to the operations of the application. It first passes the metadata and criteria dictionaries to the GBTInformationBroker (a child of the InformationBroker class), which takes care of the legwork of retrieving the rules and their target data. The GBTInformationBroker uses the GBTRulesKeeper to retrieve the rules and the GBTQuery (a child of the Query class) to retrieve the target data. The GBTQuery has an interface with the abstract DataAccessor class, which provides a unified process of making a query to telescope data, whether the location of the data is a database, a FITS file, a flat file, or the GBT itself. The GBTQuery is not concerned with the source of the data; it handles all sources in the same way. Additionally, the Query class does not directly incorporate knowledge of the rule format; it uses the RulesInterpreter class to parse each rule and to understand which data is needed for the rule. Once the GBTMixer receives the rules and target data from the GBTInformationBroker, it prepares the information for the rules engine for processing, which executes the rules in a loop as follows:7 1. 2. 3. 4. 5.
Evaluate the knowledge base. Identify which rules are ready to be fired. Choose a rule to execute. Fire this rule (by evaluating its condition given the knowledge base).iv Repeat at step 1 until all rules have been fired.
The rules engine has a wrapper class (RulesEngine) which provides a simple interface to the GBTMixer, and the GBTMixer receives the results from the rules engine upon completion. The GBTMixer passes these results to the Reporter. The Reporter generates an XML file through the Report class. This XML file holds the data quality information which aids troubleshooting and helps dictate proper handling of the data set. The data quality report is in the XML format to allow human-readability, simple browser viewing, and thorough markup with simple tags. The application’s design focuses on flexibility and modularity so that it is easy to maintain and is portable for use at any data production facility, with custom classes inserted where the application needs specific interfaces to the data pipeline. 6.4. The data quality experiment If knowledge of raw data quality can make operations more efficient, quantified improvement provides a criterion by which the costs of implementing the technology to support a data quality assessment system is evaluated against the value it is expected to deliver. It is still unknown how to fully measure operational availability, because it is a metric tied not only to physical parameters, like system performance and equipment availability, but also the schedule, driven by management policy. However, telescope operators directly track the mean time to repair (MTTR) because they log when the system becomes non-functional and when the system returns to a useful state. This experiment will determine how a rule-based autonomous quality assessment tool would reduce the MTTR of failures. iii iv
The GBTMixer only differs from the Mixer because it interacts with the GBTInformationBroker (and not the InformationBroker). Rules which have conditional assertions have those actions executed in this step, when appropriate.
Proc. of SPIE Vol. 6274 62740O-8 Downloaded from SPIE Digital Library on 23 Sep 2011 to 66.165.46.178. Terms of Use: http://spiedl.org/terms
Director
-rthtSt:Iist
..
I
-GennCr,bO:dict + lireRuleso bool
Program Name
+Processraqs:
+ GetRuleSeto list + SetRu leSet(ru leSet list) void + GenerateMetadatao void
t
C BTDi recta — projecti D stn — session: stflnq
- time datetime — scans: stflnq — GenerateCriteriaQ dict
+ GetProjectlDo stnnq + SetProjectl D(projectl D strinq) void + GetSessiono strinq + SetSession(session strinq) void + GetTimeo datetime + SetTime(time datetime) void + GetScanso strinq + SetScans(subscans strinq) void + GenerateMetadataQ void Reporter I + GenerateReport(metadata : dict, content : string) : bool
'1'
RulesEngine
— Condition(rules list, data: list): tuple
I + ProcessRules(rules : list, data: list): string
— Report(content : stri nq) : bool
+ GetMetadatao : dict + SetMetadata(metadata : dict) : void + GetCriteriao : dict + SetCriteria(criteria : dict) : void
Rulesinterpreter + Parse(rule : string): list of dicts
Query - metadata : dict - interpreter : Rulesinterpreter + GetData(ru le : stri nq) : list
— rk : Rules Keeper
- query : Query - metadata : dict - criteria : dict — GetRuleso : list
— filename: strinq
-dx Document + ConvertPromxMLo : dict + ConvertToxML(dictionary : dict) : bool + ReadLinesO : list + Wnte(c ontent : stri nq) : bool
+ GetMetadatao : dict + SetMetadata(metadata : dict) : void + Parse(ru le : string) : list of d icts
t
+ RetneveQ : tuple + GetMetadatao : dict + SetMetadata(metadata : dict) : void + GetCriteriao : dict + SetCriteria(criteria :dict) : void
CBTQuery
fl -
DateAccessor
'1'
'i'
P
Ru lesKeeper - db : DatabaseConnection + GetRuleUd : int) : strinq + GetRules(criteria : dict) : list + AddRule(rule : dict) : bool + AddRules(rules : list) : bool
Reponnotator
I
Ruleslntethce
- CreateDateAccessor(TBD ') DateAccessor
— GetData(ru les : Ii st) : Ii st
+ WnteLi nes (content : stri nq) : bool + ParseDocument(stream ') void + WriteDocument(stream : ') : void + ValidateQ : bool
ReponViewer
'I'
- metadata dict - cfltefla dict -RetrieveQ tuple + RunO void
nth rmatio n Broker
Report
_P
i
Third Party Engine
Mixer - enqine RulesEnqine
CR1' nfo rmatio n Broker
- rk GBrRulesKeeper -query GBTQuery
CsTRulesKeeper I - db : RulesDatabaseconnection
t
- db : DatabaseConnection
Fi leAccesso — path: strinq
— query: strinq
+ GetDatao : string
+ GetDatao : list
Databaseco n nectio n
- lock Lock I RulesDatahaseconnection L
- db : Connection — cnn: cursor — host : strinq
- db_name : strinq - user: strinq — pas sword stn
FITS Ac C e s so
- devices dict — query: strinq + GetData(q uery : string) : Res u ItSet
+ Query(quer : strinq) : list - Connecto : void
C BTAccesso - qc : GrailClient - device : strinq — attribute : strinq
- isParameter bool + GetDataQ : string
'1' '1' ResuitSet Connection
- Locko bool - Unlocko : bool - ExecuteQueryo : list
4. Figure 2: Class diagram for the rule-based expert system currently under development
Proc. of SPIE Vol. 6274 62740O-9 Downloaded from SPIE Digital Library on 23 Sep 2011 to 66.165.46.178. Terms of Use: http://spiedl.org/terms
CraiICIient
6.4.1. Goals The goals of this experiment are to:
Identify lost time due to data production problems over the past year; correlate this with downtime values independently collected by operators. Extend the one-year historical sample to three years to see if the trend has decreased. Set a quality goal to minimize the average time to detect a data quality related assignable cause of failures, if this approach is profitable.
6.4.2. Hypothesis This experiment will test the following hypotheses:
Null hypothesis: The mean time to repair failures is independent of automated raw data quality information. Test hypothesis: The mean time to repair failures is dependent upon automated raw data quality information.
The inclusion of the word "automated" is important in the hypothesis. Raw data quality information is currently accessed manually; a rule-based expert system is automating this process. The null hypothesis is likely perceived as true to some degree at institutions where no automated raw data assessment tool is in place, such that the development of such a tool receives no priority and in some cases is not even considered. In this experiment, we aim to reject the null hypothesis and therefore accept the test hypothesis. Once the test hypothesis is accepted, we aim to show that the MTTR is different through a reduction given automated raw data quality information. 6.4.3. Plan 1. 2.
3. 4. 5.
Put an autonomous quality assessment tool into place based on a rule-based expert system. Generate two populations of the MTTR of failures affecting data sets, by extracting the MTTR from the operator logs. a. Collect the first population from a year’s worth of historical data prior to the autonomous tool. b. Collect the second population from a year’s worth of data after the release of the data quality tool. Analyze these populations to determine if the mean significantly differs between them. Determine if the MTTR is reduced as a result of autonomous data quality assurance. Continue collecting data for analysis for up to three years.
6.5. Discussion A collection of two populations and a comparison of the means of time to repair will give empirical evidence as to whether the automated data quality tool reduces the time to detect failures. This evidence will help judge the value of data quality and help achieve buy-in for implementing a data quality assessment tool. When collecting data, we will collect historical samples from the data archive for the year elapsed before the new tool is released; we will collect future samples in real-time. Hence, the data collection phase of the experiment will take at least one year once the software assessment tool is complete.
Proc. of SPIE Vol. 6274 62740O-10 Downloaded from SPIE Digital Library on 23 Sep 2011 to 66.165.46.178. Terms of Use: http://spiedl.org/terms
7. CONCLUSIONS An effective quality program recognizes that data quality is systemwide, identifies the value of data quality assessment, and incorporates the key components of quality management. 7.1. Data quality is systemwide The control system must be functioning properly to yield good quality raw data, and knowledge of raw data quality is essential for accurate software behavior. Therefore, data quality is a systemwide issue, and is not limited to just one particular area of the data production process. Systemic management of data quality can yield operational efficiencies through less code, because quality checks occur only once. Centralized quality checks allow faster fixes for bugs, because the quality checks reveal the locations of greatest impact. In many cases, raw data quality simplifies the problem because it can provide inferences of the quality of operations. 7.2. Future work Once the autonomous data quality assessment tool is complete, we will focus on collecting the two populations of data as specified in the experiment above. Once this data is collected, we will be able to provide empirical evidence as to whether an automated raw data quality tool impacted the MTTR of operations. This evidence will provide a criterion for measuring the value of data quality diagnostics and will serve as a litmus test for the effectiveness of implementing a rule-based expert system. 7.3. Lessons learned Data quality is central to quality assurance at a data production facility; this is the most important lesson learned. All stakeholders generally uphold the standards for the data product, and if the data matches these standards, then it is likely that the data fulfills the scientific intention. Quality management is a multi-dimensional program spanning science, software, and operations. Trying to launch a quality management program from just one of these perspectives won't work. Additionally, securing resources for a quality program is difficult without buy-in. The prototyping exercises and the data quality experiment aim to gain support for the quality program at the NRAO. Expert systems apply to other aspects of telescope operations, for example, decision support for dynamic scheduling. A fully autonomic system managed by an application, which accepts adaptive human intervention, can provide information for real-time decisions.
ACKNOWLEDGEMENTS The authors would like to acknowledge Richard Prestage, Assistant Director of the National Radio Astronomy Observatory in charge of Green Bank operations, for providing management support for exploring data quality and related issues at the GBT. Richard has allowed us to research and develop autonomous quality assessment prototype tools and continues to be open to new and innovative project ideas. The National Radio Astronomy Observatory is a facility of the National Science Foundation, operated under cooperative agreement by Associated Universities, Inc.
Proc. of SPIE Vol. 6274 62740O-11 Downloaded from SPIE Digital Library on 23 Sep 2011 to 66.165.46.178. Terms of Use: http://spiedl.org/terms
REFERENCES 1. 2. 3. 4.
5. 6. 7.
J. M. Juran and F. M. Gryna, Juran's Quality Control Handbook, McGraw-Hill, New York, 1988. N. Radziwill, “Foundations for Quality Management of Scientific Data Products,” QMJ, 13, pp. 7-21, 2006. N. M. Radziwill and R. F. DuPlain, “A Framework for Telescope Data Quality Management,” Astronomical Data Analysis Software and Systems XV, ASP Conference Series, Vol. XXX, 2005, C. Gabriel, C. Arviset, D. Ponz and E. Solano, eds. J. A. McCann and M. C. Huebscher, “Evaluation Issues in Autonomic Computing,” International Workshop on Agents and Autonomic Computing and Grid Enabled Virtual Organizations (AAC-GEVO’04), 3rd International Conference on Grid and Cooperative Computing Wuhan, China, 21-24 October 2004. Springer-Verlag Heidelberg, p. 597. C. Fellenstein, On Demand Computing: Technologies and Strategies, Ch. 3, IBM Press, Indianapolis, 2004. R. Hanuschik, J. Smoker, A. Kaufer, R. Palsa, and M. Kiesgen, “Quality Control of VLT FLAMES/GIRAFFE Data.” Proc. SPIE 5493, Optimizing Scientific Return for Astronomy through Information Technologies 2002, 564-573, ed. P. J. Quinn & A. Bridger (Bellingham, WA: SPIE). D. Loshin, Enterprise Knowledge Management: The Data Quality Approach, Morgan Kaufmann, San Francisco, 2001.
Proc. of SPIE Vol. 6274 62740O-12 Downloaded from SPIE Digital Library on 23 Sep 2011 to 66.165.46.178. Terms of Use: http://spiedl.org/terms