International Journal of Electrical Engineering. ISSN 0974-2158 Volume 7, Number 3 (2014), pp. 391-398 © International Research PublicationHouse http://www.irphouse.com
Autonomous Troubleshooting Scheme for Power Quality Monitoring in Distribution Systems B. Prudhvi Anand Senior Engineer (Electrical), L&T Construction, Hyderabad Metro Rail Project E-Mail:-
[email protected]
Abstract Power Quality (PQ) monitoring as an essential tool for improving the quality of service in distribution systems has invited tremendous research from academic and professional communities in the recent past. A monitoring system that takes up essential time to troubleshoot may not be viable in case of critical loads, manufacturing units(especially adjustable speed drives [1]) or stringent contractual agreements between the distribution utility and customer. This paper presents a novel troubleshooting scheme in which the monitoring system consists of data collection units alongside data processing units (DPU) that are implemented in hardware and software. These analyze recorded data dynamically, perform stepwise segregation and correlation as specified by the algorithm through internal communication among various DPUs, and send the results/solutions arrived at, to the Central Server Station GUI thereby improving stored data efficiency and relieving the human operator of having to deal with huge chunks of data in order to troubleshoot a PQ deviation within the system. The advantage of the proposed system is that PQ monitoring is now a dynamic process where the solution is obtained as soon as a deviation is substantiated, against the traditional method of analyzing data for the recorded deviation at a later stage and then starting the troubleshooting process. Keywords:Autonomous, Control, Disturbances, Distribution Interruptions, Monitoring, Power Quality, Troubleshooting.
Systems,
1. INTRODUCTION Power quality (PQ) is a prime concern for distribution utilities as well as the end users for a common reason-to ensure that the respective systems function as they are
Paper code: 14519 - IJEE
392
B. Prudhvi Anand
meantto, efficiently and reliably [2] [3]. Economic feasibility and operational sustenance of power transfer activity are hindered by low PQ. Naturally, PQ monitoring has become indispensable. Advancements in hardware and communication systems complemented the requirements of PQ monitoring for accurate data collection and organization. This paved the way for development of sophisticated data acquisition tools, which can track almost every moment of the power transfer activity. With requisite data at hand, the next step in the monitoring process is that of analysis. This involves transformation of raw data into physical events of significance i.e., deviations from the acceptable PQ limits namely voltage sag/swell, harmonic distortion, interruptions, load imbalance for a three phase system, voltage spikes and other transients etc. The final and most important stage in PQ monitoring process is that of troubleshooting. This is usually the most challenging and time consuming process since it involves correlating various physical events obtained through analysis to find out the source of PQ deviation. This requires a complete understanding of the distribution system under observation. Once the source of the problem is clear, necessary steps/actions can be initiated to nullify the deviation. Thus, PQ monitoring can broadly be composed of three steps [Fig. 1] viz. Data Acquisition, Data Analysis and Troubleshooting. Power Quality Monitoring
Data Acquisition
Data Analysis
Troubleshooting
Fig. 1. PQ Monitoring Sequence The present paper aims at automating the entire process of PQ monitoring, taking advantage of high accuracy data acquisition tools and a piecemeal (stage wise) algorithm for substantiating possible PQ deviations. In case the data acquired proves insufficient for the system to reach a definitive conclusion, the piecemeal algorithm ensures that the human operator need not start the troubleshooting process from scratch. Instead, he can continue from the last stage that the monitoring system reached, eliminating extraneous possibilities and thereby solving the problem in much lesser time than the case in which human operator is left with no assistance. The
Autonomous Troubleshooting Scheme for Power Quality Monitoring in Distribution Systems
393
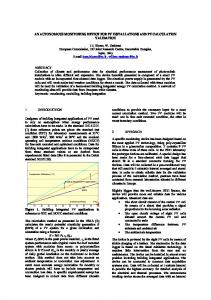
paper’s scope does not include technical intricacies/usage details of data acquisition instrumentation or the communication channels for data transfer since they are already well documented in published research [4] [5] [6] [7] [8]. 2. SYSTEM DESCRIPTION The proposed system consists of three interdependent blocks namely Data Collection Units (DCU), Data Processing Units (DPU), and the Central Server Station GUI (CSS). Data Collection Units Electrical disturbance may originate in the distribution power system, in the installation of the user who is subject to disturbance or in the installation of a nearby user. Hence it is sufficient if Data Collection Units are located near the loads, typically at the service entry point (shown by circles in the figure [Fig. 2] below). These can be factory-made products such as the Fluke 1750, PQM II from GE Digital Energy, Digipact Power Meter etc. or custom built using multifunction metering ICs such as ADE7953 from Analog Devices, MCP39F501 from Microchip etc. to suit PQ monitoring requirement.
Fig. 2. Typical Distribution System
Data Processing Units As the name indicates, DPUs are the actual brains of the system. A DPU consists of two sub-blocks – a software module called the “Analyzing Unit” (AU) and a
394
B. Prudhvi Anand
hardware module called the “Transfer Unit” (TU). For every TU on site, there is a corresponding AU at the Central Server Station. A detailed description of DPU is made in Section 3. Central Server Station GUI This is the interface between human operator at power monitoring station and the troubleshooting system proposed. CSS can be used to give inputs to the DPUs (For e.g. regarding date of installation of feeder, service cable, insulators etc.) and extract outputs from the same (Display relevant data, and suggest possible source of the PQ disturbance). 3. DATA PROCESSING UNIT The DPU interacts with DCU and the CSS. Block diagram of a DPU is shown below [Fig. 3]. DPU
TU
AU
At DCU
At CSS
‘Hardware’
‘Software’
Fig. 3. Block Diagram of DPU A. Transfer Unit The Transfer Unit is an ARM microcontroller based system that is appended to the DCU in order to read data dynamically. The logic embedded in the microcontroller compares raw data with PQ thresholds. In case of a deviation, TU sends the same to its corresponding AU at the Central Server Station. All the TUs are time synchronized. Another major task of a TU is to respond to its AU when it receives a command to send data acquired at a preceding time in order to troubleshoot PQ disturbance elsewhere. This is achieved through a hardware interrupt signal. TU contains a self-sufficient storage space (SD Card / IDE) for recording data. It also has a set of ‘Values’ such as the date of installation of service cable, age of the insulator and number of arc strikethroughs till date, design load value, timings for
Autonomous Troubleshooting Scheme for Power Quality Monitoring in Distribution Systems
395
scheduled power shutdowns etc. All these values can be accessed/edited through the AU. These Values play an important role in the troubleshooting process. For example, in case of a scheduled power cut, the system will still search for a source of power loss, thinking that the power loss was unintentional, possiblysearching for a fault upstream, and wasting away its resources. Same is the case with insulator arc strikethrough number which can be used for scheduling a maintenance or replacement accordingly to maintain PQ. The reason for choosing ARM architecture is that it provides all the necessary interfaces for external data storage, communication channels for data transfer, low power requirement and high frequency of operation. B. Analyzing Unit The Analyzing Unit is a software module implemented on a microprocessor based system. An AU can interact with its TU as well as the other AUs within the CSS. If a PQ deviation is detected at a TU, the data is sent to its corresponding AU and it is the job of its AU to troubleshoot the same. The AU then becomes the INITIATOR AU. When an INITIATOR AU requires data from other portions of the distribution system, it interacts with the AU of that portion which in turn receives data from its TU, ultimately sending data to the INITIATOR AU. There can be several INITIATOR AUs at the same time, since disturbances are bound to happen at many points. It is for this reason that microprocessor based system (with multithreading capabilities) is used. An AU certifies if the deviation received is random or consistent. Further, the AU measures extent of impact of adisturbance. This is a necessary feature to be incorporated. For example, if the starting of a motor in one house results in momentary voltage dip only in that house, the distribution utility has nothing to deal with in such a situation and the PQ monitoring system must not report it as a PQ deviation. The algorithm for entire troubleshooting scheme is described in Section 4. 4. TROUBLESHOOTING ALGORITHM The troubleshooting algorithm [Fig. 4] is stage wise. When an AU receives a PQ disturbance from its TU, the classification of it being an Event or a Transient is done, and specifically, which one among the many that are listed in Table 1 which can be tracked by the proposed scheme.The result is then stored in a dedicated ‘Solution Log’ of the AU to be displayed at the CSS GUI once the process is finished. The
396
B. Prudhvi Anand
Solution Log is self-edited as the troubleshooting process goes stage after stage. At this stage, the location of disturbance is also recorded. TABLE I Events and Transients S. No
Event
Transient
1 2 3
Voltage Sag Voltage Swell Sustained Interruption Harmonic Distortion Load imbalance
Voltage Spike Temporary Interruption
4 5
Identity
Extent Troubleshooting Scheme Source
Map
Human Operator
Fig. 4. Block Diagram of Troubleshooting Scheme An important logic to be implemented here is that of selection. Not all disturbances require attention at the central level of monitoring. Such a scheme, if implemented, would be clogged with large amounts of data, most of which is irrelevant to the performance of the electric system. This is achieved by the next stage – Extent, where inter-AU communication is utilized. This stage essentially gives us the spatial distribution of TUs that detected a PQ disturbance at the time of occurrence of the initiator disturbance - from the point of initiator disturbance to the distribution transformer. The data recorded in previous step is analysed and if the extent or the magnitude of disturbance exceeds a safe predefined threshold, the next stage is evaluated - that of
Autonomous Troubleshooting Scheme for Power Quality Monitoring in Distribution Systems
397
Source, i.e., finding the origin of disturbance. This stage relies on the fact that electrical events occur in a sequence, that there is always an initiator and its impact follows[9]. For example, voltage dip on one phase due to a line to earth insulation fault on overhead line invariably results in line voltages across single phase equipment on other phases, at least momentarily before an upstream protection switchgear acts, where they are captured and certified as relevant data pertaining to the initiator AU. Similarly, overload at a house causes voltage dip at that house but has a lesser impact on other houses connected to same feeder. However, starting currents drawn by large motors have significant impact on other connected loads of the feeder which can be correlated. Similar logic can be applied in case of harmonic distortion also. A transient too has an originator and an impact. Switchgear operation as Source can be correlated with voltage surge preceded or superseded by sustained or temporary interruption depending on whether the fault is isolated by automatic reclosers or not. The set of Values (discussed in 3.A) also play an important role here, mainly in case of surge transients that can be correlated with insulator breakdown as a result of repeated arcing over prolonged periods. Apart from the above described examples, an exhaustive list of possible disturbance sources must be incorporated into the scheme depending on the distribution system to be monitored – be it industrial, residential or commercial. Each have a set of safe thresholds that are required for Stage 2 (Extent) evaluation so that the troubleshooting algorithm works desirably. This however, can be done effectively only after observing the actual electric distribution system to be monitored. If the logic embedded in the processor is unable to specify a definitive Source to a disturbance, the fourth stage – a Distribution map is created with locations of all AUs (along with their data) that received a PQ disturbance at the time the initiator AU received the same. Extraneous data points are eliminated. This stage relies on the experience that an electrical disturbance can never let the system to attain steady state conditions without an intermediate disturbance generation. The intensity of disturbance gradually reduces as the distance from its source increases. As suggested by Ranko et al. [10], discrete ranges of disturbance magnitudes are mapped into respective regions of influence. Hence, in the case when the software failed to work out a solution, the human operator is left with a snapshot of events mapped as regions of influence of the responsible disturbances, which he can correlate with his experience. The logic employed by human operator can be embedded into the software later for improved performance. At the end of the troubleshooting process, the results reached at are displayed on the Central Server Station GUI. The resulting data can be used for statistical, protection and energy analysis for facilitating improved performance of the distribution system [11].
398
B. Prudhvi Anand
5. CONCLUSION In this paper, a novel scheme for troubleshooting power quality issues in distribution systems has been presented. A troubleshooting algorithm that is simple but effective is utilized. At the end of the process, the human operator is left with a definitive solution or with requisite data to obtain the same. An overview of individual functional blocks along with examples of technical reasoning for possible disturbances helps in designing the scheme for any specific distribution system.
6. REFERENCES [1]
[2] [3]
[4]
[5]
[6]
[7]
[8] [9] [10] [11]
M. H. J. Bollen. “Characterisation of voltage sags experienced by three-phase adjustable speed drives”. IEEE Transactions on Power Delivery, vol. 12, October 1997. M. Bollen, Understanding Power Quality Problems: voltage sags and interruptions, IEEE Press, Piscataway NJ, (2000). G. Alonso Orcajo et al.” Voltage sags in industrial systems” Proceedings of International Conference on Renewable Energy and Power Quality. Zaragoza, 2005. Sun Hao, Yuan Huimei& Lu Simei, “A Design of Three-Phase Digital WattHour Power Meter on SOPC Platform”, International Conference on Information Technology and Computer Science, pp: 264, 2009. Li Yujin, GengLiwei&ZhengDeyi,”On remote automatic meter reading system based on GPRS technology”, 29th Chinese Control Conference (CCC), pp: 5731, 2010. Kulkarni, A.S., Welch, K.C. &Harnett, C.K., “A review of electricity monitoring and feedback systems”, Proceedings of IEEE Southeastcon, pp: 321, 2011. Arian, M., Soleimani, V., Abasgholi, B., Modaghegh, H. &Gilani, N.S., “Advanced Metering Infrastructure System Architecture”, Asia-Pacific Power and Energy Engineering Conference (APPEEC), pp: 1, 2011. http://www.openmeter.com S. Herraiz, J. Meléndez, J. Colomer, Marc Vinyoles, J. Sánchez and M. Castro, “Power Quality Monitoring in Distribution Systems”. RankoGoic, Eugen Mudnic, Marko Lovric, “Voltage Dips Influence Zone and Propagationthrough the Industrial Facility”. Christopher J. Melhorn, Mark F. McGranaghan “Interpretation and Analysis of Power Quality Measurements”.