Apr 16, 2010 - cut-off, Ï = 1.25 ± 0.05 and 1/Ïk = 0.725 ± 0.08. The value of Ï is .... with 1/Ïk = 0.7 ± 0.08 for the AM approach, while we .... 0.01 0.1 1 10 100 sk.
Avalanches and clusters in planar crack front propagation Lasse Laurson1 , Stephane Santucci2 , and Stefano Zapperi1,3
arXiv:0911.2380v2 [cond-mat.stat-mech] 16 Apr 2010
2
1 ISI Foundation, Viale S. Severo 65, 10133 Torino, Italy Laboratoire de physique, CNRS UMR 5672, Ecole Normale Sup´erieure de Lyon, 46 All´ee d’Italie, 69364 Lyon Cedex 07, France and 3 IENI-CNR, Via R. Cozzi 53, 20125, Milano, Italy
We study avalanches in a model for a planar crack propagating in a disordered medium. Due to long-range interactions, avalanches are formed by a set of spatially disconnected local clusters, the sizes of which are distributed according to a power law with an exponent τa = 1.5. We derive a scaling relation τa = 2τ − 1 between the local cluster exponent τa and the global avalanche exponent τ . For length scales longer than a cross-over length proportional to the Larkin length, the aspect ratio of the local clusters scales with the roughness exponent of the line model. Our analysis provides an explanation for experimental results on planar crack avalanches in Plexiglas plates, but the results are applicable also to other systems with long-range interactions. PACS numbers: 62.20.mt, 45.70.Ht, 64.60.av
I.
INTRODUCTION
Driven elastic manifolds in disordered media have been used to model a number of physical systems ranging from crack propagation in solids [1–8] to dynamics of magnetic domain walls in ferromagnets [9] and vortices in type-II superconductors [10], and to charge density waves [11]. Such systems exhibit non-equilibrium phase transitions as an external driving force f is varied, so that below the depinning threshold fc the system is pinned by the disorder, while for f > fc the system moves at a finite average velocity. For f close to but above fc , such motion typically occurs as a sequence of avalanches with a broad distribution of sizes. A large class of such systems, including advancing crack fronts in solids [1, 4–8], contact lines in wetting [12], magnetic domain walls with dipolar interactions [9], and plastically deforming crystals [13], is characterized by a long-range interaction kernel. The peculiarity of these systems is that due to the long-range interactions governing the avalanche dynamics, the area swept over by an avalanche is not necessarily simply connected in space as it would be the case if the interactions were only short-ranged. Instead, global avalanches are formed by a set of spatially disconnected local clusters. The propagation of a planar crack confined in a weak plane represents an ideal system to realize experimentally the depinning transition predicted by the crack line model [1–3]. Yet, the first experimental results for the crack front roughness [4, 5] and for the avalanche size distribution [6] disagreed with the theory. The roughness exponent of the crack front was found in the range ζ = 0.55 − 0.6 [4, 5], instead of the theoretical value ζ = 0.39 [14], while the avalanche sizes defined by the waiting time matrix [6], measuring only spatially connected parts of the avalanches, were found experimentally to be power law distributed with an exponent much higher than the value predicted by the long-range line model for avalanches extracted by considering the global velocity signal of the crack front. These earlier claims have been revised recently: by testing a larger range of
length scales it was shown that the roughness exponent would cross over to the theoretical value at sufficiently large scales [15, 16]. Furthermore, in Ref. [7] it was shown that the crack line model can reproduce the avalanche statistics of the experiment, if also the numerical data are analyzed using the waiting time matrix introduced in [6], while a smaller exponent value is obtained when considering avalanches extracted from the global velocity signal of the crack front model. Still, a complete understanding of the origin of the different scaling exponents is lacking. Here we clarify these issues by studying the statistics of global avalanches and their spatially connected parts, the local avalanches (or clusters), for a long range elastic string moving in a disordered medium under quasi-static external driving. Both the avalanche and cluster size distributions are found to exhibit scaling, but with different power law exponents. In particular, by studying the model with a larger range of length scales, we obtain a more accurate description of the scaling behavior, and therefore a better estimate of the related exponents than in previous numerical studies [7]. These numerical results are compared with data from experiments on Plexiglas plates [6], and excellent agreement is found. Moreover, we propose a scaling relation between the power law exponents of the avalanche and cluster size distributions by considering the avalanche break-up process, supported by our numerical results. We finally study the morphology of the local clusters, and find that their aspect ratio scales with the roughness exponent of the line model above a cross-over length proportional to the Larkin length of the crack front. Previous studies [7] using a continuous time version of the crack line model have presumably been sampling the short length scale regime. Thus, our results explain and clarify a number of open issues related in particular to planar crack front propagation, such as the different scaling of global avalanches and local clusters, as well as the connection between roughness and avalanche morphology. However, the implications of our study extend beyond crack front propagation, as the re-
2
a)
b) 128
96
96
64
64
32
32
y
128
0
0 0
c) y
sults can be immediately extended to a number of other systems described by the same model, such as contact line dynamics in wetting [12], and low angle grain boundaries in crystalline solids [17]. Furthermore, a number of other driven systems in which the avalanche dynamics is governed by long range interactions, ranging from domain walls in ferromagnets with dipolar interactions [9] to plastically deforming crystalline solids [13], are expected to obey similar scaling laws. The paper is organized as follows: In the next Section, the simulation model and the methods used to extract the local clusters from the simulations and the experiments are presented. These are then followed by the results of the numerical simulations along with a direct comparison with experimental results from Plexiglas plates in Section III. Section IV finishes the paper with conclusions and discussion.
1024
x
15
1024
2048
x 30 15
0
0 300
x A.
d)
30
0 II.
0
2048
600
0
300
600
x
MODEL AND METHODS
Quasi-static model of crack front propagation
The model of the propagating planar crack front, introduced in Ref. [2], is represented by a vector of integer heights hi , i = 1, . . . , L, with L the system size. Crack propagation is driven by the local stress intensity factor (SIF) √ Ki , which represents the asymptotic prefactor of the 1/ r divergence of the stress field near the crack tip. To model the different contributions of the local SIF Ki acting on a front element i, it is taken to be of the form random Ki = Kielastic + Ki,h + K ext , where i Kielastic = Γ0
L X hj − hi b|j − i|2
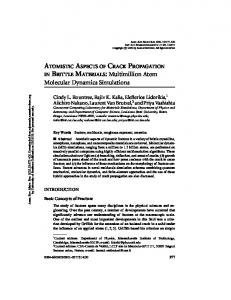
FIG. 1: a) An example of the avalanche map A(x, y), for k = 0.05 and Γ0 = 1, with the area swept over by different avalanches denoted by different shades of gray (time is running from black to white). b) The same data as in a) represented by the velocity matrix V (x, y) = 1/W (x, y) with a zero threshold. The crack front is moving to the positive y direction. Black corresponds to zero velocity, while regions of finite velocity are shown in white. c) An example of a structure of a single avalanche as identified by the AM method. d) The same avalanche as in c) extracted by using the WTM method.
(1)
j6=i
represents the first order variation of the stress intensity factor due to a first-order perturbation of the front position, b is the front segment spacing and Γ0 tunes the random strength of the elastic interactions [1], Ki,h is a timei independent Gaussian random variable of zero mean and unit variance, with random random i = δ(i − j)δ(hi − hj ), Kj,hj hKi,h i
(2)
representing random toughness of the material, and K ext is the contribution of the external load. Notice that the long range kernel in Eq. (1) is identical in many other problems, such as contact lines [12] and low angle grain boundaries [17]. Periodic boundary conditions are imposed. The dynamics is defined in discrete time t by setting vi (t) = hi (t + 1) − hi (t) = θ(Ki ),
(3)
where vi is the local velocity of the front element i, and θ is the Heaviside step function. During a single time step, the front elements with vi > 0 are advanced by a unit step, hi (t + 1) = hi (t) + 1, and new random forces
are generated for those elements. The local forces are then computed again for each element, and the process is repeated until vi = 0 for all i and the avalanche stops. The size s of the avalanche is the total number of elementary moves during such an avalanche. Then the external stress is increased so that exactly one of the elements becomes unstable, and a new avalanche is initiated. While such a discretization of the dynamics neglects the fact that the local velocity of the crack front should be proportional to the local SIF, this is a standard technique employed in models of the depinning transition, going back to the work of Leschhorn [18], and is known to have no influence on the scaling behavior we study here. Moreover, this procedure is essential to be able to drive the system quasi-statically. Such quasi-static driving has the advantage over continuous time models with a finite driving velocity [7] that avalanches and clusters can be defined without ambiguity also for a zero threshold. As the crack front advances, the applied SIF K ext decreases at a rate proportional to the instantaneous average velocity PL v(t) = 1/L i=1 vi (t) of the front, with a proportionality constant k. Thus, the cut-off of the avalanche size distributions is expected to scale with k [9].
3 Methods to extract the local clusters
III. A.
RESULTS
Avalanche and cluster size distributions
10
0 -1
-2
τ
10
s P(s)
To extract the clusters from an avalanche, we use two methods. The first is the avalanche map (AM), based on a two dimensional array A(x, y) such that a unique value is assigned to all points (x, y) over which an avalanche has swept. We then define the local cluster size aAM as the area of spatially connected regions with the same value of A(x, y) (see Fig. 1 a and c). The second approach is the recently proposed waiting time matrix (WTM) W (x, y), defined by the time the interface has spent within a pixel corresponding to the location (x, y) [6, 7]. The local velocity matrix is then given by V (x, y) = 1/W (x, y). Clusters are defined as spatially connected regions of area aW T M within which the local velocity exceeds some threshold value vth (see Fig. 1 b and d). Here we study the model in the quasi-static limit, which allows us to use effectively a zero threshold, by setting the waiting time of the pinned configurations separating avalanches to be much longer than the maximum avalanche duration. When using the WTM approach to record the motion of the crack front during an avalanche, only n − 1 steps are recorded when a line element moves n steps, as both the initial and final pinned configurations are classified as immobile. Thus, the avalanche in Fig. 1 d) is a bit thinner in the y direction as compared to the one in Fig. 1 c), and parts of the avalanche involving motion of a single step forward only are lost completely. However, our results suggest that this does not affect the statistical properties of the clusters. In the case of the discrete line model, another issue is that for soft lines (Γ0 < 0.75), in which the height difference between neighboring segments of the line can be two or more pixels of the WTM, two consecutive avalanches can be recorded as one. In the following we use WTM only for large enough Γ0 . Notice that the AM does not suffer from such problems.
10
-2
10
-3
10
P(s)
B.
10
-4
10
0
-6
10
-8
10
10
k=0.4 k=0.2 k=0.1 k=0.05 k=0.025 k=0.0125 k=0.00625 τ=1.25 0
10
2
s
10
4
P (s) = s−τ fk (s/k −1/σk ),
(4)
with fk (x) a scaling function describing the shape of the cut-off, τ = 1.25 ± 0.05 and 1/σk = 0.725 ± 0.08. The value of τ is in good agreement with results from simulations [7] and unpublished experiments [19]. However, the scaling of the cut-off was not considered in Ref. [7]. Notice that the scaling function fk (x) displays a bump around the cut-off of the distribution [20], and thus the true power law exponent can be seen directly only for
2
10
6
FIG. 2: (color online) The main figure shows the size distributions of the avalanches for Γ0 = 1 and various values of k (open symbols), as well as the size distributions of the avalanches for a fixed k = 0.0125 and various values of Γ0 ranging from Γ0 = 0.4 to Γ0 = 1.0 (filled symbols, with the latter set of distributions displaced vertically for clarity). The solid line is a guide to the eye and corresponds to τ = 1.25. The inset shows a data collapse of the distributions with Γ0 = 1 and various values of k, with τ = 1.25 and 1/σk = 0.725.
s well below the cut-off scale. The exponent values we quote are obtained by optimizing the data collapse of the distributions. To demonstrate the robustness of our results with respect to changing the values of various parameters of the model, we also show the avalanche size distributions for a fixed k but varying Γ0 in Fig. 2 (filled symbols): the distributions turn out to be virtually independent of Γ0 in the range 0.4 ≤ Γ0 ≤ 1.0 considered in Fig. 2. Analogously, the cluster sizes or areas aAM (top panel of Fig. 3) and aW T M (bottom panel of Fig. 3) extracted by the AM and WTM methods, respectively, are both observed to scale according to P (a) = a−τa gk (a/k −1/σk ),
The probability distributions of avalanches and cluster sizes for L = 2048, Γ0 = 1 and various values of k are shown in Figs. 2 and 3, respectively. The sizes s of the avalanches (Fig. 2, open symbols) are distributed according to a power law with a k-dependent cut-off,
1
10 10 1/σ sk k
(5)
but with an exponent τa significantly different from τ , i.e. τaAM = 1.52 ± 0.05 and τaW T M = 1.53 ± 0.05. Thus, the two methods to define the clusters give the same τa exponent within errorbars. In this case the scaling function gk (x) does not exhibit a bump, and the scaling of the distributions extends all the way to the cut-off scale. Also for the cluster size distributions similar results are obtained for different values of Γ0 (not shown). The observed exponent value is somewhat lower than that quoted in Refs. [6, 7] for the WTM approach, but our analysis below indicates that also the data presented in [6, 7] is perfectly consistent with τaW T M ≈ 1.5. This is because in Refs. [6, 7] also the region of the cut-offs of the distributions was included in the fits, thus overestimating the true exponent value. Notice also that the cut-off
4
0
10
-2
10
-1
10
-2
10
-τa/σv
τ
P(a)
10
2
-3
10
10
-6
10
0
-8
10
0
10
1
1
10
k=0.4 k=0.2 k=0.1 k=0.05 k=0.025 k=0.0125 k=0.00625 τa=1.52
-4
2
10 10 1/σ ak k
10
2
10
a
a aP(a)
τ
P(a)
10 10
-2
3
10
-3
10
-2 -3
10
-6
10
-8
10
0
10
1
0
10
1
2
10 10 1/σ ak k
-1
0
10
1
10
10
FIG. 4: (color online) The scaled size distributions of the WTM clusters for various threshold values vth , with τa = 1.5 and 1/σv = 1.8. Filled symbols correspond to the simulations, while open symbols are from an experiment on planar crack propagation in Plexiglas plates [6], with hvi = 11µm/s and a pixel size of 1.7µm2 . The two data collapses (simulations and experiments) have been shifted on top of each other to facilitate comparison.
cut-off in the distribution that scales as −1/σv
10
2
a
10
3
10
P (a) = a−τa gv (a/vth
4
FIG. 3: (color online) Top: The size distributions of the AM clusters for Γ0 = 1 and various values of k. The solid line is a guide to the eye and corresponds to τa = 1.52. The inset shows a data collapse with τa = 1.52 and 1/σk = 0.7. Bottom: The size distributions of the WTM clusters for Γ0 = 1 and various values of k. The solid line is a guide to the eye and corresponds to τa = 1.53. The inset shows a data collapse with τa = 1.53 and 1/σk = 0.8.
of the cluster size distributions scales with k as k −1/σk , with 1/σk = 0.7 ± 0.08 for the AM approach, while we obtain 1/σk = 0.8 ± 0.08 for the WTM. The different 1/σk exponents have the same value within errorbars, and we suspect that the small variation observed might be related to a finite size effect.
B.
-2
10
1/σ avth v
10
k=0.4 k=0.2 k=0.1 k=0.05 k=0.025 k=0.0125 k=0.00625 τa=1.53
vth=0.10 vth=0.08 vth=0.06 vth=0.05 vth=0.04 vth=14 vth=12 vth=10 vth=8 vth=6 vth=4 vth=2 τa=1.5
10
4
-1
10 -4
-2
10
-4
0
10
0
10
10
10
0
P(a)vth
0
a aP(a)
10
10
Comparison with experimental results
In order to compare directly our results to the experiments [6], we study WTM clusters as a function of a finite velocity threshold vth . The threshold introduces a
),
(6)
with τa = 1.53 ± 0.05 and 1/σv = 1.8 ± 0.1, see Fig. 4. There, we compare the simulation results with experimental data on planar crack propagation in Plexiglas plates [6]. Both sets of data can be collapsed by using exponent values τa ≈ 1.5 and 1/σv ≈ 1.8. By shifting the two data collapses on top of each other, we observe perfect agreement between the simulations and the experiment. Notice again that in Refs. [6, 7], the cut-offs of the distributions were included in the power law fits, thus overestimating the true exponent value.
C.
Link between global avalanches and local clusters
To explain these results, we consider the break-up process of an avalanche into a number of clusters. When an avalanche grows by one unit (i.e. when a single element of the line moves forward by one unit), there are three possibilities how this can affect the number N (s) of distinct clusters within an avalanche: i) a new cluster is initiated (N → N + 1), ii) two existing clusters are merged into a single cluster (N → N − 1), or iii) an existing cluster grows by one unit (N → N ). We associate probabilities p1 , p2 and 1−p1 −p2 , respectively, to these events. These probabilities are dynamic variables as they depend on the instantaneous structure of the avalanche. On the average,
5
˜ (s/k −1/σk ) hN (s)i = sα N
(8)
In the present case, the value of the avalanche exponent τ ≈ 1.25 yields τa ≈ 1.5 for the clusters, in good agreement with our numerical and recent experimental results [6, 19]. Notice that Eq. (7) implies that s ∼ a2 holds only for s smaller than the cut-off scale. For larger avalanches one has a ∼ s (as evidenced by the cross-over to a plateau in Fig. 5), consistent with the observation that the cutoffs of the avalanche and cluster size distributions scale with the same exponent 1/σk . Notice also that while deriving Eq. (8) we did not make assumptions about the precise form of the long-range kernel nor the spatial dimension of the system, and we thus expect Eq. (8) to be valid for a wide class of avalanching systems where the avalanche dynamics is governed by long-range interactions. Notice that if the avalanche break-up process is correlated such that hN (s)i ∼ sα with α 6= 1/2, Eq. (8) can be generalized to read τa = (τ − α)/(1 − α). D.
-α
s
k=0.4 k=0.2 k=0.1 k=0.05 k=0.025 k=0.0125 k=0.00625 α=0.47
1
0.1 0.01 0.1
1
10 100 1/σk
1 1
100
s
sk 10000
(7)
˜ (x) a scaling function, α = 0.47 ± 0.05 and σ = with N 0.76 ± 0.08, see Fig. 5 (i.e. the cut-off scales with k again with the same exponent 1/σk ≈ 0.75). Thus, the cluster sizes scale as a ∼ s/hN (s)i, or s ∼ a2 . P (a)da = P (s)ds then implies that P (a) ∼ a−τa , with τa = 2τ − 1.
10
however, p1 = p2 as p1 > p2 would clearly indicate an increase in p2 and a subsequent tendency for p1 to decrease again: When the number of clusters grows, there is less and less space to create more clusters and the probability to merge existing clusters should increase. Similarly, p1 < p2 would imply that sooner or later most of the clusters would have merged, and consequently the probability p2 for further cluster merging decreases. Thus, for large enough avalanches, the number N ≥ 1 of clusters during the growth of an avalanche follows a random walk up to s steps, with a reflective boundary at N = 1 (as each avalanche consists of at least one cluster). Assuming for simplicity that the process is not correlated indicates that for s ≫ 1, hN (s)i ∼ sα , with α = 1/2. Our numerical results confirm this relation, and a scaling form
Cluster morphology and roughness of the crack front
In experiments [6] and simulations [7] it was found that the aspect ratio of the clusters was scaling as ly ∼ lxζ , with ζ ≃ 0.6 and where lx and ly are the linear sizes of the cluster in the x and y directions, respectively. This result is in agreement with the roughness of the crack front measured in early experiments, but disagrees with the known value of the roughness exponent of the crack line model ζ = 0.39 [14, 21]. Moreover, by investigating a larger range of length scales, a recent experimental work on roughness of the crack front has shown a crossover from a roughness exponent of around 0.6 to a lower value
FIG. 5: (color online) The scaling of the average number of clusters within a global avalanche of size s, for various values of k, and Γ0 = 1. The solid line is a power law fit of the form hN (s)i ∼ sα , with α = 0.47. The inset shows a data collapse according to Eq. (7), with α = 0.47 and 1/σk = 0.76.
corresponding to the line model prediction of around 0.39 [15, 16]. This is surprising, since we have just shown that the experimental avalanche statistics is in perfect agreement with the predictions of the model. This puzzle can be resolved, noticing that ζ = 0.39 is expected to hold only for length scales larger than the Larkin length Lc [22], which for our model scales like Lc ∼ Γ20 ξ/R2 , where ξ and R are the correlation length and the amplitude of the disorder (here ξ = R = 1), respectively [17]. Below Lc , the crack line roughness should scale with an exponent ζL = 1/2. In the top panel of Fig. 6 we report the scaling of ly with lx for different values of Γ0 . By rescaling lx by Lc ∼ Γ20 , we observe a crossover for the scaling exponent going from ζL = 0.55 ± 0.05 at small scales to ζ = 0.39 ± 0.03 at large scales. In the top panel of Fig. 6 we also report the scaling of the root mean square height fluctuations h∆h(δ)2 i1/2 (with ∆h(δ) = hi+δ − hi ) of the crack front, expected to scale like h∆h(δ)2 i1/2 ∼ δ ζ . Again, by rescaling δ by Γ20 , we observe a crossover from a small scale regime with ζL = 0.48 ± 0.05 to the large scale value ζ = 0.37 ± 0.03. The bottom panel of Fig. 6 shows that similar conclusion can be made by considering the power spectrum S(q) of the line profile, expected to scale as S(q) ∼ q 2ζ+1 . Rescaling the data by Lc ∼ Γ20 ˜ 2 q), we observe a crossover for according to S(q) = Γ20 S(Γ 0 the scaling exponent going from 2ζL + 1 = 1.96 ± 0.05 for large q to 2ζ + 1 ≈ 1.76 ± 0.04 for small q, in agreement with the analysis of root mean square height fluctuations. We have verified that in the present model, where the crack front is constrained to move along the y direction, there is no multiscaling [23]. Notice that while we observe different crossover scales for the roughness of the line and the scaling of the morphology of the clusters,
l y,
2 1/2
6 ratio is still characterized by the larger ζL ≈ 0.55. It is probably this range of scales that has been investigated in earlier numerical studies [7].
Γ0=2.0 Γ0=1.5 Γ0=1.0 Γ0=0.75 Γ0=0.6 Γ0=0.5 ζ =0.55 L Γ0=0.4
10
ζ=0.39
IV. ζ=0.37
1 ζL=0.48
1
10
100
2
δ/Γ0
lx/Γ0 ,
S(q)/Γ0
S(q)
2
10
6
10
10
Γ0=0.4 Γ0=0.6 Γ0=1.0 Γ0=1.5 Γ0=2.0 2ζ+1=1.76 2ζL+1=1.96
4
2
10
-3
10
-2
10 10 10
6
4 2
10
10
2
1000
2
-1
-2
10
-1
10
q
10
0
0
Γ0 q FIG. 6: (color online) Top: The scaling of the aspect ratio of the local clusters (open symbols) and the root mean square height fluctuations h∆h(δ)2 i1/2 of the line (filled symbols), for k = 0.0125 and different values of Γ0 . For large clusters their aspect ratio scales as ly ∼ lxζ , with ζ = 0.39 ± 0.03 (solid line), while smaller clusters are characterized by ζL ≈ 0.55 (dashed line). Also the roughness of the line, scaling like h∆h(δ)2 i1/2 ∼ δ ζ , exhibits two distinct scaling regimes, with ζL ≈ 0.48 for small scales and ζ = 0.37 ± 0.03 for large scales. Both sets of data have been collapsed by rescaling lx and δ by the Larkin length Lc ∼ Γ20 . Bottom: The power spectra of the line profiles for different values of Γ0 . The main figure shows a collapse of the spectra, according to S(q) = ˜ 20 q), while the inset displays the unscaled power spectra. Γ20 S(Γ The power spectra scale as S(q) ∼ q −(2ζ+1) , with a cross-over separating regimes with 2ζL + 1 ≈ 1.96 for short length scales and 2ζ + 1 ≈ 1.76 for long length scales.
both sets of data scale with the Larkin length Lc , and thus the cross-over length is proportional to Lc in both cases. However, the fact that these two length scales are not the same implies that there is a range of scales for which the roughness of the line appears to scale with the asymptotic exponent ζ ≈ 0.39, while the cluster aspect
CONCLUSIONS
To summarize, we have demonstrated how avalanches are broken into spatially disconnected clusters in systems with long range interactions. Both the avalanches as a whole and their localized parts or clusters exhibit scaling, but with different power law exponents, related by a scaling relation derived from a simple random walk argument for the avalanche break-up process. We also showed that large enough clusters exhibit aspect ratio scaling with an exponent consistent with the roughness exponent of the crack line model [14, 21]. Due to the general nature of both the model considered as well as our arguments, we expect these results to be applicable in a large class of avalanching systems with long range interactions, ranging from crack propagation to contact lines in wetting to domain walls in ferromagnets. Of particular interest here is our explanation of the different scaling exponents observed for global avalanches and local clusters in the crack line model [7], and its potential implications for further studies of avalanche phenomena in systems with long-range interactions. An interesting prospect would be to explore the possibilities to explain the observed acoustic emission exponents in peeling of paper sheets [8] with similar arguments. The observation that the avalanche break-up process in the line model can be described by a simple random walk will be interesting to test in experiments on crack front propagation in Plexiglas plates, but also in other avalanching systems with long range interactions, such as for domain wall dynamics in ferromagnetic thin films [9], as well as for imbibition [24]. An important point regarding the roughness of the crack front and the related cluster morphology is that their scaling properties depend on the range of length scales considered: The asymptotic scaling is observed only for length scales larger than a cross-over scale proportional to the Larkin length of the crack line. Earlier simulations [7] as well as experiments [6] have most likely been probing the regime below this cross-over scale, possibly explaining the different exponent values observed in those cases. However, for these small length scales additional complications arise due to the overhangs observed in the experimental crack profiles, which are excluded by construction in the present line model. Such overhangs might be responsible for the multiscaling observed for the experimental crack profiles for short length scales [16]. We are working to extend the crack front line model to include the possibility to form overhangs, and are planning to check if such an extension is sufficient to reproduce the experimentally observed short length scale scaling properties of the crack fronts. The connection between avalanches and clusters in
7 avalanching systems with long-range interactions opens up also interesting possibilities to understand the observed spatio-temporal correlations between avalanches in a number of systems, such as the space-time coupling of avalanches observed in plastically deforming crystals [25], and even the fore- and aftershock sequences of earthquakes: One possibility worth further studies would be to check if such correlated avalanches could in fact be local clusters, with the observed correlations arising naturally
from the fact that the localized clusters are parts of the same global avalanche.
[1] H. Gao and J. R. Rice, J. Appl. Mech. 56, 828 (1989). [2] J. Schmittbuhl, S. Roux, J. P. Villotte, and K. J. Maloy, Phys. Rev. Lett. 74, 1787 (1995). [3] S. Ramanathan and D. S. Fisher, Phys. Rev. Lett. 79, 877 (1997). [4] J. Schmittbuhl and K. J. M˚ aløy, Phys. Rev. Lett. 78, 3888 (1997). [5] A. Delaplace, J. Schmittbuhl and K. J. M˚ aløy, Phys. Rev. E 60, 1337 (1999). [6] K. J. M˚ aløy, S. Santucci, J. Schmittbuhl, and R. Toussaint, Phys. Rev. Lett. 96, 045501 (2006). [7] D. Bonamy, S. Santucci, and L. Ponson, Phys. Rev. Lett. 101, 045501 (2008). [8] L. I. Salminen et al., Europhys. Lett. 73, 55 (2006). [9] G. Durin and S. Zapperi, “The Barkhausen effect” in “The Science of Hysteresis”, edited by G. Bertotti and I. Mayergoyz, vol. II pp. 181-267 (Academic Press, Amsterdam, 2006). [10] G. Blatter et al., Rev. Mod. Phys. 66, 1125 (1994). [11] G. Gr¨ uner, Rev. Mod. Phys. 60, 1129 (1988). [12] J. F. Joanny and P. G. De Gennes, J. Chem. Phys. 81, 552 (1984). [13] M. Zaiser, Adv. Phys. 54, 185 (2006). [14] A. Rosso and W. Krauth, Phys. Rev. E 65, 025101
(2002). [15] S. Santucci et al., Proceedings of the 12th International Conference on Fracture, Ottawa (2009). [16] S. Santucci et al., submitted to Phys. Rev. Lett. [17] P. Moretti, M. C. Miguel, M. Zaiser, and S. Zapperi, Phys. Rev. B 69, 214103 (2004). [18] H. Leschhorn, Physica A 195, 324 (1993). [19] S. Santucci et al, in preparation. [20] A. Rosso, P. Le Doussal, and K. J. Wiese, Phys. Rev. B 80, 144204 (2009). [21] O. Duemmer and W. Krauth, J. Stat. Mech.: Theo. Exp. P01019 (2007). [22] A. I. Lar’kin and Yu. N. Ovchinnikov, J. Low Temp. Phys. 34, 409 (1979). [23] Due to artifacts related to the discretization of the front y position h(x), an effective multiscaling is observed at very small scales, but we have checked that this spurious effect disappears if we employ a continuous variable for h(x). [24] R. Planet, S. Santucci, and J. Ortin, Phys. Rev. Lett. 102, 094502 (2009). [25] J. Weiss and D. Marsan, Science 299, 89 (2003).
Acknowledgments. M.J. Alava and X. Illa are thanked for interesting discussions, and D. Bonamy for sending us the data of the avalanche size distributions of Ref. [7]. K.J. M˚ aløy is thanked for the possibility to publish the experimental data in Fig. 4. LL wishes to thank Academy of Finland for financial support.