AVHRR data processing for near real time applications André R. S. Marçal*a, Alexandra Nunes ab, Janete Borgesa Faculdade de Ciências da Universidade do Porto, DMA, Rua do Campo Alegre, 687, 4169-007 Porto, Portugal b Instituto Superior de Engenharia do Porto, Rua António Bernardino de Almeida 431, 4200-072 Porto, Portugal a
ABSTRACT Polar orbiting satellites with low spatial resolution sensors, such as the AVHRR, provide repeated global coverage of the Earth. The data is directly transmitted to ground stations, and in some cases distributed immediately after the data acquisition. Near real time applications can be implemented if the adequate processing tools are available. This paper presents a near real time processing system, developed for NOAA/AVHRR data acquired from the Dundee satellite station. The system performs image calibration, geometric corrections and atmospheric corrections with minimum operator intervention. The geometric corrections consist of an orbital-based correction refined by the automatic identification of Ground Control Points (GCPs) by image matching. The atmospheric correction is based on simulations performed on the 6S radiative transfer code using a set of typical and expected values for the most significant parameters. An attempt to evaluate the error associated with the simplified atmospheric correction method was carried out. As an illustration, 3 AVHRR images from NOAA 16 were processed. The ranges of values encountered for the most relevant parameters were analysed. The range and average values for the reflectance channels 1 and 2 with and without the atmospheric correction are compared. These were used to produce standard Normalized Difference Vegetation Index (NDVI) images and atmospheric corrected NDVI images. Keywords: AVHRR, atmospheric corrections, 6S, geometric corrections, automatic processing
1. INTRODUCTION Earth observation satellites acquire enormous amounts of data from the planet surface and atmosphere. A number of sensors, onboard meteorological and environmental polar orbital satellites, provide frequent global coverage of the Earth, in the form of low spatial resolution multi-spectral images. The images are transmitted to ground stations and stored in archives for subsequent processing and in some cases made available shortly after the satellite pass. This is very useful for near real time environmental monitoring, particularly when the data distribution policy is such that very little or no cost are involved in accessing the data. The AVHRR, SeaWiFS and MODIS are examples of satellite sensors providing data in these conditions. However, as the raw satellite data is usually not satisfactory for most applications, a number of processing steps are usually needed. These can include image calibration, geometric correction, additional imagery production, image classification, and atmospheric corrections. Most of these tasks can be automated, with various levels of operator intervention. Efficient processing tools are therefore required in order to have the final information available in practical time. This paper describes a near real time processing system, developed for NOAA/AVHRR data acquired from the Dundee satellite station, which provides atmospherically and geometrically corrected image data with minimum operator intervention.
*
542
[email protected] ; phone +351 220 100 873 ; fax +351 220 100 809 ; www.fc.up.pt
Remote Sensing for Environmental Monitoring, GIS Applications, and Geology III, Manfred Ehlers, Hermann J. Kaufmann, Ulrich Michel, Eds., Proc. of SPIE Vol. 5239 (SPIE, Bellingham, WA, 2004) · 0277-786X/04/$15 · doi: 10.1117/12.510674
1.1 THE AVHRR DATA The Advanced Very High Resolution Radiometer (AVHRR), onboard National Oceanographic and Atmospheric Administration (NOAA) satellites, provides data of the Earth surface and atmosphere since 1978 1. The NOAA series of polar orbiting satellites is an operational program, which guarantees two working satellites continuously, currently NOAA 16 and NOAA 17 2. The AVHRR has a nominal ground resolution of 1.1 km at nadir and a wide swath of 2800 km, allowing for complete Earth coverage every 12 hours 3. The AVHRR instrument has 5 spectral bands: band 1 on the visible (0.58-0.68 µm); band 2 on the near infrared region (0.725-1.10 µm); band 3 on the mid-infrared (1.58-1.64 µm or 3.55-3.93 µm); bands 4 and 5 on the thermal infrared part of the electromagnetic spectrum (10.30-11.30 µm and 11.5012.50 µm) 2. The digital data is collected in 10-bit resolution and transmitted to ground in various formats, including the High Resolution Picture Transmission (HRPT) mode that is used for real-time transmission of the 1 km image data 3. The AVHRR sensor, initially designed for meteorological purposes, has been used for various environmental applications, such as climatological studies, vegetation monitoring, fire risk assessment, production of snow and ice maps, fisheries, etc. 3. Some of these applications can benefit from data access in near real time. 1.2 THE DUNDEE SATELLITE RECEIVING STATION The Dundee Satellite Receiving Station (www.sat.dundee.ac.uk) provides on-line access to satellite data from the AVHRR, SeaWiFS, and MODIS sensors, as well as data from the METEOSAT. Registered users can access "quicklooks" of the latest images and place their orders through the WWW interface. "Quicklooks" from archived images are also available online. At any time there are about 100 AVHRR images, 70 SeaWiFS images and 20 to 30 MODIS images available for direct ordering 2. For the AVHRR, the data is made accessible for browsing through the WWW shortly after a satellite pass. Normally the full resolution images can be transferred by FTP only a few minutes after the order is placed, which is a very useful feature for near real time applications.
2. SYSTEM OVERVIEW The processing system presented here was designed for continental Portugal and for AVHRR data collected from the Dundee Satellite Receiving Station but can be easily adapted for other locations and AVHRR data formats. The system performs the following tasks: image calibration, geometric corrections, atmospheric corrections, and additional imagery production (for example a vegetation index image). The image calibration and additional imagery production are straightforward tasks. The atmospheric correction method will be described in Section 3; the geometric correction method used was described in detail elsewhere 4,5. 2.1 RAW DATA ACQUISITION The AVHRR images are obtained from the Dundee Satellite Receiving Station by FTP, allowing for the images to be available for processing a few minutes after the satellite pass. The user can order calibrated images and auxiliary images with viewing and illumination geometry parameters. These include, for each image pixel, the Solar Zenith Angle (SZA), Solar Azimuth Angle (SAA), Viewing Zenith Angle (VZA), and Viewing Azimuth Angle (VAA) 2. Information about the satellite orbits is also provided, which is needed for the geometric correction. The atmospheric correction method implemented requires measurements of the horizontal visibility at 550nm in as many locations as possible. There are about 30 locations in continental Portugal where measurements of the horizontal visibility are made; most are meteorological stations or airfields. However, the access to these measurements is not often possible in near-real time. The best source seems to be “The Weather Underground, Inc” (www.underground.com) providing horizontal visibility measurements for 22 of these locations, updated every 1 to 6 hours, depending on the station 6. The data is obtained from national meteorological service stations and military airports, and made available through the WWW shortly after the observations. Unfortunately there are frequent gaps in the data posted on the WWW.
Proc. of SPIE Vol. 5239
543
2.2 GEOMETRIC CORRECTION The geometric correction method involves four stages4: (i) initial image transformation (f) of the original AVHRR image, based on orbital parameters, creating a geo-referenced image; (ii) image segmentation of the image produced in (i) into 3 main classes (land, water, and cloud) and additional 9 classes with various levels of mixed water/land; (iii) automatic collection of a set of Ground Control Points (GCPs), by image matching, used to establish a transformation function (g) between the auto image and a reference image; (iv) final imagery production, directly from the original image, combining both image transformation functions f and g. The whole process is automatic but requires cloud free areas on the coastline. For continental Portugal a total of 30 search points are used alongside the coastline to allow for the automatic collection of GCPs.
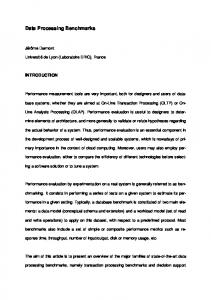
3. ATMOSPHERIC CORRECTIONS The atmospheric correction method implemented deals with the AVHRR visible and near infrared channels. The Top Of Atmosphere (TOA) reflectance images of channels 1 and 2 are corrected for Bottom Of Atmosphere (BOA) reflectance images. The correction process makes use of the Radiative Transfer Code 6S (Second Simulation of the Satellite Signal in the Solar Spectrum) 7 and horizontal visibility measurements. 3.1 THE 6S RADIATIVE TRANSFER CODE The 6S code allows for the simulation of the measured signal by a satellite sensor in the range 0.25-4.00 µm. Given the target reflectance of a pixel and the sensor characteristics, the code simulates the effect of the atmosphere in the signal due to scattering by molecules and aerosols, and absorption, mainly by H2O, CO2, O2, O3, CH4, N2O and CO 7. The input parameters include the viewing and illumination geometry, atmospheric model for the gaseous components, aerosol model, sensor/band information, and target (BOA) reflectance. The ground horizontal visibility is also an input parameter, used to estimate the optical depth due to aerosol loading at 550 nm. The 6S code computes the TOA reflectance amongst other outputs. The main limitations to the operational use of the 6S code is the difficulty in getting the required atmospheric parameters and the computational time involved in running the code on a pixel-by-pixel basis 8. 3.2 EVALUATION OF THE MOST RELEVANT PARAMETERS Initially a total of 9 input parameters were considered. These include viewing and illumination conditions (6), surface characteristics (2) and atmospheric conditions (1). The most likely or typical value for each of these parameters was established, for the spring and summer periods in Portugal. Setting all the parameters to their typical values, a BOA reflectance of 0.3 will correspond to a TOA reflectance of 0.2662 for channel 1, and 0.2360 for channel 2. The aerosol and atmospheric models were maintained constant, as no information about the most suited model for a particular day and location is easily available. The pressure, temperature, H2O(v) and O3 profiles were set to the “midlatitude summer” and the aerosol model to 60% continental, 30% maritime and 10% urban. The surface was considered to be homogeneous and Lambertian throughout. The 6S code was used to estimate the importance of each input parameter on the TOA reflectance measured by AVHRR channels 1 and 2. This was done by varying each parameter through the whole range of possible values, maintaining the remaining inputs fixed. For 4 of the tested parameters the variability of the measured reflectance throughout the entire range of possible values was found to be negligible. In addition to the BOA reflectance, the 5 remaining parameters were found to have a significant effect on the TOA reflectance; these were: Solar Zenith Angle (SZA), Viewing Zenith Angle (VZA), Viewing Azimuth Angle (VAA), ground height, and horizontal visibility. The VAA only takes one of two possible values, apart from slight variations. Figure 1 shows plots for the TOA reflectance as a function of (i) SZA, (ii) VZA and VAA, (iii) ground height, (iv) horizontal visibility at 550nm. A summary of these results is also presented on Table 1.
544
Proc. of SPIE Vol. 5239
Fig. 1: Variability of the Top Of the Atmosphere (TOA) reflectance with (i) Solar Zenith Angle, (ii) Viewing Zenith Angle for Azimuth Angles of 81.1º and –98.9º, (iii) Ground height, (iv) Horizontal visibility at 550nm.
Proc. of SPIE Vol. 5239
545
The TOA reflectance has a nearly linear dependence with the SZA and ground height, for both channels 1 and 2. The TOA reflectance plots for VZA/VAA and for horizontal visibility have a non-linear behaviour. The results presented on Figure 1 and on Table 1 clearly show that the visibility is the most important parameter for both channels, with up to 8.6% variability around the typical value. The parameters geometry have a similar impact on channels 1 and 2 but the ground height has a much greater influence on AVHRR channel 2 than on channel 1. Parameter values
TOA reflectance (ch. 1)
TOA reflectance (ch. 2)
Parameter
typical
range
range
max. variability
range
max. variability
SZA
30º
15º to 50º
0.2556-0.2704
3.98%
0.2265-0.2395
4.03%
0.2548-0.2662
4.28%
0.2251-0.2360
4.62%
0º
-50º to 50º 0.2577-0.2667
3.19%
0.2261-0.2361
4.19%
VZA (VAA+) VZA (VAA-) height
400 m
10 – 2000 m
0.2655-0.2684
0.83%
0.2319-0.2516
6.61%
visibility
15 km
5 – 42 km
0.2433-0.2743
8.60%
0.2162-0.2425
8.39%
Table 1: Range and typical values for each major parameter and corresponding TOA reflectance range and variability (for a BOA reflectance of 0.3000) 3.3 THE SIMPLIFIED ATMOSPHERIC CORRECTION METHOD For each image pixel the TOA reflectance (ρT) is a function of 6 variables: ρT = ρT (ρB, θs, θv, φv, h, v) where ρB is the BOA reflectance, θs the SZA, θv the VZA, φv the VAA, h the ground height and v the horizontal visibility at 550nm. As it is impractical to run the 6S code for every pixel, a possible approach is to establish a multi-dimensional look up table. However, with 5+1 parameters (φv only has 2 values) the number of scenarios to simulate is very high. For example if 10 values were used for each input parameter, the total number of scenarios would be 2x10⁵. This number would even be higher because some of the input parameters would require even more than 10 values, as can be easily concluded from the plots on Figure 1. A simplified approach is to consider that the effect of each parameter is independent from the remainder. We thus have a simplified estimation of the TOA reflectance (ρT’) computed from the TOA reflectance obtained with all parameters set to their typical values (ρT0): ρT0 = ρT (ρB0, θs0, θv0, φv0, h0, v0) ρT’ = ρT0 + ∆ρT’ ∆ρT’ = ∆ρT (ρB-ρB0) + ∆ρT (θs-θs0) + ∆ρT (θv-θv0) + ∆ρT (φv-φv0) + ∆ρT (h-h0) + ∆ρT (v-v0) The ∆ρT(x-x0) functions have the form of the plots presented on Figure 1. Computationally this is much easier to implement, as the total number of scenarios is reduced to only about a hundred. 3.4 ERROR EVALUATION An evaluation of the error introduced by the simplification proposed was carried out. A total of 300 sets of input parameters were randomly generated. For each set of input parameters, the TOA reflectance was calculated using the 6S code (ρT) and the simplified approach (ρT’). The error from the simplified approach is obtained by:
546
Proc. of SPIE Vol. 5239
ρT = ρT’ + ε (ρB, θs, θv, φv, h, v) This error can be compared with the expected value (ρT) but it is perhaps more significant to compare the amount of atmospheric correction effectively done by the simplified approach (CSA) and that actually done by the 6S code (C6S). C6S = | ρT - ρB | CSA = | ρT’ - ρB | = | ρT - ε (ρB, θs, θv, φv, h, v)- ρB | εSA = / εSA is the average error committed by the simplified approach, relatively to the correction by the 6S code. Table 2 shows the average results for the 300 scenarios tested. The simplified approach corrects on average about 85% of the atmosphere attenuation on channel 1 and about 90% on channel 2. These results are rather good, as most of the atmosphere influence is corrected by the simplified method. The results from this test would certainly be improved if the random values were set to follow the most likely encountered values in reality, which tend to be distributed around to the typical set of values. A similar formulation can be established for the inverse process, which is in fact the approach for atmospheric correcting the satellite data. In this case the TOA reflectance is available and the aim is to calculate the BOA reflectance: ρB = ρB (ρT, θs, θv, φv, h, v) ρB = ρB’ + ε’ (ρT, θs, θv, φv, h, v) The estimation of the BOA reflectance (ρB’) is based on the same assumptions as for the direct process, and on the same ∆ρT (x) functions: ρB’ = ρB0 + ∆ρT’ [∆ρB (ρT−ρT0) / ∆ρT (ρB-ρB0)] where ρB0 = ρB (ρT0, θs0, θv0, φv0, h0, v0) The 6S code could have been used in ‘atmospheric correction’ mode, which simulates BOA from TOA reflectance values. However, with the simplified approach used, the error associated with the inverse process (BOA from TOA reflectance values) is better evaluated by: CSA’ = | (ρT - ρB) – (ρT - ρB’) | = | ρT - ρB’ | εSA’ = / The performance of the simplified approach in the inverse process is not as satisfactory as for the direct process (see Table 2). The results presented for the 300 set of random values show an average correction of 67% and 72% of atmospheric effects for channels 1 and 2, respectively. It should be emphasised that this analysis is based on the assumption of an identical performance of the 6S code in both the direct and inverse processes. This assumption needs to be further investigated. Again, a smaller error would be obtained if the random values were set to be distributed around the typical set of values, as they tend to do in reality. ρT (ρB, θs, θv, φv, h, v)
ρB (ρT, θs, θv, φv, h, v)
< | C6S – CSA | >
εSA
< | C6S – C’SA | >
ε’SA
AVHRR ch.1
0.07270
0.01129
15.53%
0.0240
33.01%
AVHRR ch.2
0.10804
0.01174
10.86%
0.0304
28.14%
Table 2: Summary of the evaluation of the errors committed by the simplified atmospheric correction approach.
Proc. of SPIE Vol. 5239
547
3.5 IMPLEMENTATION The atmospheric correction of an AVHRR image requires the following inputs: channels 1 and 2 calibrated to TOA reflectance (ρT); synthetic images with the SZA, VZA and VAA for each pixel; ground height and horizontal visibility at 550 nm for each pixel. The SZA, VZA and VAA images are provided by the Dundee Satellite Receiving Station as well as the calibrated channels 1 and 2. A 1 km digital elevation model raster image was created for continental Portugal from the USGS global digital elevation model GTOPO30 9. The horizontal visibility of each pixel is obtained by spatial and temporal interpolation of the valid readings form the “The Weather Underground, Inc”. For each pixel this set of values is used to compute the inverse correction functions (∆ρT) and finally to obtain the BOA reflectance for AVHRR channels 1 and 2. The whole process is considerably fast and does not require a direct use of the 6S code. The operator intervention is minimum. The most time consuming task is entering through the keyboard the visibility readings for each valid station before and after the satellite image acquisition.
4. DATA PROCESSING EXAMPLE A practical processing example is presented here as an illustration of the near real time system and the usefulness of the atmospheric correction procedure. Three AVHRR images from the 9th, 10th and 11th of July 2003 were collected from the Dundee Satellite Receiving Station. The visibility readings from the network of ground stations were recorded for 12:00 and 15:00. As it happens often, there was only one reading from a number of the stations. Visibility measurements from 15 stations were available on the 9th of July, from 14 on the 10th and from 18 stations on the 11th of July. Image 1
Image 2
Image 3
Date
9 July 2003
10 July 2003
11 July 2003
Time (UTC)
1440
1429
1427
Raw image scene size
329x961
480x961
621x997
Range of values [average value] Solar Zenith Angle (º)
28.7 – 32.7 [30.6]
26.7 – 31.1 [28.7]
24.7 – 29.1 [27.0]
Viewing Zenith Angle (º)
33.8 – 49.3 [41.4]
18.4 – 40.0 [28.2]
0.3 – 24.6 [12.0]
height (m)
0 – 1935 [325]
0 – 1935 [325]
0 – 1935 [325]
Visibility (km)
5 – 30 [15.7]
5 – 30 [16.3]
5 – 30 [13.7]
TOA reflectance (Ch.1)
0.042 – 0.394 [0.105]
0.030 – 0.400 [0.106]
0.034 – 0.400 [0.119]
BOA reflectance (Ch.1)
0.000 – 0.446 [0.084]
0.000 – 0.465 [0.091]
0.000 – 0.470 [0.106]
TOA reflectance (Ch.2)
0.020 – 0.392 [0.185]
0.013 – 0.400 [0.185]
0.016 – 0.400 [0.183]
BOA reflectance (Ch.2)
0.000 – 0.499 [0.220]
0.000 – 0.524 [0.227]
0.000 – 0.520 [0.222]
TOA NDVI
0.000 – 0.595 [0.287]
0.000 – 0.604 [0.283]
0.000 – 0.636 [0.245]
BOA NDVI
0.000 – 1.000 [0.479]
0.000 – 1.000 [0.452]
0.000 – 1.000 [0.425]
Table 3: Main characteristics of the images tested, and range of [and average] values encountered for continental Portugal (90232 pixels) for the relevant parameters.
548
Proc. of SPIE Vol. 5239
The main characteristics of the three images are presented on Table 3. This table also presents the range and average values encountered for continental Portugal (90232 pixels) for the relevant parameters on each of the images. The Solar Zenith Angle only varies by about 4º within a single image. The SZA values at this time of the year are all close to the typical value used for the 6S simulation (30º). The Viewing Zenith Angle varies by about 20º within a single image and for these three images happens to be all positive. The visibility has a considerable variability within a single image, between 5 and 30 km for the three dates. The average visibility is close to the typical value used in the simulation (15 km) but this should be the main source of error in the simplified approach, as this parameter was found to be the most critical on the simulations. Furthermore, the network of ground stations is sparse and there are frequent gaps in the data posted on the WWW. The height parameter is constant for every image; the average value for continental Portugal is 325 meters and the typical value used in the simulation was 400 meters. BOA reflectance images from channels 1 and 2 were produced following the atmospheric correction method presented in the previous section. These were used to compute an atmospherically corrected NDVI image (BOA NDVI). An NDVI image computed from TOA reflectance images was also produced. The range of values encountered for continental Portugal for BOA and TOA reflectance images for channels 1 and 2 and BOA and TOA NDVI are presented on Table 3. The range of channel 1 reflectance values is increased by the atmospheric correction process but the average value is slightly decreased. For the AVHRR channel 2 the range of reflectance values is also increased by the atmospheric correction. The average reflectance values for channel 2 are significantly increased. These two facts combined result in much higher NDVI values when atmospheric corrected reflectance images are used. As a final remark, it is worth pointing out that the BOA reflectance values used for the simulations with 6S were 0.300 for both channels, which according to the results on Table 3 seem to be an overestimation.
5. CONCLUSIONS Near real time processing tools are useful to implement some environmental monitoring applications based on satellite images of the Earth. The AVHRR images have a good repetition period and are widely available. Atmospheric corrections are not often used when fast processing is required, due to the lack of auxiliary data and computational effort. The processing system presented here performs the tasks of image calibration, geometric corrections, atmospheric corrections, and additional imagery production nearly automatically. The atmospheric correction method is based on simulations previously performed on the 6S radiative code for typical values for the relevant parameters for a specific area. A large number of images are currently being processed in order to analyse the range of values encountered and establish a new set of typical values, suited for the area of interest. The new set of typical values will be used to perform new simulations using the 6S code. An extensive evaluation of the numerical error in the 6S simulations and on the simplified atmospheric correction approach is also needed.
ACKNOWLEDGMENTS This work was done within the SADAMOS project, financed by the Portuguese Science and Technology Foundation (FCT) through the POCTI/FEDER program. The authors also wish to thank the NERC Dundee Satellite Receiving Station for providing the AVHRR data.
REFERENCES 1. 2.
Kidwell, K.B., NOAA Polar Orbiter Data Users Guide, National Oceanic and Atmospheric Administration National Environmental Satellite Data and Information Service, 1995 Dundee Satellite Receiving Station, WWW information pages, http://www.sat.dundee.ac.uk
Proc. of SPIE Vol. 5239
549
3. 4. 5. 6. 7.
8. 9.
550
Cracknell, A.P., The Advanced Very High Resolution Radiometer, Taylor & Francis, London, 1997 Marçal, A.R.S., Borges, J., “AVHRR rectification using orbital navigation and image matching”, Image and Signal Processing for Remote Sensing VIII, Sebastiano B. Serpico, Editor, Vol. 4885, 2003 Marçal, A.R.S., “A system for near real time processing of AVHRR data – An application to vegetation monitoring in Scotland”, PhD thesis, University of Dundee, Scotland, 1998 Weather Underground Inc, WWW information page, http://www.underground.com Vermote, E.F., Tanré, D., Deuzé, J.L., Herman, M., Morcrette, J.J., "Second Simulation of the Satellite Signal in the Solar Spectrum, 6S: An Overview". IEEE Transactions on Geoscience and Remote Sensing, 35, No. 3, 675-686, 1997 Zhao, W., Tamura, M., Takahashi, H., "Atmospheric and Spectral Corrections for Estimating Surface Albedo from Satellite Data Using 6S Code". Remote Sensing of the Environment, 76, 202-212, 2000 GTOPO30 Global 30 Arc Second Elevation Data, U.S. Geological Survey EROS Data Center, http://edcdaac.usgs.gov/gtopo30/gtopo30.html
Proc. of SPIE Vol. 5239