University of Nevada, Reno, NV 89557 ... apply case-based reasoning to infer the enemy unit types ..... and learning in computers and people, Cambridge.
Battlespace Situation Assessment via Clustering and Case-Base Reasoning by Carl G. Looney* and Lily R. Liang Computer Science Department/171 University of Nevada, Reno, NV 89557 @cs.unr.edu
Abstract. We cluster surface target feature vectors by position in a certain area of the battlespace and make inventories of the resulting clusters by type and count. The feature vectors come from the target tracks. Our new centralized-mean clustering method is robust. Next, we apply case-based reasoning to infer the enemy unit types and their posture for situation awareness. We then employ a weighted retrieval process to match the new cluster inventories to cases whose solutions provide unit types.
1. Introduction Situation awareness is a model of the the locations, types, counts, readiness and activity levels of enemy resources, along with extraneous information on the terrain, weather, access routes, etc. Situation assessment (SA) is the ongoing process of inferring this relevant information about forces of concern in a military situation. Commanders need visual models for spatial reasoning and decision making. They need situation awareness [5] of their battlespaces to be able to make effective command decisions [9]. History shows that it is a key to victory and that the lack of it often leads to disaster [4]. A visual model of the battlespace allows the commander and his forces to operate according to a common perception. Perception is a process [3] of maintaining a model of an environment by combining observed and stored data into a coherent description. The summarized data comprise a state of the battlespace environment that consists of its objects and their interactivity. It is updated based on the previous state data, newly observed data (and possibly other incoming information) and models of interactivity. The data for SA comes from the tracks of targets that are established by readings from sensors such as radar, infrared, laser, optic and other sensors (electronic intelligence and communications intelligence). The sensor platforms may be ground, sea, air or space based. The track data fields contain time, position, target type, and sometimes subtype. A track may contain not only the latest state, but a short sequence of previous states. ______________________________________________ * Supported by ARO Grant DAAD19-99-1-0089 The ground (or sea) situation picture is part of the
common operational picture of the greater batttlespace, maintained by the friendly forces using data fusion [9]. The situation should be interpretable as patterns that are recognizable from commanders’ experience and intuition. Situation awareness is an enabler for gaining operational advantage, but a profusion of data from sensors, communications reports and databases can be counterproductive and contribute to confusion (the fog of war becomes the glare of war). This delays the time critical decision making required to operate inside the response cycle of the enemy.
2. Clustering the Targets The feature vector for each surface target contains the information shown in Table 1. The (x,y,z)-position components are given in real (floating point) numbers to designate kilometers and the class beliefs are reals between 0.0 and 1.0, but everything else is integer valued. The feature vectors for a battlespace are to be updated from tracks at certain times to yield a current set of Q target feature vectors {x(q): q = 1,...,Q} in various surface areas for SA processing. The clustering of these vectors is done only with respect to position features (x,y) or (x,y,z) in a given area of 2x2 kilometers (or other size where a nonnegligible number of ground targets are located). Our robust clustering algorithm forms clusters and determines their centroids in a manner that is not influenced by outliers and noisy vectors [8]. Our vector averaging method is similar in effect to the alpha-trimmed mean [2] used for real values. The clustering of the feature vectors, denoted by {x(q): q = 1,...,Q}, is started with a relatively large number K of uniformly randomly drawn seed vectors {z(k): k = 1,...,K}. We thin this large set to obtain a smaller set of uniformly distributed seeds for the initial centroids of clusters. Starting with the first seed, any seeds closer to it than the threshold J are eliminated, K is decremented and the next available seed is checked the same way, and so forth. This prevents bad seeds from causing a bad clustering [8].
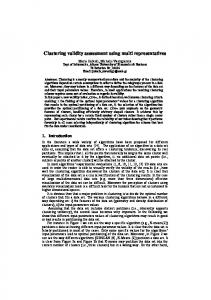
Figure 1. The clustering flowchart.
For each k-th cluster there is a centroid and a count[k] of target feature vectors assigned to it and each one has a type. At this point we make an inventory of each cluster, and then of all combined clusters in the entire area, of the positions and numbers of targets by type. These can be displayed on the screen as a list for the commander, an example of which is shown in Table 2. Each row in the inventory list is an individual target record, except for the case of troops, which are given an estimated count under the subtype field. From the inventory we make a set of cluster attribute records for the area that serve as the problem. Table 3 shows an example of cluster attribute vectors, where the class types continue on the right until all types are exhausted (we currently use 6 class types, but more can be added). The belief in the record is the average of the beliefs of all targets in a target type. The problem is to be compared to the problem parts of cases in the case-base to extract a similar case whose solution is the unit type, size, and purpose of the cluster.
3. Case-Based Reasoning for SA
The initial clustering assigns each feature vector x(q) to its nearest centroid z(k) by the index c[q] = k to form the first clusters and increments the cluster count count[k]. Now we eliminate all centroids that were not assigned to any feature vectors and reduce K accordingly. Next, we compute the distances from each centroid to all feature vectors in its cluster, order these from least to greatest and find a new centroid by averaging only the " proportion that are closest to the centroid (0.60 to 0.80 were determined empirically to work well). This "centralized mean (CM) of the cluster is more representative than the mean or median. The iterations repeat the above steps where the current centroids serve as the seeds on reassignment. During each of the I iterations of assignment and computing centroids, if count[k] # p, where p $0 is an integer, then centroid k is eliminated and K is reduced accordingly. At this point, only the centroids that are centers of nonempty clusters exist and the vectors must be re-clustered with the remaining centroids as seeds. After clustering, the distance between each pair of different centroids is computed and tested to see if the distance is too close (less than a specified J), and if so, the two centroids are replaced by one midway between them, the indices are closed up and K is decremented. After any merging, the number of iterations done so far is set to 0 and the clustering is performed again with the current centroids as seeds. Figure 1 is a flow chart of the algorithm. In a few epochs of iteration sets, the clusters become fixed and do not change further. We call this method the "-centralized means clustering algorithm.
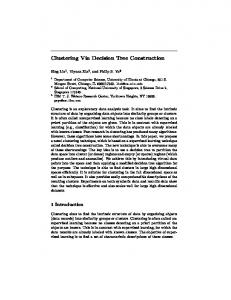
Case-based reasoning (CBR) is a paradigm that emulates the human reasoning process [10] to solve new problems by recalling similar problems and their solutions stored in memory. The recalled solutions may be modified to fit the problem at hand [1,6]. Figure 2 shows the CBR problem solving paradigm that accumulates the successful experiences and thus learns. The cycle of CBR for an input new problem is: i) retrieve the most similar cases from the case-base; ii) re-use the most similar cases to attempt to solve the problem; iii) revise the case-based solutions if necessary to fit the new problem; and iv) retain the new proposed solution with the new problem as a new case-base if it is shown to be a good solution. Case storage is important for the CBR efficiency. The design of it should support and simplify the retrieval process. Here we use a dynamic memory model, where each instance of the basic unit is a case [6,7]. Each case in the SA case-base is made up of problem and solution parts. The problem part contains the quantity and percentage of each target class in a cluster. It also contains the importance weight of each target class, which is the degree of importance of that class for that cluster. The solution part of it is the type, size and purpose of the enemy unit that cluster represents. So each case in the SA case-base is a cluster with its type, size and purpose stored. Table 4 shows the case-base storage. When the attribute record of a new cluster is made, it is compared with the problem parts of SA cases to extract a similar case whose unit type, size, and purpose. Are fetched as a solution. There are several well-known case retrieval methods, such as nearest neighbor, induction, knowledge guided induction and template retrieval [11]. Here we use a hybrid retrieval strategy. It combines the nearest neighbor method with the template retrieval
method, and thus solves the retrieval time problem of the former while achieving flexible matching. Template retrieval is similar to common database queries, returning cases that satisfy certain parameters. We use it at the beginning of the retrieval process to narrow down the space before we do further search. So, first, the new attribute record is going to be used as a template. Any case in the SA case-base matches that template, that is, made up by the same class types, will be taken and the others will be skipped in the future comparison. This limits the search space to a relevant section of the case-base. When this is done, with the resulting cases fetched, we apply the nearest neighbor method, which compares the similarity between the stored cases and the input problem. The case similarity calculation uses the information of quantity proximity, the degree of belief, and the weight of importance of each target class. They influence the case similarity as described below. The greater the proximity of a target class, the higher is the similarity of that target class, which contributes to a greater similarity of the entire case. The higher the belief of a target class in the problem, the higher is the similarity of that target class, which contributes to a greater similarity of the whole case. The more important a target class is, the more it influences the case similarity. The case similarity s is the sum of the products of the quantity proximity and the belief of each target class, adjusted by weight. The formula for s is
Figure 2. The CBR problem-solving diagram.
Figure 3. The CBR paradigm.
∑ni=1wsi×Qnj - Qsj-1×Bnj ∑ni=1wsi where wsi is the importance weight of i-th target class in the stored case, Qsi is the quantity of the i-th target class in the stored case, Qni is the quantity of the i-th target class in the new problem, and Bni is the belief of the i-th target class in the input problem The case with the greatest value of the weighted similarity will be considered the most similar case, and its solution will be retrieved and used as the solution of the input problem. That is, the unit type, size, and purpose will be used for the new cluster. And the calculated similarity for it will be considered the case belief. Both the solution and the case belief will be output as the result of the case-base reasoning for situation assessment. Where there’s no matching result in the template matching step, or when the similarity is too low (under certain threshold) in the nearest neighbor method retrieval step, the problem will be considered a new case for which a solution must either be entered by a human or is deduced by rules and checked. Figure3 shows the CBR diagram.
References [1] A. Aamodt and E. Platz, Case-based reasoning: foundational issues, methodological variations and system approaches, IEEE AI Communications, 7(i), 39-59, 1994. [2] J. B. Bednar and T. L. Watt, “Alpha-trimmed means and their relationship to median filters,” IEEE Trans. Acoustics, Speech and Signal Processing, vol. 32, no. 1, 145-153, 1984. [3] James L. Crowley, “Principles and techniques for sensor data fusion,” in Multisensor Fusion for Computer Vision, ed. J. K. Aggarwal, Springer-Verlag, 15-36, 1993. [4] James F. Dunnigan, How to Make War: a Comprehensive Guide to Modern Warfare for the Post Cold-War Era, 3rd Edition, Morrow and Co., Inc. New York, 1993. [5] Driss Kettani and Jean Roy, “A qualitative spatial model for information fusion and situation analysis,” Proc. 3rd Int. Conf. Information Fusion (FUSION2000) Paris,
France, vol. I, TuD1-16 to TuD1-23, July 2000. [6] J. L. Kolodner, “Maintaining Organization in a Dynamic Long-Term Memory,” Cognitive Science, 7(iv) 243-280, 1983. [7] J. L. Kolodner, “Reconstructive Memory: a Computer Model,” Cognitive Science, 7(iv), 281-328, 1983. [8] Carl Looney, “Interactive clustering and merging with a new fuzzy expected value,” (in press) Pattern Recognition.
[9] Carl Looney, “Exploring fusion architecture for a common operational picture,” (in press) J. Information Fusion. [10] Schank, R., Dynamic memory: a theory of reminding and learning in computers and people, Cambridge University Press, Cambridge, UK, 1982. [11] Ian Watson and Farhi Marir, Case-Based Reasoning: a Review, at http://www.ai-cbr.org/classroom/ cbr-review.html.
Table 1. The Features in the Target Feature Vectors Number 1 2 3 4 5 6 7 8 9 10 11 12
Feature t d x y z c1/b1 c2/b2 st su g1 g2 cm
Description time of latest sensed position (24 hour clock; integers) day, month, year (integers) first coordinate in central coordinates (meters: real) second coordinate in central coordinates (meters: real) third coordinate in central coordinates (meters: real) class (truck, tank, artillery, etc.; integer)/belief (real) subclass (tanker truck, medium tank, etc.; integer)/belief (real) status of the target (full, partial, disabled, destroyed; integer) supply status of target (full, moderate, low, none; integer) geographical situation (on hill, in valley, dug in, etc.; integer) ground cover type comment (text)
Table 2. Sample Inventory List by Cluster and Type. Cluster 1 1 : 5 5
Tgt No Tgt Class Belief Tgt Subclas s 31 Tank 0.7 Medium 18 Truck 0.8 Tanker : : 0.6 : 14 Truck 0.9 APC 47 Troops/60 0.5
Time 24:01 23:52 : 20:48 21:93
Location (km) (20.92,34.51) (20.83,34.80) : (25.07,30.74) (26.35,30.66)
Status Ready Destroyed : Disabled Ready
Table 3. Sample Cluster Attribute Records for Area 1 Cluster No. Type % Type 1 No. 1 Targets Targets Belief 3 23 10 0.8 : : : :
No. Type % Type 2 No. Type % Type N 2 Targets Targets Belief . . . N Targets Targets 108 41 0.6 18 18 : : : : :
Belief 0.7 :
Table 4. Sample Unit Data No. Type 1 Targets 75 :
% Type 1 Targets 15 0.7 :
Type 1 Weight :
... ... 10
No. Type N Targets 2 :
% Type Type N N Targets Weight 0.6 2 : : :
Unit Type 4 :
Unit Size 3 :
Unit Purpose
Table 5. Codes for Unit Type/Size/Purpose. Unit Type
1=>armored; 2=>motorize infantry; 3=>infantry; 4=>artillery; 5=>anti-aircraft guns/missiles; 6=>anti-tank; 7=>supply; 8=>communications; 9=>motor pool; 10=>construction; 11=>airborne; 12=>commando (including special operations); 13=>unknown Unit Size 1=>squad (NCO); 2=>platoon (NCO); 3=>company (Captain); 4=>battalion (Major); 5=>regiment/brigade (Colonel); 6=>division (General); 7=>unknown Unit Purpose 1=>offensive/assault; 2=>defensive; 3=>transportation; 4=>construction; 5=>unknown