46th International Symposium Electronics in Marine. ELMAR-2004, 16-18 June 2004, Zadar, Croatia
BAYER CFA IMAGE ZOOMING USING A NORMALIZED COLOR-RATIO MODEL Rastislav Lukac and Konstantinos N. Plataniotis The Edward S. Rogers Sr. Department of Electrical and Computer Engineering, University of Toronto, 10 King's College Road, Toronto, M5S 3G4 Ontario, Canada
[email protected],
[email protected] Abstract: A new zooming algorithm suitable for Bayer color filter array (CFA) based digital cameras is introduced. The proposed method utilizes both the spatial and the spectral correlation among the CFA inputs to achieve a high-quati@, enlarged CFA image. Operating directly on the noise-free datu, the zooming method avoids amplijkation of the impairments which are usually introduced during demosaicking. The utilization of a normalized colorratio model in the proposed zooming scheme reduces color shijis in the enlarged CFA image and thus, the cycle completed using a CFA interpolation scheme results in full color, enlarged image pleasing for viewing.
Keywords: single-sensor imaging, color filter array (CFA), Bayer CFA pattern, interpolation, CFA zooming. 1. INTRODUCTION Technological advances of single-sensor digital cameras have allowed their embedding in mobile phones and personal digital assistants. However, these devices are restricted in their optical capabilities and computational resources and thus provide limited functionality and quality of output [ll]. The spatial resolution of the images captured by cost-effective singlesensor imaging devices depends on size of the sensor, typically a charge coupled device (CCD) or a complementary metal-oxide semiconductor (CMOS) sensor. Since the sensor is a monochromatic device capable of capturing a single value per spatial location, the CFA such the well-known Bayer pattern (Fig. la) [2], is used to separate incoming light into a mosaic of the color components. The process of recovering the full color image from the mosaic's input is often referred as CFA interpolation or demosaicking [4],[6],[8],[10],[12]. To increase the spatial resolution of the image, a number of methods have been developed [5],[7],[13]. These schemes process a color image in a component-wise manner and in terms of the digital camera pipeline perform the zooming operations after demosaicking. Thus, the lack of sharpness and false colors commonly present in demosaicked images are amplified [1],[11]. To avoid this drawback, a novel zooming approach is applied directly to CFA data in order to operate on noise-free CFA values [1],[9] and the zooming procedure is performed before demosaicking. Using the underlying structure of the mosaiced inputs [9],[11], the zooming schemes can eliminate color shifts and in conjunction with the demosaicking procedure used in sequence single-sensor cameras produce naturally colored outputs.
In this paper, we introduce a new CFA zooming method which utilizes a normalized colorratio model. Instead of a conventional color-ratio model used in demosaicking [3],[4],[6],[121 and zooming [ 1I], the proposed method uses normalized color-ratios employed in demosaicked image post-processing [lo]. It has to be mentioned that using the normalized 555
46th International Symposium Electronicsin Marine, ELMAR-2004, 16-18 June 2004, Zadar. Croatia
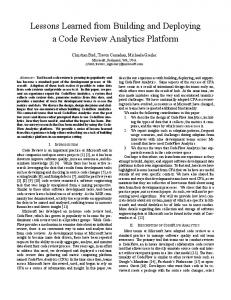
Fig. 1 Spatial arrangements of the CFA components obtained using the proposed zooming scheme: (a) original Bayer CFA pattern, (b-h) individual CFA zooming steps. color-ratio model the procedure i) avoids singularities which correspond to color shifts, and ii) decreases the dynamic range of the color-ratio inputs reducing thus estimation errors of the spatial interpolator. Combined with a unique CFA image processing steps of [9], the method increase the spatial resolution of the Bayer CFA image and interpolates the data in the enlarged image with a high accuracy. 2. PROPOSED METHOD Let us consider, a K! xK, Bayer CFA image b, shown in Fig. la, representing a twodimensional matrix of three-component RGB vectors b,,,", = [b(,,,,,b,,,,,2,b,,,,,,] with only a single available color component b(,,,nlk,for k = 1,2,3. Based on the Bayer CFA- pattern structure, incomplete RGB vectors located in the spatial location ( m , n ) , for m=l,2, ...,K, and n=l,2,...,K , , contain R components b(,,,n)l are located at (oddm, even n ) , and B components b(m,n)l are located at (even m, odd n). The rest of locations in the Bayer image b(i) correspond to the G components b(m,n)2 .
To zoom the Bayer data and preserve the Bayer pattern structure, the original CFA data should be assigned unique positions which correspond to the Bayer pattern of an enlarged image [9],[11]. Assuming that 1 denotes an arbitrary integer zooming factor and x represents a 1K,x AK, Bayer image with the increased spatial resolution, the original values of b are filled into the zoomed image x as follows [l 11: for (odd m,even n ) X(Zm-l.2") x , ~ ~ , ~-~b,,,", - ~ , for (even m,odd n ) (1) otherwise 42m-1,Zn-I)
I-
where (m,n) denotes the coordinates in the original Bayer CFA image b. The procedure results in the pattern depicted in Fig. 1b. 556
46th International Svrnoosium Electronics in Marine. ELMAR-2004. 16-18 June 2004. Zadar. Croatia
Let us consider that ( r , s ) , for r=1,2,...,XI and s =1,2, ...,AYz, denotes the spatial position in the enlarged image x (Fig. 1b) containing only the original Bayer CFA data of b . Missing G components x [ , ~ )of ~ x are generated using a weighted sum of the surrounding original G components x ~,)z, as follows: x(rs)2= mea"{x(z,)21>
(2)
(1,J)EC
where 5 = { ( r - 2 , s ) , ( r , s - 2 ) , ( r , s + 2),(r + 2 . s ) } denotes spatial locations of the original G CFA components forming a diamond-shape mask on the image lattice. In order to decrease the computational requirements as much as possible and preserve the simplicity of the operations as it is required in cost-effective devices, we utilize four-neighborhood arrangements and the efficient linear interpolator scheme. As it can be seen in Fig. IC, the procedure does not interpolate all needed G components. To complete the remaining missing G components, (2) is repeated with ( r , s ) located at the center of the square-shaped structure described by 5 = { ( r-1,s - l),(r-1,s +l),(r + 1,s - l ) , ( r +1,s + 1)) , Fig. 3c. The G components xo for ( z , j )5~, consist of two original G components and two interpolated G components from the previous step. This zooming step results in the pattern depicted in Fig. 3d, with the completed G components. To constitute the missing R ( k = 1) and B ( k = 3) components, the proposed method utilizes a normalized color-ratio model defined as follows [lo]:
where /3 is a linear shifting parameter regulating the equivalence between the color ratios of two spatially neighboring locations ( r , s ) and (i, j ) . Using the parameter /3, the proposed model satisfies the underlying modeling assumptions of color constancy in both smooth and high-frequency image regions. Moreover, the addition of p to individual color-component eliminates singularities which results in color shifts and artifacts [lo]. The utilization of (3) in the proposed zooming scheme is relatively straightforward. For each position that requires the estimation of an R component, a local WG ratio is generated using surrounding positions. Since G components are not present in the same locations as the R components, adjacent surrounding G components with the identical shift on the image lattice are used to create the color ratio. The missing R component at the center of the surrounding structure is estimated using the surrounding color-ratios and the G component adjacent to the interpolated location. This takes advantage of available green information, which is more accurate due to a twice as frequent occurrence of the original G CFA components compared to the R and B components. The R components x(,.,~ are obtained as follows:
where ( r , s ) denotes an interpolated location or the center of the four original R components x~,,,),positioned at locations 5 = {(r-2,s -2),(r-2,s +2),(r+2,s -2),(r+2,s + 2 ) } which form the square-shape mask on the image lattice (Fig. Id). The normalized color-ratios are generated using these original R components x(,,)1 and the adjacent interpolated G components x [ ~ 557
46th International Symposium ElectronicS in Marine, ELMAR-2004, 16-18 June 2004,Zadar. Croatia
(4
(b)
(4
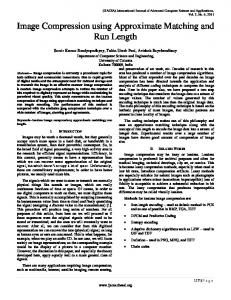
Fig. 2 Test color images: (a) Parrots, (b) Mountains, (c) Window. positioned one unit to the left compared to xlz,,),. The missing R component xlr,s)lis estimated using the mean normalized color-ratio and the interpolated G component x(,,.-,,~ positioned + p) is used to normalize the mean operand from the one unit to the left. Note that color-ratio to the intensity domain. Since the interpolation procedure is defined over the shifted inputs, the addition of -p returns the interpolated component into the desired range. The procedure generates the pattern depicted in Fig. 1 e. Analogously, the B components x(,.~)~are generated in a similar manner as follows:
where 5 = ( ( r-2,s -2), (r -2,s +2),(r +2,s - 2), (r + 2,s +2)} denotes the positions of the original B components x( 100. To produce results presented in sequence, we used the zooming solution with the value p = 256 which shifts the input components within 9 bit range. Using this normalization setting, the proposed zooming solution produced the best objective results. It can be seen that the proposed scheme clearly outperformed other considered zooming solutions, in terms of both MAE and MSE. Visual inspection of the images shown in Fig. 3 reveals that the proposed method produces the enlarged outputs with the most amount of sharpness among the tested methods. As it can be seen both CIZ (Fig. 3b) and LZ approaches (Fig. 3c) produce a number of color shifts and blurred details. However, when the proposed method is used (Fig. 3d), the output image with the increased spatial resolution is produced in a sharp form and at the same time, color 559
46th International Symposium Electronics in Marine, ELMAR-2004, 16-18 June 2004, Zadar, Croatia
impairments are significantly reduced. This behavior is more visible by inspecting the selected parts of the images shown in Fig. 4. It can be seen that the CZI scheme (Fig. 4b) produces visual impairments, aliasing effects and color artifacts. These are partially eliminated when the LZ scheme is used (Fig. 4c). The proposed scheme eliminates color shifts and produces images (Fig. 4d) with the higher similarity to the originals (Fig. 4a). It should be mentioned at this point that additional performance improvements can be obtained using sophisticated demosaicking solutions (e.g. [4],[6],[11],[12]) andor demosaicked image postprocessors [lo].
Table 1 Objective results obtained using the images shown in Fig. 2. Parrots
Mountains
Window
Method Proposed method
5.654 5.819 4.728
160.7 158.9 106.1
11.740 361.7 11.688 362.7 10.615 280.6
8.472 8.288 6.478
210.7 204.1
119.3
4. CONCLUSION A new zooming algorithm operating directly on Bayer CFA samples in a single-sensor digital camera pipeline was presented. The method is performed before CFA interpolation to reduce the computational complexity and operate on noise-free inputs. To produce the enlarged CFA image without color shifts and artifacts the method utilizes a normalized color-ratio model. This results in naturally colored images pleasing for viewing.
REFERENCES [l] S . Battiato, G. Gallo, and F. Stanco, A locally adaptive zooming algorithm for digital images, Image and Vision Computing, 20(1 l), 2002,805-812. [2] B.E. Bayer, Color imaging array, U.S. Patent 3 971 065, 1976. [3] D.R. Cok, Signal processing method and apparatus for producing interpolated chrominance values in a sampled color image signal, US Patent 4 642 678, 1987. [4] C. Cai, T.H. Yu, and S.K.Mitra, Saturation-based adaptive inverse gradient interpolation for Bayer pattern images, IEE Proc. Vision, Image, Signal Processing, 148(3), 2001,202-208. [5] A.M. Danvish, M.S. Bedair, S.I. Shaheen, Adaptive resampling algorithm for image zooming, IEE Proceedings - Vision, Image, SignaZ Processing, 144(4), 1997,207-212. [6] R. Kimmel, Demosaicing: image reconstruction from color CCD samples, IEEE Transactions on Image Processing, 8(9), 1999, 1221-1228. [7] K. Jenseen and D. Anastasiou, Subpixel edge localization and interpolation of still images, IEEE Transactions on Image Processing, 4(3), 1995,285-295. [SI P. Longere, Z. Xuemei, P.B. Delahunt,and D.H. Brainard, Perceptual assessment of demosaicing algorithm performance, Proceedings of rhe IEEE, 90( I), 2002, 123-132. [9] R. Lukac and K.N.Plataniotis, Digital camera zooming on the colour filter array, IEE Electronics Letters, 39(25), 2003, 1806-1807. [ 101R. Lukac, K. Martin, and K.N. Plataniotis, Demosaicked image postprocessing using local color ratios, IEEE Trans. on Circuit and Systems for Video Technology, 14(6), 2004. [11]R. Lukac, K.Martin, and K.N.Plataniotis, Digital camera zooming based on unified CFA image processing steps, IEEE Transactions on Consumer Electronics, 50( l), 2004. [12]R. Ramanath, W.E. Snyder, G.L. Bilbro, and W.A. Sander 111, “Demosaicking methods for Bayer color arrays,”J. Electronic Imaging, vol. 11, no. 3, pp. 306-3 15, Jul. 2002. [13] S. Thumhofer and S.K. Mitra, Edge-enhanced image zooming, Optical Engineering, 35, 1996. 1862-1869. 560