Content Based Automatic Zooming: Viewing Documents on Small Displays Patrick Chiu, Koichi Fujii*, Qiong Liu FX Palo Alto Laboratory, 3400 Hillview Ave., Bldg. 4, Palo Alto, CA 94304, USA Fuji Xerox, 430 Sakai, Nakai-machi, Ashigarakami-gun, Kanagawa 259-0157, Japan
*
{
[email protected]} ABSTRACT We present an automatic zooming technique that leverages content analysis for viewing a document page on a small display such as a mobile phone or PDA. The page can come from a scanned document (bitmap image) or an electronic document (text and graphics data plus metadata). The page with text and graphics is segmented into regions. For each region, a scale-distortion function is constructed based on image analysis of the signal distortion that occurs at different scales. During interactive viewing of the document, as the user navigates by moving the viewport around the page, the zoom factor is automatically adjusted by optimizing the scale-distortion functions of the regions visible in the viewport.
Categories and Subject Descriptors H5.2 [Information interfaces and presentation]: User Interfaces - Graphical user interfaces.
General Terms Algorithms, Design, Human Factors.
Keywords Automatic zooming, document image analysis, document viewing, small displays.
1. INTRODUCTION Since the development of basic zoomable user interfaces like Pad [11] and Pad++ [3], ongoing research has led to techniques for improving navigation (e.g. SDAZ[8], CAS[9]) or visualization (e.g. Collapse-to-Zoom[2]). More generally, theoretical discussions on fisheye views [5] have identified key elements for understanding these interfaces, such as degree of interest (DOI) functions, which can act as filters of information for display. Furthermore, space-scale diagrams [6] provide a framework for visual analysis and design of the dynamics of zooming interactions.
transformations of the fisheye optical lens analog, but the signal distortion that occurs when a fixed portion of content is scaled at varying zoom levels for display on a screen with discrete pixels. Through scale-distortion functions, we will show how signal distortion along with related document image analysis technologies (e.g. see [10]) can be applied to design a content based automatic zooming (CBAZ) visual interface. Before delving into the content analysis, we describe a use scenario for viewing documents on a small display, and how CBAZ can contribute to a better viewing experience.
2. VIEWING DOCUMENTS ON A SMALL DISPLAY On mobile phones and handheld devices with limited display space, it is challenging to view and navigate a document page efficiently. Typically, the user must manually scroll around and zoom in and out, and the viewing process is quite tedious because the user needs to press the scroll and zoom buttons many times. For example, using the Adobe Reader for mobile phones [1], each zoom operation is accessed through a menu and requires 3 button presses. To zoom to a specific scale (e.g. 80%, 125%), it takes 8 or 9 button presses to navigate the menu and enter the scale value on the keypad. While the user can view the document using a fixed scale that is suitable for comfortable reading of the document’s body text, this makes navigation more inefficient when the user has to read text
On the other hand, the dynamics of distortion has not been sufficiently studied in zooming. The distortion that we are interested in examining in this paper is not the size and distance
Permission to make digital or hard copies of all or part of this work for personal or classroom use is granted without fee provided that copies are not made or distributed for profit or commercial advantage and that copies bear this notice and the full citation on the first page. To copy otherwise, or republish, to post on servers or to redistribute to lists, requires prior specific permission and/or a fee. MM’08, October 26–31, 2008, Vancouver, British Columbia, Canada. Copyright 2008 ACM 978-1-60558-303-7/08/10...$5.00.
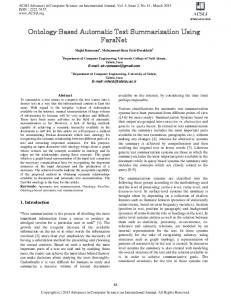
Figure 1. The zoom factor is automatically adjusted to optimize viewing of the contents in the viewport.
that is larger (e.g. title and heading text). The reason is that less of the larger text can fit on the screen, and more scroll operations are needed to move through the larger text. This problem is more pronounced when the user has to scroll back and forth to read a column of text that does not fit inside the width of the screen. When there are multiple regions in the viewport, the contents in each region may have a different range of acceptable scales for effective viewing. CBAZ addresses this issue by finding an optimal scale for a set of regions in the viewport. With the CBAZ technique, zooming is automatically performed as the user navigates, adjusting the scale of the viewport depending on which portions of the content are being viewed. This scale is uniform so that the original layout design is preserved. By cutting down on the number of manual zoom operations, the viewing experience becomes faster and less tedious. Just as important, since an optimal amount of content is shown on the display, the screen area is more effectively utilized.
bounding box size, aspect ratio, and density; and the class of each connected component is decided according to its properties. Since a region is a cluster of components, the region can be classified based on the properties of its components; e.g. a cluster of “character” components is classified as a “text” region. An estimate of the font size is also computed. Non-text regions can be classified as “graphics” regions. For example, a typical result computed by our classification module is shown in Fig. 3: the gray regions are classified as “text” and the blue region “graphics”. For further details on basic document image analysis techniques, see [10].
Viewing a document with the CBAZ method is illustrated in Fig. 1. A document page (Fig. 2) is segmented into regions (Fig. 3). For each region, a scale-distortion function is constructed based on content analysis (Fig. 4). When the user navigates by moving the viewport around the page, the zoom factors are automatically adjusted to those optimized by the scale-distortion functions. The set of zoom values over the page is visualized in Fig. 5.
3. CONTENT ANALYSIS While CBAZ enables a really simple user interface, there is a substantial amount of computation behind it. This is especially true for documents that are bitmap images (e.g. scanned documents), for which image segmentation algorithms are required to determine the regions on each page. Even for documents with structured data (e.g. PDF, Microsoft Office, Web pages, etc.), the regions containing graphics and figures require content analysis computations to model their scale-distortion functions.
Figure 2. A document page image.
There are two parts to the content analysis: page segmentation and region classification, and computing the scale-distortion functions for the regions. We go into each of these in more detail.
3.1 Page Segmentation and Region Classification The page is handled differently depending on whether it is a bitmap image or structured data. For the latter, the segmentation is relatively easy because the metadata, in particular the layout description, can be directly extracted with the appropriate software API or utility. The classification of text and graphics regions can also be obtained from the metadata. For a bitmap page image, segmentation is performed by analyzing the pixels of the image. This can be achieved by finding connected components and clusters to determine the regions. As an example, for the scanned document page image in Fig. 2, the result computed by our segmentation module is shown in Fig. 3.
Figure 3. Segmentation and classification of the document page image from Fig. 2. Each solid rectangle shows a region, and the color indicates the classification (gray = text, blue = graphics).
To classify whether a region is text or graphics, the image features are analyzed. Our classification module works in the following way. First, the bitmap image is preprocessed by binarization. Next the connected components are extracted by a labeling technique. For each component, we calculate properties such as
3.2 Scale-Distortion Functions We associate to each region a scale-distortion function (or scdfunction for short). The scd-function characterizes how the signal distortion changes as the scale changes for the region.
The scd-function y = f(x) can be computed as follows. We produce a set of sample points by computing the distortion on a sequence of x-values or scales. From the sample points, we can do a linear interpolation, a polynomial interpolation, or use a spline representation. In our example, for the region of the figure contained in the upper-left part of the page in Fig. 2 (its bounding box is shown in blue in Fig. 3), we compute the distortion for scales s = {0.1, 0.2, 0.3, …, 1.0}. Next, for each s, we construct a scaled image by scaling the corresponding region in the reference image by s. The reference image is defined as the image (scaled from the input image) that displays the body text at a suitable size for the target screen. Then we define the distortion to be the square root of the sum of squares of the differences in pixel values in the reference image to the corresponding pixel values in the scaled image.1 The graphs of the scd-functions for the regions in Fig. 3 are shown in Fig. 4. Typically, each pixel of a scaled-down image will correspond to multiple pixels in the reference image (e.g. for s = 0.5, each pixel in the scaled-down image is mapped to four pixels in the reference image). We also normalize the distortion values by using the number of pixels in the reference region. For determining the difference between pixels, we use the difference in luminance value. Alternatively, one can use the distance in color space, or some other measure of difference in pixel features.
these regions with weights based on the distances of the regions to the viewport center, we compute an optimal zoom value. We describe a way to do this optimization that leads to a simple formula. First, we model the scd-functions by a polynomial interpolation of the sample points. So for M regions and polynomial interpolation of order n, a scd-function is given by: yi = fi (x) = ai0 + ai1x + ai2x2 + … + ainxn, i = 0, 1, 2, …, M−1. For each fi(x), we determine a cutoff value xi*. This can be based on a threshold of distortion loss. The cutoff value is defined to be the x-value at which fi(x) crosses the threshold. Heuristically, the cutoff value is the scale that optimizes the viewing of the i-th region in the viewport. The threshold will depend on the screen resolution and pixel density. The cutoff value can also make use of the features for the specific type of region: font size for a text region, face size for an image region with faces, etc. For example, in the case of text, the cutoff value is the scale value x that optimizes displaying the text region’s font on the target screen. For the weights, we define wi to be the inverse square of the distance from the i-th region to the center of the viewport. The distance is normalized by dividing by the radius of the display. Then the first order solution to the optimal scale factor is given by the formula:
x=
∑wa x* ∑wa
0 ≤i < M
i
0 ≤i < M
Figure 4. Scale distortion functions of the regions in Fig. 3. The bottom function (blue) corresponds to the graphics segment on the upper-left corner of the page. The top function (green) corresponds to the segment containing the title at the top of the page.
4. COMPUTING THE ZOOM FACTORS As the user navigates by moving the viewport around the document page, various regions will become visible. The viewport zoom factor is adjusted automatically by taking into account these regions in the viewport. Using the scd-functions of 1
It is also possible to define distortion in the frequency domain; the results will be similar.
i1
i
i
i1
Note 1: The zero order solution, which is to take a simple weighted average of x*i, has some drawbacks. For instance, suppose the viewport contains one text region and one image region, where the image is a simple block graphic or logo (e.g. Red Cross logo). Such an image region will have a flat scdfunction because it suffers little distortion loss when scaled down. With a simple weighted average of x*i, the text scale will be altered too much and the text viewing experience is compromised; while the image scale is also altered but the image viewing experience is not compromised (little distortion change). On the other hand, with the first order solution given by the formula above in which terms from a flat scd-function have relatively small contributions, the whole text and image combination will be more legible. Note 2: For practical purposes, it may be desirable to compute a table of zoom factors for each viewport center location (x, y). One way to do this is to simplify the zoom factor computation by including all the regions for each viewport location, with the viewport at a fixed height suitable for viewing the reference image. The regions outside the viewport will have minor contributions due to the small weights for regions far from the viewport center. For the example page image in Fig. 2, a 3D plot of the zoom factors is shown in Fig. 5. Each grid point (x, y) represents the center of a viewport with size 320x240 at height zero, and the zvalue is the optimal zoom value.
viewport; the viewing experience was “jumpy” during navigation and proved to be unsatisfying. The next iteration attempted to balance the zoom factor of all the regions visible in the viewport, but only by averaging their x*i values (see Note 1 above). Additional testing made us aware of the fact that some graphics and logos can have a wide range of acceptable zoom factors, and when these graphics regions appear in combination with other text or graphics regions, it is possible to improve the balance of scales by going from a zero-order to a first-order solution.
Figure 5. Optimal zoom values for the page in Fig. 2. The grid point (0, 0) corresponds to the top left corner of the page.
5. RELATED WORK Automatic Zooming for Navigation Speed-dependent automatic zooming (SDAZ) [8] was developed for browsing a document with a large number of pages; in contrast, CBAZ is for viewing the contents of a single page. With SDAZ, as the user scrolls faster, the viewport is zoomed out so that perceptually the flow of the page images appears to move at a constant rate. Content-aware scrolling (CAS) [9] employs a variation of SDAZ for moving faster through unimportant regions, which are essentially spaces between regions of text lines. Automatic Pan and Zoom Multimedia Thumbnails [4] employs content analysis to extract document elements and visual focus points, and automatically determines a reading order based on the layout. It generates a panand-zoom “movie trailer” for the document based on the reading order path. MobiPicture [12] is similar to Multimedia Thumbnails but targeted for pictures. It detects regions of interest within a picture and generates a path, and a pan-and-zoom animation is created. The CBAZ technique differs from automatic pan-and-zoom techniques in that it is more interactive, making it more flexible since the user is in control of the reading order and speed. Collapse-to-Zoom Collapse-to-Zoom [2] is a technique for PDAs with stylus input for viewing Web pages, which often contain uninteresting areas (e.g. advertisement banners). The user makes a gesture with the stylus; its location and size demarcate the region and its direction defines the operation. The regions are not automatically detected, as in CBAZ. Once regions are collapsed, the empty space is taken up by zooming in on the remaining parts of the page.
6. PROTOTYPE TESTING We implemented an application in Java for a desktop PC to facilitate rapid prototyping and iterative design (see Fig. 1). Through informal testing of the prototype among project members, we learned a number of things. An early version only optimized the zoom factor for a single region at the center of the
A limitation that we noticed is that sometimes it does not zoom to a level desired by the user. One remedy is to provide a way in the user interface to manually override the automatic zooming when that occurs. Another limitation is that image segmentation is inherently a hard problem; however, some common errors in segmentation (e.g. a region broken into two) do not produce adverse effects. For future work, we plan to do more extensive usability testing and evaluate the effectiveness of the CBAZ technique over a wide variety of document genres. We also plan to apply more advanced machine learning techniques (e.g. see [7]) to improve the document image analysis.
7. ACKNOWLEDGMENTS We thank Scott Carter, Francine Chen, Yuzuru Suzuki, and Lynn Wilcox for valuable comments on this work.
8. REFERENCES [1] Adobe Reader 7 for Symbian OS. Adobe Corp. (2007). [2] Baudisch, P., Xie, X., Wang, C., Ma, W.-Y. Collapse-tozoom: viewing web pages on small screen devices by interactively removing irrelevant content. Proceedings of UIST ’04, pp. 91-94. [3] Bederson, B. B. and Hollan, J.D., Pad++: A zooming graphical interface for exploring alternate interface physics. Proceedings of UIST ’94, pp. 17-26. [4] Erol, B., Berkner, K., Joshi, S. Multimedia thumbnails for documents. Proceedings ACM Multimedia ’06, pp. 231-240. [5] Furnas, G.W., A Fisheye Follow-up: Further reflections on Focus + Context. Proceedings of CHI ’06, pp. 999-1008. [6] Furnas, G.W. and Bederson, B. B. Space-Scale Diagrams: Understanding multiscale interfaces. Proceedings of CHI ’95, pp. 234-241. [7] Gong, Y., Xu, W. Machine Learning for Multimedia Content Analysis. Springer, 2007. [8] Igarashi, T., Hinckley, K. Speed-dependent automatic zooming for browsing large documents. Proceedings of UIST ’00, pp. 139-148. [9] Ishak, E.W., Feiner, S.K. Content-Aware Scrolling. Proceedings of UIST ’06, pp. 139-148. [10] O’Gorman, L., Kasturi, R. Document Image Analysis. IEEE Press, 1995. [11] Perlin, K. and Fox, D., Pad: An alternative approach to the computer interface. Proceedings of Siggraph ’93, pp. 57-64. [12] Wang, M.-Y., Xie, X. , Ma, W-Y., H.-J. Zhang. MobiPicture - Browsing pictures on mobile devices (Demo). Proceedings of ACM Multimedia ’03, pp. 106-107.