literature [1, 3, 5, 7, 11]. B-Course is implemented as an Application Service .... Bayesian framework a good dependence model is one with a high probability. ... user is first prompted to initiate the dedicated server to start searching for a good ...
X. Wu. IEEE Computer Society Press, 2001.
Bayesian Data Mining on the Web with B-Course Petri Myllym¨aki, Tomi Silander, Henry Tirri, Pekka Uronen Complex Systems Computation Group (CoSCo) P.O.Box 26, Department of Computer Science, FIN-00014 University of Helsinki, Finland URL: http://www.cs.Helsinki.FI/research/cosco/
Abstract
networks. B-Course supports inference on the constructed Bayesian network model as well as exporting the model for further use. We have chosen the Bayesian modeling framework, since we find it easier to understand than the classical statistical (frequentist) framework, and from our experience it seems that it is more understandable to the users also. We also feel that it has benefits over the classical framework, avoiding some of the anomalies caused by the hidden assumptions underlying the standard methods developed decades ago. This is not to say that Bayesian approaches do not have problems of their own — both theoretical and practical problems are lively discussed in the literature [1, 3, 5, 7, 11]. B-Course is implemented as an Application Service Provider (ASP), an architectural choice we feel is very natural in the context of data analysis: there is no downloading or installation of software, and the computational load for searching models is allocated to a server farm. B-Course can be used with most web-browsers (even Lynx), and only requires the user data to be a text file with data presented in a tabular format typical to statistical packages. In this paper we describe the main design principles of B-Course and present results of preliminary systematic empirical validation experiments performed with B-Course. For a more detailed discussion of the methodological aspects of the methods underlying the B-Course implementation can be found in [8]. We also strongly encourage the reader to experiment with B-Course by using the ”ready-made trails” provided by the service, or with their own datasets if available.
B-Course is a free1 web-based Bayesian data mining service. This service allows the users to analyze their own data for multivariate probabilistic dependencies represented as Bayesian network models. In addition to this, B-Course also offers facilities for inferring certain type of causal dependencies from the data. The software is especially suitable for educational purposes as the tutorial style userfriendly interface intertwines the steps in the data analysis with support material that gives an informal introduction to the Bayesian approach adopted. Nevertheless, although the analysis methods, modeling assumptions and restrictions are totally transparent to the user, this transparency is not achieved at the expense of analysis power: with the restrictions stated in the support material, B-Course is a powerful analysis tool exploiting several theoretically elaborate results developed recently in the fields of Bayesian and causal modeling.
1. Introduction In many domains, when practitioners in various fields apply data analysis tools, the underlying assumptions and restrictions are not clear to the user, and the complicated nature of the software encourages the users to a ”black box” approach where default parameter values are used without any understanding of the actual modeling and analysis task. The B-Course tool (http://b-course.cs.helsinki.fi) is an attempt to offer a sophisticated multivariate modeling tool that can also be understood by applied practitioners. Although it is a first step in this direction, it makes a serious attempt to give an informal yet comprehensive introduction to the approach adopted. One of the design choices for B-Course was to use the Bayesian framework as indicated by the fact that the dependency models constructed are represented by Bayesian
2. Dependency modeling with Bayesian networks In our context, dependence modeling means finding the model of the probabilistic dependences of the variables. In dependency modeling one tries to find dependencies between all the variables in the data. Since we are using probabilistic models, in more technical terms this means modeling the joint probability distribution. Dependencies can also be used to speculate about causalities that might cause them.
1 B-Course can be freely used for educational and research purposes only.
0-7695-1119-8/01 $17.00 2001 IEEE
626
Besides revealing the domain structure of the data, dependency models can be used to infer probabilities of any set of variables given any (other) set of variables. This will lead to a ”game” where one can interactively study the model by probing it as implemented by the inference part in the B-Course software. For the above purposes, in B-Course one will only need something that is called pairwise conditional dependencies, since that is the only type of dependency that appears in our models (it should be noted that this notion should not be confused with pairwise correlation). Saying that variables A and B are dependent on each other means that if one knows what the value of variable A is, it helps one to guess what the value of variable B is. To illustrate the type of models B-Course searches for, let us look at a small example. For our present purposes it is not necessary to study the models in great detail , the example just tries to give an idea about the dependency models. So let us assume that our model has four variables A, B, C and D. Following list of statements is a dependency model:
only considers models for discrete data and it discretizes automatically all the variables that appear to be continuous. Secondly, B-Course only considers dependency models where the list of dependencies can be represented in a graphical format using Bayesian network structures [9, 4]. For example, the list of dependencies in the example can be represented as a Bayesian network in Figure 1. An important property of Bayesian network models is that the joint probability distribution over the model variables factorizes to a product conditional probability distributions, one for each variable (see, e.g., the tutorial on Bayesian networks in data mining [6]). This subset of models is interesting, but it has its limitations too. More specifically, if the variables of our model are in causal relationships with each other, and if in our domain there are no latent variables (i.e., variables that for some reason are not included in our data) that have causal influence on the variables of our model, then the dependencies caused by these causal relationships can be described by a Bayesian network. On the other hand, latent variables often induce dependencies, that cannot be described accurately by any Bayesian network structure. That can severely restrict our ability to automatically infer something about causalities just based on statistical dependencies. Using the Bayesian approach provides for a way to recognize a good model when the software finds one: in the Bayesian framework a good dependence model is one with a high probability. Notice that it takes a Bayesian approach to speak about the probability of the dependencies. Further discussions on this topic can be found in [8].
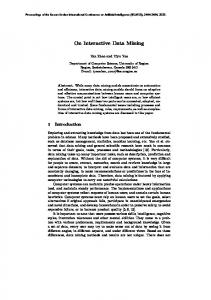
� A and B are dependent on each other if we know something about C or D (or both). � A and C are dependent on each other no matter what we know and what we don’t know about B or D (or both). � B and C are dependent on each other no matter what we know and what we don’t know about A or D (or both). � C and D are dependent on each other no matter what we know and what we don’t know about A or B (or both). � There are no other dependencies that do not follow from those listed above.
3. Walking through B-Course Using the B-Course data service follows a simple three step procedure (Data upload!Model search!Model analysis) for building a Bayesian Network dependency model. As B-Course is used via a Web-browser, user can freely use the browser features (”Back” and ”Forward” buttons, resizing of the window etc.) during this procedure. In particular, a first time user is encouraged to follow the links leading to pages explaining many of the concepts discussed in the interface. These pages form the ”B-Course library” that is maintained and updated every time a new feature is added to the analysis. Of the three main steps, the last one is the most complex one as it allows the user to interactively use the inferred model, export both the graphical and textual representations of the model, check for strengths of the dependencies etc. It should be emphasized that there are no parameter settings involved except the fact that the user decides the length of the search phase by interactively inspecting the progress of search. Discretization, handling of missing data, setting non-informative priors and other technical details are han-
Figure 1. A Bayesian network representing the example list of dependencies. This set of statements about dependencies is called a dependency model. Obviously, if the set of dependencies is large, such a descriptive list representation becomes impractical and hard to understand. In its full generality the problem of finding the best dependency model in an arbitrary set of models is intractable (see the discussion in [11, 3]). In order to make the task of creating dependency models out of data computationally feasible, B-Course makes two important restrictions to the set of dependency models it considers. Firstly, B-Course 627
dled automatically by the software. In the following we give a short description of each of these main steps. Step 1: Data upload. B-Course attempts to give a simple, yet accurate description of the format of the data it accepts. In general it expects the data to be in tab-limited ASCII format with additional header line containing the names of the variables. This format is readily available in most of the database, spreadsheet and statistical software. B-Course also allows for missing data. Uploading the data is implemented by standard HTMLform File input, that sends the data file to the server. As B-Course is currently implemented by using a server farm, the front end server directs the data to one of the servers in B-Course server pool in order to do load-balancing. B-Course notifies user of the possible problems during the data upload. It also gives simple descriptive statistics of each variable so that the user can verify the upload was successful. At this point user can also exclude the variables he/she does not want to be part of the model, such as data ID etc. Step 2: Model search phase. In the model search phase the user is first prompted to initiate the dedicated server to start searching for a good Bayesian network model for the data. Once the search is on, the user is lead to a page showing the current best model. User can now study the structure of this model, but she can also ask for an updated report on the search. B-Course then again shows the current best model together with a report how much better the current model is compared to the previous one (assuming some improvement has occurred). The search can be stopped any time — for example, if no progress in search has been gained for some time — or the user can wait until the system reaches the search time limit (currently 15 minutes). Searching for the dependency model is computationally very intensive (the problem is NP hard) and in any realistic case with many variables it is impossible to search exhaustively the whole search space. Step 3: Analysis of the model found. Once the search has ended, B-Course gives the final report together with a list of ways to study the selected dependency model. The final report displays the constructed graph structure which the user can save if needed. The user is also given a report on strengths of the pairwise unconditional dependencies (i.e., arcs in the constructed Bayesian network) of the model. In addition to the standard Bayesian network representation, B-Course also offers two graphical representations describing the possible causal relationships that may have caused the dependencies of the model. These causal graphs are based on the calculus introduced by Pearl [10]. As far as we know this feature is unique to B-Course, we are not aware of any other software package supporting Pearl’s causal analysis. B-Course also provides interactive tools called ”play-
grounds” that allow user to perform inference on the constructed Bayesian network. Several playgrounds are offered in order to support browsers with various capabilities. The ”Vanilla playground” is intended to be used with ”low-end” browsers with restricted graphical capabilities and works even with text-only browsers such as Lynx. The ”Java playground” requires a Java-enabled browser, but then offers a more flexible graphical user interface with zooming, pop-up displays of the distributions attached to variable nodes etc. In addition to using B-Course playgrounds online for model inspection, the model can also be exported in a format accepted by Hugin-software in order to allow off-line use of the model.
4. Empirical validation When designing a learning algorithm to construct models from data sets with non-informative prior information (i.e., no preference for the structure in advance), a challenging and interesting task is to evaluate the ”quality” of the learning algorithm. In addition to the theoretical justifications of the Bayesian model construction, with such an analysis tool as B-Course, empirical validation is a necessary step in the development process. There are several possible ways to study the performance of a model construction algorithm, and many of the schemes are based on simulating the future prediction tasks by reusing the data available, e.g., with cross-validation methods. These approaches have problems of their own and they tend to be complex for cases where one is interested in probabilistic models for the joint distributions as opposed to for example classification. Therefore in many cases in the literature the so-called synthetic or ”Golden Standard” approach is used to evaluate the learning algorithm. In this approach one first selects a ”true model” (Golden standard) and then generates data stochastically from this model. The quality of the learning algorithm is then judged by its ability to reconstruct this model from the generated data. In addition to the already quite extensive use with real data sets, B-Course was also tested using synthetic data sets generated from known Bayesian networks. In this case the particular interest in these experiments was to find out how well the B-Course learner can ”recover” the Golden Standard network for Bayesian networks of varying complexity using data sets of different sizes. Following the dependency modeling aspects underlying B-Course, the main interest was in comparing the structural differences, not parameters. Several sets of tests were performed by varying the network size (5, 15, and 50 nodes) and the dependency structure complexity against the maximum of n2 arcs (0%, i.e., all independent, 10%, and 40% of possible structural dependencies). In addition, the average node incoming/outgoing degree (i.e., the number of arcs pointing to or from a node) 628
was varied (1, 3, and 5). Finally the construction rate (i.e., the ”statistical power”) was studied by varying the size of the generated data set from 100 to 10000 data vectors. The resulting Bayesian networks were compared to the generating network by comparing the skeletons, i.e., the underlying undirected structure, and the V-structures which together define an equivalence relation among the networks [9]. The results clearly validated that the model search in BCourse finds dependency structures present in the underlying data generating mechanism. For the small networks (5 nodes), regardless of the structure complexity in almost all the cases the correct network could be recovered with 100 to 1000 data vectors. Even if this was not the case, the differences in B-Course inferred network and the ”true” dependency model were only 1-2 missing dependencies. Similarly the performance with 15 node random networks was comparable (typically 1-2 missing dependencies or 1 incorrect V-structure), albeit now the data set sizes needed to recover the network were typically 1000 as opposed to 100 sufficient for the smaller networks. As expected, when the network size was increased to 50 with a notable connection complexity (0.1 to 0.4), even the data set sizes of 10000 were sufficient to recover the generating structure only very approximatively. The typical amount of missing dependencies varied from 10% to 50%. However, one has to remember that the amount of data used for these cases is way too small for such complex models by any means (networks with more than 1000 arcs with 10000 to 15000 parameters!). The main purpose of the tests with larger networks was to find out, whether the model search produces ”spurious dependencies”, i.e., adds dependencies that only reflect the noise in the data. In this respect B-Course is extremely well-behaving — it almost never adds a dependency where there should not be one and prefers simpler models in the light of lesser amounts of evidence (i.e., smaller data sets).
automated data analysis tool, as was the goal. Nevertheless, although the initial goals of the B-Course development project have been met with the current version of the software, the current implementation leaves naturally room for many improvements. For example, the modeling assumptions allowing us to offer the users a “nonparametric” tool are not necessarily always very reasonable. Furthermore, the question of choosing an objective “noninformative” prior for the model parameters turned out to be a most complex issue, linking this superficially simple task directly to the most fundamental problems in statistics. On the other hand, as the chosen Bayesian approach offers an elegant framework for integrating subjective knowledge with empirical observations, it would be nice to be able to offer the more sophisticated users a possibility for expressing their expertise as a prior distribution on the dependency statements, or on the model parameters. Finally, it is evident that uncertainty on the result of the analysis should be expressed in a more elaborate manner than with the straightforward local analysis of the importance of the individual arcs. These issues will be addressed when developing future versions of the B-Course data analysis service. Acknowledgments. This research has been financially supported by the National Technology Agency, and the Academy of Finland.
References [1] J. Berger. Statistical Decision Theory and Bayesian Analysis. Springer-Verlag, New York, 1985. [2] J. Bernardo, J. Berger, A. Dawid, and A. Smith, editors. Bayesian Statistics 4. Oxford University Press, 1992. [3] J. Bernardo and A. Smith. Bayesian theory. John Wiley, 1994. [4] R. Cowell, P. Dawid, S. Lauritzen, and D. Spiegelhalter. Probabilistic Networks and Expert Systems. Springer, New York, NY, 1999. [5] A. Dawid. Prequential analysis, stochastic complexity and Bayesian inference. In Bernardo et al. [2], pages 109–125. [6] D. Heckerman. Bayesian networks for data mining. Data Mining and Knowledge Discovery, 1(1):79–119, 1997. [7] H. Jeffreys. Theory of Probability. Clarendon Press, Oxford, 1939. [8] P. Myllym¨aki, T. Silander, H. Tirri, and P. Uronen. B-course: A web service for Bayesian data analysis. In Proceedings of The Thirteenth IEEE International Conference on Tools with Artificial Intelligence, Dallas, USA, November 2001. IEEE Computer Society Press. [9] J. Pearl. Probabilistic Reasoning in Intelligent Systems: Networks of Plausible Inference. Morgan Kaufmann Publishers, San Mateo, CA, 1988. [10] J. Pearl. Causality: Models, Reasoning and Inference. Cambridge University Press, 2000. [11] J. Rissanen. Stochastic Complexity in Statistical Inquiry. World Scientific Publishing Company, New Jersey, 1989.
5. Conclusions and future work The two main design principles in building the current version of B-Course were transparency and ease of use. On one hand, we wanted to build a system where the modeling assumptions are explicitly visible so that applied practitioners can fully understand what the results of the analysis of their data mean. On the other hand, we wanted the data analysis to be fully automated so that the users would not have play with parameters the meaning of which would be clear only to modeling experts. These two requirements were met by adopting the Bayesian dependence modeling approach: the basic theoretical concepts in this probabilistic framework seem to be easier to understand than the concepts of classical frequentist statistics. By using a series of explicitly stated assumptions, we were also able to get rid of all the model parameters, leaving the user with a fully 629