Bayesian Hierarchical Models for ADR detection using different. Criteria to group the adverse reactions. Ruth E Farmer, David Prieto -Merino, S J Evans. London ...
Bayesian Hierarchical Models for ADR detection using different Criteria to group the adverse reactions Ruth E Farmer, David Prieto -Merino, S J Evans. London School of Hygiene and Tropical Medicine Conflict of interest: No conflict of interest exists. This poster does not represent the opinions of the WHO. We are extremely grateful to the UMC who have allowed us access to their data.
Background: Using spontaneous reporting databases (SRDs) to detect signals of adverse drug reactions (ADRs) is vital in spite of the problems with multiple testing. Berry & Berry (2004) proposed a 3 level Bayesian hierarchical model (BHM) using MedDRA groupings. Although these groupings are medically sound, the may not reflect terms that occur or are reported together. Prieto & Evans (2009) suggest that data driven groupings (DDGs) would be more useful in order to reduce false positive findings.
Objectives: To investigate alternative data driven groupings other than the WHO Adverse reaction terminology (ART) groupings or any other purely biological classification system of Adverse Events (AEs). This includes assessing the differences in results of BHMs using different kinds of groupings , and also assessing the biological plausibility of DDGs and their sensitivity to clustering techniques.
Methods:
5
6
11
3
7
28
3
5
GASTRO-INTESTINAL SYSTEM 13
3
21
9
3
1
RESPIRATORY SYSTEM
21
11
21
5
SKIN AND APPENDAGES
12
12
24
3
Total
57
29
73
45
ART classification
NERVOUS SYSTEM
7
8
9
10
Total
10
7
27
101
16
27
24
121
1
1
4
4
68
3
1
16
2
8
81
9
8
43
40
63
371
4
4
C & P NERVOUS SYSTEM RESPIRATORY SYSTEM RESPIRATORY SYSTEM RESPIRATORY SYSTEM RESPIRATORY SYSTEM C & P NERVOUS SYSTEM GASTRO-INTESTINAL SYSTEM C & P NERVOUS SYSTEM RESPIRATORY SYSTEM
Table 2: ART groups defined by WHO ART classification compared with groupings obtained using complete linkage clustering algorithm with correlation as a proximity measure
NEUROPATHY HYPOXIA RESPIRATORY DISORDER RESPIRATORY INSUFFICIENCY ATELECTASIS NEUROPATHY PERIPHERAL MUSCOSITIS NOS POLYNEUROPATHY RESPIRATORY DISTRESS SYNDROME
0.3 0.13 0.23 0.46 0.7 0.52 0.47 0.16
0.44 0.68 0.37 0.15 0.49 0.25 0.41
0.35 0.16 0.04 0.15 0.09 0.29
0.15 0.19 0.18 0.09 0.25
POLYNEUROPATHY
4
MUSCOSITIS NOS
3
NEUROPATHY PERIPHERAL
2
RESPIRATORY DISORDER
1
NEUROPATHY
complete linkage correlation cluster analysis using all drugs
HYPOXIA
Clustering Results:
ATELECTASIS
Table 1: representation of SRD data for a particular drug and AR combination.
INRESPIRATORY SUFFICIENCY
Marginal totals Oi. and O.j , and total O.. as defined in table 1 were calculated for each adverse reaction term and 623 different drugs using the WHO database “Vigibase”. PRRs (Evans 2001) and a statistic here denoted as OME were calculated for 168,210 drug AE combinations. The OME statistic was used in a complete linkage hierarchical clustering method, with both Euclidean distance (DDG 1) and correlation (DDG 2) used as proximity measures. OME was categorised by percentiles when using Euclidean distance. The use of this statistic in the clustering aims to distinguish between ADR drug combinations where there is no association or not enough information, and those drugs which may be protective against an AE. Clustering was performed including all 623 drugs, and then excluding particular drugs of interest which would be evaluated in the BHM. The resulting groupings of 371 ADRs from four body systems were examined in order to assess their plausibility, and their consistency when different drugs were removed and/or different proximity measures were used. These groupings were then applied to a BHM to detect potential ADRs for five drugs of interest.
0.53 0.17 0.15 0.54 0.55 0.25 0.17 0.08 0.32 0.24
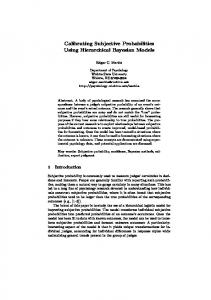
Figure 1: Example of ADRs that are consistently grouped together regardless of drug inclusion/exclusion and the observed correlations between them.
Clustering was sensitive the clustering technique used. For example using Euclidean distance resulted in an optimum number of three groups, whereas correlation resulted in ten groups being the optimum number. The distribution of ADRs between these groups in comparison to original WHO ART groupings is shown in table 2. These ten groups were somewhat dependent on which drugs are included in the analysis. As an example, AEs such as hypercapnia, peritonitis and dry skin group together , until either drug L03AB (Interferons) or M01AH (Coxibs) are excluded, and then they are placed in separate groups. However, there were also many consistencies seen between groupings. Figure 1 shows the correlation between nine example ADRs that were consistently grouped together regardless of which drugs were included. These were not all from the same original WHO ART group. ART Preferred Term Rash Headache Constipation Diarrhoea Nausea Anus disorder Hiccup Tongue ulcerations Proctalgia Throat tightness Change in bowel habits Bowel motility disorder Migrane Fixed eruption Acute Generalized Exanthematous Pustulosis
ART Grouping PRR (95% CrI) 1.25 (1.19 , 1.31)
Euclidean DDG PRR (95% CrI) 1.25 (1.19 , 1.31)
Correlation DDG PRR (95% CrI) 1.25 (1.19 , 1.31)
1.30 (1.24 , 1.37)
1.31 (1.25 , 1.38)
1.30 (1.24 , 1.37)
1.20 (1.10 , 1.30) 1.57 (1.51 , 1.64) 1.10 (1.04 , 1.15)
1.20 (1.11 , 1.29) 1.57 (1.51 , 1.63) 1.1 (1.04 , 1.15)
1.20 (1.1 , 1.3) 1.57 (1.51 , 1.64) 1.09 (1.04 , 1.14)
1.83 (1.11 , 2.81)
1.56 (0.96 , 2.39)
1.93 (1.14 , 2.98)
1.36 (1.02 , 1.74)
1.29 (0.96 , 1.67)
1.30 (1.00 , 1.64)
1.66 (1.09 , 2.34)
1.49 (0.99 , 2.13)
1.68 (1.10 , 2.50)
1.6 (1.00 , 2.41)
1.39 (0.85 , 2.06)
1.57 (0.95 , 2.36)
1.19 (0.96 , 1.45)
1.26 (1.01 , 1.52)
1.21 (0.98 , 1.46)
1.55 (1.04 , 2.19)
1.41 (0.94 , 1.99)
1.52 (0.99 , 2.20)
1.57 (1.00 , 2.27)
1.38 (0.90 , 2.01)
1.52 (0.96 , 2.25)
1.16 (0.96 , 1.39)
1.19 (0.99 , 1.42)
1.20 (1.00 , 1.40)
1.37 (0.99 , 1.83)
1.45 (0.95 , 2.09)
1.43 (1.02 , 1.96)
1.39 (1.07 , 1.81)
1.43 (1.01 , 1.96)
1.31 (0.95 , 1.76)
Table 3: Examples of PRRs and 95% CrI’s of ADRs for Proton Pump Inhibitors estimated by the three different models. Green indicates ADR no longer flagged compared to ART group model, red indicates ADR becomes flagged.
WHO
DDG 1
DDG 2
Group
Mean & 95% CrI
1 2 3
0.24 (0.16 , 0.35) 0.29 (0.23 , 0.37) 0.49 (0.39 , 0.61)
4 1 2 3 1 2 3 4 5 6 7 8 9 10
0.46 (0.38 , 0.57) 0.46 (0.4 , 0.52) 0.43 (0.35 , 0.54) 0.23 (0.17 , 0.32) 0.22 (0.14 , 0.34) 0.20 (0.07 , 0.43) 0.54 (0.36 , 0.79) 0.33 (0.23 , 0.45) 0.24 (0.09 , 0.45) 0.30 (0.20 , 0.43) 0.34 (0.24 , 0.47) 0.38 (0.22 , 0.62) 0.36 (0.26 , 0.49) 0.27 (0.03 , 1.01)
Table 4: Estimates of the SD of the PRRs in each group within the BHM. Taken from model estimating PRRs for Benzodiazepine Derivatives.
BHM Comparisons: All three models appear to work well in terms of identifying potential ADRs. Table 3 shows estimates of PRRs for some of the established ADR’s for Proton Pump Inhibitors, which all three models “flag “ (PRR & 95% Posterior Credibility Interval (CrI) >1), along with some example ADRs where the models differ in their conclusions. As an example, the WHO model flags hiccups as a potential ADR, whereas the two DDG models do not. The results from the two DDG models are not always consistent in terms of conclusions but generally these differences were small. Overall, the DDGs seem to produce more homogeneous groupings in terms of PRRs as demonstrated by the posterior estimates of the SD for each group within the BHM (Table 4).
Figure 2: Posterior mean PRR and 95% CrI for example ADRs for Benzodiazepine Derivatives for two models. BHM with WHO groupings, and BHM with correlations DDGs. Dividing lines represent the segregation of ADRs by the correlation DDG.
Conclusions: Data driven clustering of ADRs seem sensitive to what drugs and/or techniques are used. These differences in DDGs hardly changed conclusions from the BHM, but differences were seen when using WHO-ART groups. DDGs do appear to produce more internally correlated groupings but more research is needed to decide whether (and what) DDGs are better than standard ADR dictionaries. References: Berry .S,& Berry.D, 2004. Accounting for Multiplicities in Assessing Drug Safety: A Three Level Hierarchical Mixture Model. Biometrics vol. 60 pp 418-426 Evans SJ, Waller PC, Davis S 2001. Use of proportional reporting ratios (PRRs) for signal detection from spontaneous adverse drug reaction reports, Pharmacoepidemiology and Drug Safety. Vol 6 pp.483-485 Prieto-Merino. D, Evans S, 2009. Effects of different groupings of Drug Adverse Events in the detection of signals using Bayesian analysis. 25th International conference in Pharmacoepidemiology and Therapeutic Risk Management, Rhode Island, August 2009.