hhip ! : (3.5) where (x) = R1 ?x Dt and Dt = dte ?t2=2= p. 2. The Bayes classifier eq. (2.10) Bayes(s; Dm) = sign p(+1js; Dm ?p(?1js; Dm)] becomes. Bayes(s; Dm) ...
Bayesian Mean Field Algorithms for Neural Networks and Gaussian Processes
Ph.D. Thesis by Ole Winther
University of Copenhagen The Niels Bohr Institute Blegdamsvej 17, 2100 Copenhagen � Denmark May 1998 connect,
The front page gure shows an example of a mapping of input space by a committee machine with three hidden units.
Abstract The subject of this thesis is the derivation and study of Bayesian mean eld learning algorithms for feed-forward neural networks and Gaussian processes. In Bayes learning our posterior beliefs { based upon our a priori knowledge and past observations { are expressed as probabilities. Making predictions on new observations requires averaging over this posterior probability distribution. Mean eld techniques developed within the statistical physics of disordered systems are employed here to compute these averages. The resulting Bayesian algorithms are expressed as an extensive set of non-linear mean eld equations which may be solved by iteration. Two di�erent formalisms are used to derive the mean eld equations, the cavity method and a saddle-point method. In the latter the mean eld equations are derived from the saddle-point of a variational mean eld free energy. Two di�erent mean eld free energies are studied, a naive and the so-called TAP mean eld free energy. The cavity method and TAP saddle-point method give equivalent mean eld equations, although the derivation di�ers. The naive and TAP approach give similar results in simulations, but the latter has the advantage that it may be analyzed theoretically, and one may derive estimators of the generalization error from the mean eld theory. The aims of this work are twofold. Firstly, to gain theoretical into insight how Bayes algorithm infers a rule given by a neural network. Besides deriving algorithms, the mean eld techniques may be used to derive the expected generalization error of the algorithms for learning scenarios in the thermodynamic limit. The results found show ne agreement between the average case analysis and simulations for learning scenarios in the simple perceptron and in the committee machine. Also Bayesian online and query algorithms are derived and studied theoretically. The second aim is to derive mean eld algorithms for use on real data. The mean eld algorithm is derived for Gaussian processes. This choice is very exible because, depending on the speci cation of the covariance function, di�erent models may be tested. For example, one choice corresponds to the simple perceptron. The mean eld algorithms are tested on three small benchmark data sets for various covariance functions and the performances are found to be similar to the state of the art.
Preface This thesis summarizes the results of my doctoral research. The work has been carried out at the Computational Neural Network Center, connect, The Niels Bohr Institute, University of Copenhagen and at Theoretical Physics, University of Lund. The thesis consists of two parts, an essay and a collection of reprinted papers. The rst part, as well as serving as an introduction to the reprinted paper, contains new results building upon the results of the papers. I wish to thank both my advisor, Benny Lautrup and my supervisor in Lund, Carsten Peterson for their guidance. I wish to thank everybody at connect and in the group in Lund for providing me with good places to do research. It has been a pleasure to work with my collaborators S�ren Halkj�r, Benny Lautrup, Manfred Opper, Sara S. Solla and Jian-Bo Zhang. A special thanks to Manfred Opper for his guidance and generosity in sharing his great insight into the eld. This work has been supported by the Danish Natural Science Council and the Danish Technical Research Council through connect. Most importantly, I wish to thank Mette and Rebecca for their love and inspiration.
O.W.
Copenhagen, Denmark May 1998
i
ii
Contents 1 Introduction 2 Theory
2.1 Bayesian Inference . . . . . . . . . . . . . . . . . . . . . . . . 2.1.1 Bayes Algorithm . . . . . . . . . . . . . . . . . . . . . 2.1.2 Generalization Error Estimators . . . . . . . . . . . . . 2.2 Statistical Mechanics . . . . . . . . . . . . . . . . . . . . . . . 2.3 Learning Machines . . . . . . . . . . . . . . . . . . . . . . . . 2.3.1 Feed-Forward Neural Networks . . . . . . . . . . . . . 2.3.2 Gaussian Processes . . . . . . . . . . . . . . . . . . . . 2.3.3 Convergence of Neural Networks to Gaussian Processes 2.4 Other Algorithms . . . . . . . . . . . . . . . . . . . . . . . . .
3 Algorithms
3.1 Predictive Probability . . . . . . . . . . . . . . . 3.2 Mean Field Equations from Cavity Method . . . . 3.2.1 Simple Perceptron . . . . . . . . . . . . . 3.2.2 Simple Perceptron with Binary Weights . . 3.2.3 Committee Machine . . . . . . . . . . . . 3.3 Mean Field Equations from Free Energy . . . . . 3.3.1 Naive Mean Field Theory . . . . . . . . . 3.3.2 TAP Mean Field Free Energy . . . . . . . 3.3.3 Bayesian Estimation of Noise using ML-II
4 Average Case Analysis
4.1 Generalization Error . . . . 4.2 Consistent Scenarios . . . . 4.2.1 Simple Perceptron . 4.2.2 Committee Machine 4.3 Inconsistent Scenario . . . .
. . . . .
. . . . .
. . . . .
. . . . .
. . . . . . . . .
. . . . . . . . .
. . . . . . . . .
. . . . . . . . .
. . . . . . . . .
. . . . . . . . .
. . . . . . . . .
. . . . . . . . .
. . . . . . . . .
. . . . . . . . .
. . . . . . . . .
. . . . . . . . .
. . . . . . . . .
. . . . . . . . .
. . . . . . . . .
. . . . . . . . .
. . . . . . . . .
. . . . . . . . .
. . . . . . . . .
. . . . . . . . .
. . . . . . . . .
. . . . .
. . . . .
. . . . .
. . . . .
. . . . .
. . . . .
. . . . .
. . . . .
. . . . .
. . . . .
. . . . .
. . . . .
. . . . .
. . . . .
. . . . .
. . . . .
. . . . .
. . . . .
. . . . .
. . . . .
. . . . .
. . . . .
5.1 Solving the Mean Field Equations . . 5.2 Arti cial Data { Consistent Scenarios 5.2.1 Simple Perceptron . . . . . . 5.2.2 Finite Size E�ects . . . . . . . 5.2.3 Naive Mean Field Theory . .
. . . . .
. . . . .
. . . . .
. . . . .
. . . . .
. . . . .
. . . . .
. . . . .
. . . . .
. . . . .
. . . . .
. . . . .
. . . . .
. . . . .
. . . . .
. . . . .
. . . . .
. . . . .
. . . . .
. . . . .
. . . . .
5 Simulations
iii
1 5
5 8 11 12 15 15 16 19 20
23
24 29 30 35 37 38 38 43 47
49
52 54 54 54 56
59
59 61 61 62 63
iv 5.2.4 Simple Perceptron with Binary Weights . 5.2.5 Fully Connected Committee Machine . . 5.3 Arti cial Data { Inconsistent Scenario . . . . . 5.3.1 Bayesian Noise Estimation . . . . . . . . 5.4 Real Data . . . . . . . . . . . . . . . . . . . . . 5.4.1 Sonar { Mines versus Rocks . . . . . . . 5.4.2 Pima Indians Diabetes . . . . . . . . . . 5.4.3 Leptograpsus Crabs . . . . . . . . . . . .
6 Online Learning
6.1 Continuous Weight Priors . . . . . . . . 6.1.1 Linear Perceptron . . . . . . . . . 6.1.2 Simple Perceptron . . . . . . . . 6.2 Simple Perceptron with Binary Weights .
7 Query Learning
. . . .
. . . .
. . . .
. . . .
. . . . . . . . . . . .
. . . . . . . . . . . .
. . . . . . . . . . . .
. . . . . . . . . . . .
. . . . . . . . . . . .
. . . . . . . . . . . .
. . . . . . . . . . . .
. . . . . . . . . . . .
. . . . . . . . . . . .
. . . . . . . . . . . .
. . . . . . . . . . . .
. . . . . . . . . . . .
. . . . . . . . . . . .
. . . . . . . . . . . .
. . . . . . . . . . . .
63 66 67 68 70 71 73 75
77
78 79 81 82
85
7.1 Predictive Probability Approach . . . . . . . . . . . . . . . . . . . . . . . . 86 7.2 Posterior Probability Approach . . . . . . . . . . . . . . . . . . . . . . . . 89 7.3 Simulation Results . . . . . . . . . . . . . . . . . . . . . . . . . . . . . . . 89
8 Conclusion A Review { Bayesian Neural Networks B Summary of Algorithms C Stability List of Papers Bibliography
91 95 97 99 101 103
Chapter 1 Introduction We have the ability to learn from observations. This is how we gain knowledge about ourselves and the world around us. Mostly, we use this knowledge to predict events quite instantly, without conscious e�ort and without being given a rule for doing it. According to a natural scienti c view { or the astonishing hypothesis as Crick [1] has called it { learning from experience is possible, because our brain is a physical system which undergoes (small) physical changes when exposed to sensory input. Even though this idea seems very natural from a materialistic scienti c viewpoint, very much is still missing in order to understand how the brain really works. Also despite the fact that many microscopic details and many very coarse grained pictures are known. To understand why it is so di�cult to get into the problem (or one may say inside the brain), one may look at the brain's structure. The brain is made up of around 1011 processing units, nerve cells or neurons each connected to up 104 other neurons. Continuously, each receives signals from a great number of other neurons and send the result of its own processing to others. In a very simpli ed picture (adopted widely by workers in the eld of arti cial neural networks) the signal transmitted to another neuron is modulated by the strength of the synaptic junction to that neuron. Changes in the synaptic strengths are believed to be the main mechanism responsible for learning. The neurons are not just connected at random. The brain has a highly structured organization and many areas have been identi ed with performing speci c tasks. This is the result of 600 million years of biological evolution.
Modeling. Several scienti c elds deal with exactly the same thing, as we do so well all
the time. The main purposes of statistical theory, machine learning and arti cial neural networks are to provide a description of past observations and/or to make predictions about future events based upon observations (of a similar nature) [2, 3]. This is done by using a model, which has some parameters adapting in some way to the observations. In fact, without some sort of model inference is impossible. The model represents our subjective knowledge opposed to the objective knowledge coming from observation. The subjective knowledge may build upon past observations, but at some point some subjectivity must have entered the inference process. Clearly, inference in arti cial systems is inferior to the inference in natural systems in most respects. This may have two reasons: 1. Observations { our senses provide a much richer sensory input than are used in arti cial systems. 1
CHAPTER 1. INTRODUCTION
2
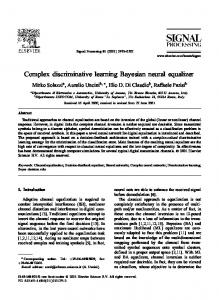
2. Modeling { the way the brain processes and adapts to information is superior to how it is done in arti cial systems. Although point 1. is often true, in pattern recognition one can set up situations, where both get the same amount of information, and we still do much better than the arti cial systems. Examples of this are recognizing faces from photographs or understanding a telephone conversation. Thus point 2. { the model we use to describe the observations is crucial. In a scienti c process, one must besides of adapting to observations, be able to create new models. This continuous process of gaining more experience and creating re ned models1 is illustrated in gure 1.1. The two basic ingredients are the observations and models. In the central box the models are adapted to the observations. The adapted models are then used to make predictions about new observations. This step also provides tests of the predictions. These tests may be used to decide, whether the adapted models give a su�ciently good description of the new observations or one has to come up with new models. The process may then start over again using the new observations and the adapted models and/or newly created models. In the following, the work done in this thesis will be put into the context of the gure. Observations (Data)
Models
Use Model & Data to Adapt Model Adapted Models /
New Observations
Create New Models
Test Adapted Models on New Observations
: Illustration of scienti c process as adapted from [24].
Figure 1.1
Bayesian statistics. In this thesis Bayesian statistics is used for adaption and pre-
diction. In Bayesian statistics all uncertainties are expressed using probabilities, e.g. we assign probabilities to the di�erent outcomes for the events we want to predict, i.e. our degree of belief for them to occur. Adaptation of models to observations and other inferences are therefore in principle carried out by applying simple rules of probability. In Bayesian statistics what is called `models' in gure 1.1 consists of two parts. The rst is assigning a priori probabilities to the parameters of the model. The assigned probability to the parameters may either be a result of adapting the model to previous observations or it may come from another source of prior knowledge. The second part is the probability the model assigns to the observations for a given value of the parameters. Using 1 There may be
competing theories.
3 Bayes rule, one may then calculate the posterior probability of the model parameters. This summarizes the posterior beliefs about the parameters based upon the prior beliefs and the observations. Bayesian inference is optimal in the sense that the so-called Bayes algorithm gives the best possible way to use this posterior knowledge. A valid criticism against the Bayesian view is that one is not always able to assign probabilities to prior beliefs. Another point of criticism is that subjectivity has been introduced into inference. However, as it should be clear from the above, inference is not possible without a certain degree of subjectivity. Furthermore, testing of the models and creation of the new models ensure that models that t the new observations poorly may be identi ed and replaced with new models. Coming up with new models is a creative process. Here (Bayesian) statistics cannot be used.
Models. The models considered in this thesis are feed-forward neural networks and
Gaussian processes. Arti cial neural networks [4] are examples of models, which have been invented using Nature as inspiration. The research in the eld is aimed at both modeling brain function and using neural networks as engineering devices for solving inference tasks. We shall only consider the latter here. However, up til now the models for both have been quite similar. Within statistics, Gaussian processes have a long history (see e.g. ref. [5]). In the neural network eld they have recently gathered interest, because it has been shown that they are closely related to some neural network models [6]. Making Bayesian inference with Gaussian processes is in principle very simple and one may test quite di�erent Gaussian process models by simply changing their so-called covariance function.
Learning scenarios. The basic o�ine learning scenario considered here is the follow-
ing: Both the model and the set of observations, the training set are given. Learning is supervised. This means that a training example consists of an input and an associated output which is supplied by a teacher. To measure the success of the learning the concept of generalization error is introduced. It is the expected error made when predicting, e.g. if the task is to classify events, it is the average fraction of wrong predictions on new inputs. Two other types of learning scenarios are considered. In query learning the model is allowed to select the new inputs. We will introduce two information theoretically motivated Bayesian query learning algorithms. We shall also study a Bayesian approach to online learning. Here, we consider an approximative posterior distribution of model parameters, which is updated for every new observation, i.e. in gure 1.1 one cycle is made for every new example seen. The reason for using a simple model is that learning may be done much faster. This may be advantageous when the learning speed is the limiting performance factor and not whether all information have been extracted from the training data.
Computational methods. To make predictions within Bayesian learning { using Bayes
algorithm { one has to compute averages over the posterior distribution. This, in principle, simple task is quite involved for realistic problems. Methods developed within physics may be used. One possibility, which has gathered much attention recently, is to perform the average using numerical Monte Carlo methods [6]. Another possibility, which will be advocated in this thesis, is to use approximate analytical techniques developed within
4
CHAPTER 1. INTRODUCTION
statistical mechanics of disordered systems. Using these mean eld techniques, approximate Bayesian predictions may be written in terms of a set microscopic order parameters, whose number typically scale with the number of training examples. Non-linear coupled equations for the order parameters are derived using two techniques, the cavity method [7] and a saddle-point method [8]. In the saddle-point method the order parameter equations are derived from the saddle-point of a mean eld free energy. The solution to these equations, which is found by iteration, thus provides an algorithm for making approximate Bayesian predictions.
Outline. In chapter 2 all the basic theory used in the rest of thesis is laid out. This
includes a presentation of Bayesian inference, the basic concepts of statistical mechanics for disordered systems, the learning machines (models) used and their relationship and alternative algorithms to Bayes algorithm. In appendix A, a short review of Bayesian learning in neural networks is given. The work presented in this thesis has two aims. The rst is to gain theoretical insight into how Bayes algorithm infers a rule given by a feed-forward neural network. In the large system size limit { the thermodynamic limit { statistical mechanics mean eld techniques, originally developed for spin glass systems [7], are expected to give an exact description. These techniques may be used to describe both the microscopic behavior (as described above) and macroscopic average case behavior of the system. Especially, using mean eld theory for the last task has been an active research subject for the last decade and the so-called replica method has been a favorite tool (for reviews see [9, 10, 11]). Typically the result coming out of such an analysis may be presented in a learning curve, i.e. the generalization error versus the number of training examples. A variety of di�erent learning phenomena have been predicted to occur, e.g. phase transitions with discontinuous drops in the generalization error. The main contribution of this part of the thesis is to demonstrate that the microscopic approach may be used to derive Bayes algorithm for these learning scenarios. It is con rmed in simulations that these are in ne agreement with the predicted macroscopic average case performance. Chapter 3 is devoted to deriving Bayes algorithm for a number of learning scenarios. In chapter 4 the average case analysis for the neural network learning scenarios is carried out using the cavity method, and it is demonstrated that it is possible to avoid using the replica method by deriving the average behavior directly from the microscopic equations. In chapter 5 the results of simulations and the theoretical predictions are presented. In chapter 6 and 7 Bayesian formulations of online and query learning are presented. These ideas are applied to a number of learning scenarios in the simple perceptron. The second aim of this thesis is to demonstrate that the same mean eld techniques may be used to derive algorithms for Gaussian processes, which may be used with good results on real data. In fact, the derivation of the mean eld algorithm for Gaussian processes and for simplest feed-forward neural network { the simple perceptron { may be treated under one. However, Gaussian processes provide much more exibility for doing modeling. This will be demonstrated in chapter 5, where simulation results for three small benchmark data sets are presented. In chapter 8, the thesis is concluded with a discussion of the results. Some of the results in the thesis have been published and the papers are reprinted at the end of thesis. Many results are, due to a recent `learning transition', new and not presented anywhere else.
Chapter 2 Theory This chapter introduces the basic theoretical concepts used in the thesis. Since the subject of the thesis is application of statistical physics techniques for Bayesian inference, both Bayesian statistics, statistical physics and their connection to each other will be discussed here. Within statistical physics and Bayesian inference, one is led to consider averaged quantities over often high-dimensional statistical ensembles. Within statistical physics, powerful approximate analytical and numerical methods have been developed to compute these averages. In this work, analytical mean eld methods will be developed for di�erent learning machines.
Outline. Section 2.1 deals with Bayesian inference including Bayes optimal learning algorithm, the de nition of the generalization error and estimators of generalization error. Section 2.2 gives a short overview of statistical mechanics for disordered systems. Two basic approaches to disordered systems exist. One may either average the free energy over the distribution of the disorder, which in a learning context is the inputs of the training set, or keep the disorder xed. The averaged disorder approach may be used to predict average properties of systems. This approach will be taken for some neural network learning scenarios in chapter 4. The quantity of interest in learning context is the generalization error. The xed disorder approach may be used to analyze the microscopic properties. In chapter 3, it will be shown that this approach may be used to derive approximate Bayesian algorithms. Section 2.3 discusses the learning machines used. These are feed-forward neural networks and Gaussian processes and it is shown that in some limits they are closely related. Section 2.4 discusses three alternatives to Bayes algorithm, namely the Gibbs, the optimal and the maximum stability algorithms. Throughout the thesis, the performance of these algorithms and their relationship to Bayes algorithm will be discussed. Appendix A gives a short review of some of the trends in Bayesian learning in neural networks.
2.1 Bayesian Inference The Bayesian approach to learning o�ers a purely probabilistic formulation of inference. To explain it, consider the case where m independent examples y1; : : : ; ym have been observed. The examples have been generated by a possibly stochastic function with parameters v, called the teacher. The relationship between the data and the teacher 5
6
CHAPTER 2. THEORY
output are quanti ed through the probability that the teacher v generates the example y, called the likelihood pt(yjv). Here the subscript t will be used to denote the teacher (or true) probabilities. The examples are independently drawn from the same distribution, thus the likelihood ofQthe so-called training set Dm = fy�g�=1;:::;m may be written as a product pt (Dmjv) = � pt (y�jv). For supervised learning, which will be considered in this thesis, the training examples are input-output pairs y = (s; � ) with s being an input vector and � being a classi cation label for classi cation or a continuous output in the case of regression. The input-output relation pt (� jv; s) will be modeled. The distribution of the inputs p(s) will be taken to be independent of v, and the following decomposition pt(yjv) = pt((�; s)jv) = pt(� jv; s)p(s) may therefore be used.
Likelihood for output noise. For the problems studied here the output of the teacher ft(v; s) may be corrupted by noise. One could also generalize to input noise or noise on the parameters. To show how the likelihood pt (� jv; s) is related to the output, the two
cases studied in this thesis will be discussed. First example. For classi cation, only two-class problems are considered. The output is taken to be �1 and it is afterwards ipped with probability �t . The output label � therefore has the same sign as the teacher output ft (v; s) with probability 1 ? �t and opposite sign with probability �t. Thus, in this case the likelihood becomes
pt (� jv; s) = (1 ? �t )�(� ft(v; s)) + �t �(?� ft (v; s)) = �t + (1 ? 2�t )�(� ft (v; s)) ; (2.1) where � is the step function �(x) = 1 if x > 0 and zero otherwise. Second example. For regression, the output ft(v; s) is taken to be a scalar corrupted by additive output noise, i.e. � = ft (v; s) + � or pt (� jv; s; �) = �(� ? ft (v; s) ? �). The noise will be assumed to be Gaussian with zero mean and variance �t2 . The likelihood therefore now becomes Z Z d� 2 ! � exp ? 2 �(� ? ft (v; s) ? �) pt(� jv; s) = d�pt(�)pt(� jv; s; �) = p 2�t 2!��t 2 (2.2) = p 1 exp ? (� ? f2t�(v2 ; s)) 2��t t for �t > 0 and pt (� jv; s) = �(� ? ft(v; s)) for the noise-free case.
Posterior distribution over teacher parameters. In the Bayesian approach, the teacher parameters v are assumed to be sampled from a prior distribution pt(v), i.e. there
are a whole distribution of possible teachers and one of them is the actual teacher which generated the training set outputs. To explain how pt (v) should be interpreted take a collection of coins as an example. pt (v) is the distribution over the coins for the probability for, say heads. Each coin will have a (slightly) di�erent probability for heads, thus giving rise to a probability distribution for the probability of heads over the ensemble of coins. Using Bayes theorem one may form the posterior distribution pt(vjDm) of v given the the training set pt (vjDm) = pt(Dpm(jDv)p)t(v) ; (2.3) t m
2.1. BAYESIAN INFERENCE
7
R
where pt (Dm) = dvpt(v)pt (Dmjv) is a normalization constant and the probability of the training set. The posterior pt (vjDm) quanti es the knowledge about v after having observed Dm, i.e. it gives the probability (density) that v has generated the training set.
Posterior distribution over student parameters. In most practical situations neither the teacher mapping ft (v; s) nor the distributions associated with v are known. But one may still try to infer the teacher function ft (v; s). In the Bayesian approach this is done introducing a student f (w; s) with parameters w and then quantifying all dependen-
cies and uncertainties through probabilities in the same way as done for the teacher above. Therefore a likelihood p(� jw; s) is assigned to the output. For example for classi cation with output noise the likelihood becomes
p(� jw; s) = � + (1 ? 2�)�(� f (w; s)) ; (2.4) where � is the output ip probability assumed by the Bayesian learner. For regression with Gaussian output noise one has as before 2! 1 ( � ? f ( w ; s )) p(� jw; s) = p exp ? : (2.5) 2�2 2�� The a priori uncertainty about w is quanti ed through the prior distribution p(w), and the posterior distribution p(wjDm) = p(Dpm(jDw)p)(w) ;
(2.6)
m
represents the Bayesian learner's degree of belief in w after having observed Dm . Whereas pt(vjDm) is taken to be the underlying true distribution of teacher parameters, every distribution associated with the student, thus also p(wjDm), is based on possibly incorrect subjective beliefs.
Predictive Probability
The aim of inference is to make predictions on new examples not in the training set. Within the Bayesian approach the rst step towards making predictions is to assign probabilities to the possible outputs on a new input. This is done using the predictive probability of the output � given a new input s, p(� js; Dm )
Z p(� js; Dm ) = hp(� jw; s)i(wjDm) � dwp(� jw; s)p(wjDm) :
(2.7)
R
Here we have introduced the shorthand notation h: : :i(wjDm) = dw : : : p(wjDm) for the average over the posterior distribution. The predictive probability for the teacher pt(� js; Dm ) may also be formed
pt (� js; Dm) = hpt (� jv; s)i(vjDm) : (2.8) This is the true probability for output � { over the distribution of teachers { given the training set Dm . In the ideal case the Bayesian learner assigns the correct predictive
CHAPTER 2. THEORY
8
probabilities, i.e. p(� js; Dm) = pt (� js; Dm). If this is the case, the learning scenarios will be called consistent. On the other hand if there is a mismatch between the true predictive probability and the Bayesian learner's belief the learning scenario will be called inconsistent.
2.1.1 Bayes Algorithm
Bayes algorithm will be considered for two cases, classi cation and regression for Gaussian output noise.
Bayesian Classi cation
The predictive probability p(� js; Dm ) is the Bayesian learner's posterior belief for the probabilities for the di�erent outputs, i.e. output � is believed to be correct with probability p(� js; Dm ). To minimize the probability of making a misclassi cation, one should therefore choose the output label with highest probability. This is known as Bayes decision rule � Bayes (s; Dm ) = argmax p(� js; Dm) : (2.9) �
For binary �1-classi cation { studied in the thesis { we should therefore calculate p(�1js; Dm) and select the output label with highest probability
� Bayes (s; Dm ) = signhf (w; s)i(wjDm) = sign [p(+1js; Dm) ? p(?1js; Dm)] :
(2.10)
We may quantify our uncertainty as well because according to our belief the probability for making an error is 1 ? max� p(� js; Dm) = 1 ? p(� Bayes (s; Dm )js; Dm).
Generalization error for classi cation. Now let us assume that in fact the teacher is v, then the correct value for the probability of making an error on input s is 1?
X �
pt(� jv; s)�(�; � Bayes (s; Dm)) = 1 ? pt (� Bayes (s; Dm)jv; s) ;
where �(x; y) is the Kronecker �-function. Since we are interested in the average properties over all possible teachers, we may average over the distribution of v, which after m examples is p(vjDm)
h 1 ? pt (� Bayes (s; Dm )jv; s) i(vjDm) = 1 ? pt (� Bayes (s; Dm )js; Dm) : The generalization error is de ned as the average over the input distribution of the misclassi cation probability Bayes (D ) =� h 1 ? p (� Bayes (s; D )js; D ) i ; (2.11) �incon m t m m s R where we have written the average over the input distribution ds : : : p(s) as h: : :is. Bayes (D ) is the generalization error for the most general case of di�erent predictive �incon m distributions for teacher and student. The generalization error of Bayes algorithm for the consistent scenario, which will be denoted by �Bayes (Dm ), is obtained by repeating the
2.1. BAYESIAN INFERENCE
9
arguments above using the predictive probability for the student and it simply amounts to removing the subscript t
�Bayes (Dm) = h 1 ? p(� Bayes (s; Dm)js; Dm) is :
(2.12)
The consistent scenario is just a special case of a general teacher-student scenario. In this thesis, we make a distinction between the consistent/inconsistent scenario because we will primarily be interested in the consistent case, which is simpler to analyze.
Bayesian Regression
Bayes algorithm for regression is not unique. It will depend upon the loss function used, i.e. the measure of the distance between the correct output and prediction of the algorithm. Here a quadratic loss function will be used, and it will be shown that the Bayes regressor is the posterior mean of the output
� Bayes (s; Dm ) = hf (w; s)i(wjDm) :
(2.13)
Using the Gaussian likelihood eq. (2.5), the expected error for an arbitrary algorithm with output f (s) for input s is
Z
d�p(� js; Dm )(� ? f (s))2 = �2 + h(f (w; s) ? f (s))2i(wjDm) :
The second term is minimized by choosing f (s) = hf (w; s)i(wjDm) giving the Bayes regressor and �2 + hf 2(w; s)i(wjDm) ? hf (w; s)i2(wjDm) is the error bar on the prediction by the Bayes regressor.
Generalization error for regression. The generalization error of the Bayes regression algorithm is obtained by averaging the loss of Bayes algorithm (� ? � Bayes (s; Dm ))2 over the true distribution of the new example pt (� js; Dm)p(s) Z Bayes �incon (Dm ) = h d�pt (� js; Dm)(� ? � Bayes (s; Dm))2 is = �2 + h (ft(v; s) ? � Bayes (s; Dm))2 i(vjDm );s (2.14) and in the consistent case this simpli es a bit
�Bayes (Dm) = �2 + h hf 2(w; s)i(wjDm) ? hf (w; s)i2(wjDm) is :
Practical Considerations
(2.15)
In practice, there are two problems with the Bayesian approach: 1. Computing the posterior average. For many models the parameter space is high-dimensional and not tractable for analytical integration. As mentioned, the approach taken in this thesis is to use mean eld methods developed within statistical physics to perform the average. In appendix A, a review of other approaches within the neural network literature is given.
CHAPTER 2. THEORY
10
2. Incomplete knowledge. We have already suggested that most practical learning situations are inconsistent, i.e. the exact physical nature of the problem, given by the true predictive probability pt(� js; Dm ), is not known to the Bayesian learner, who will model it by p(� js; Dm ).1 This type of incomplete knowledge represents an uncertainty in the model choice. But even for a speci c choice of model, we have seen that additional parameters, the noise parameters � and �2 , are needed to specify the Bayesian learning scenario. Typically even more parameters, not explicitly given so far, are needed as well. They could for example be parameters specifying the prior distribution on w. We will use the symbol to denote these socalled hyperparameters. The likelihood and the prior should therefore be conditioned on : p(� jw; s) = p(� jw; s; ) and p(w) = p(wj ). Below, it will be discussed how one in the Bayesian framework deals with incomplete knowledge about , which we from now on will use to denote both model and hyperparameters. There are basically three approaches to dealing with incomplete knowledge 1. Hierarchical Bayesian approach. In a purely Bayesian formulation, one should quantify all uncertainty by writing down the joint posterior over model parameters w and the other unknown quantities . For the posterior, one needs the prior distribution p( ) for . We may now write the predictive probability
Z
Z
p(� js; Dm) = d p(� js; Dm ; )p( ) = dwd p(� jw; s; )p(wjDm; )p( ) (2.16) with
Q p(y�jw; )p(wj ) p(wjDm; ) = � p(D j ) : m
In this way, we have introduced a hierarchy of parameters. One may also go beyond two levels by having additional hyperparameters associated with the prior distribution for . 2. Bayesian model selection. Model selection refers to choosing a speci c model and set of hyperparameters. In Bayesian model selection one does not necessarily need the prior distribution p( ). One chooses theQvalue for which maximizes the R 2 probability for the training set p(Dm j ) = dw � p(y�jw; )p(wj )
ML?II = argmax p(Dmj ) (2.17)
This method is called maximum likelihood II (ML-II) empirical Bayes [12] as opposed to usual maximum likelihood in w parameters space wML = argmax p(Dm jw) ; w
where p(Dm jw) = Q� p(y�jw). In the following, is only written explicitly when
needed. It is always to be understood that the probabilities used depend upon the choice of model and hyperparameters.
1 The model means all that goes into specifying the Bayesian learner, i.e. the student f (w; s), the prior
p(w) and the likelihood p(� jw; s).
2 For supervised learning we normally calculate p(f� � gjfs� g; ) = R dw
Q
(� � jw; s� ; )p(wj ) which � pQ � � is related to the probability of the training set by p(Dm j ) = p(f� gjfs g; ) � p(s� ). Since the input distribution is independent of , it it makes no di�erence whether we use p(Dm j ) or p(f� � gjfs�g; ).
2.1. BAYESIAN INFERENCE
11
3. Validation or Cross-Validation model selection. Another possible way of doing model selection is based upon estimating the generalization error of the model using a validation set or cross-validation. Generalization error estimators will be discussed below.
2.1.2 Generalization Error Estimators
Leaving some of the available examples out of the training set allow us to estimate the performance of the model. If the set is used for the purpose of doing model selection, it is called a validation set. On the other hand, if it is used only to report the performance of the model, it called a test set [2]. The validation set of size mvalid is denoted by Dmvalid valid . In the following only classi cation will be considered, but the results may also be generalized to regression. Within the Bayesian approach, one may form two generalization error estimators using the validation set. A third generalization error estimator may be formed if the input distribution is known.
Counting errors. The rst estimator is obtained by comparing the prediction of Bayes
algorithm with the output label of the validation set 1 �valid;1 = �valid;1 (Dm; Dmvalid valid ) = 1 ? m
mX valid
valid �=1
�(� � ; � Bayes (s�; Dm )) :
(2.18)
This is an unbiased estimate of the generalization error because averaging over the distriQ valid bution of the validation set pt (Dmvalid jDm) = � [pt (� � js�; Dm )p(s�)] gives the the Bayes Bayes (D ) eq. (2.11) error �incon m 1 ? m1
mX valid Z
valid �=1 mX valid Z
1? 1 mvalid
�=1
valid � Bayes (s� ; D )) = dDmvalid m valid pt (Dmvalid jDm )� (� ; �
ds�
X ��
Bayes (D ) : pt(� � js� ; Dm)p(s� )�(� � ; � Bayes (s� ; Dm)) = �incon m
The variance of this estimator may be found by noting that on average �(� � ; � Bayes (s; Dm)) Bayes (D ) and 0 with probability is 1, i.e. the prediction is correct, with probability 1 ? �incon m Bayes �incon (Dm). �valid;1 is therefore a binomial variable with variance given by Bayes (D )(1 ? �Bayes (D )) � m incon incon m : var(�valid;1) = mvalid
Average over predictive distribution. As pointed out by Ripley [2], in the consistent
scenario one may get an estimator with lower variance from 1 �test;2 = �test;2 (Dm; Dmvalid valid ) = 1 ? m
mX valid
valid �=1
p(� Bayes (s� ; Dm)js�; Dm ) :
(2.19)
This choice corresponds to averaging �valid;1 over Q� p(� � js�; Dm) or equivalently the �th term in �valid;1 over the predictive probability p(� � js�; Dm ). Since we average over the output label, the output labels of the validation set is not used, and the generalization
CHAPTER 2. THEORY
12
error is therefore estimated using unlabeled examples. This estimator is only an unbiased estimate of the generalization error in the consistent scenario as may be seen by averaging the estimator over the input distribution Q� p(s� ). To prove that the variance of the estimator, in the consistent scenario, has been decreased compared to �valid;1 consider rst a single term 1 ? p(� Bayes (s� ; Dm)js�; Dm). On average the �th term is 1 ? hp(� Bayes (s� ; Dm)js� ; Dm)is� = �Bayes (Dm). Since � Bayes (s�; Dm ) is the output with highest probability, we have 1 ? p(� Bayes (s� ; Dm)js� ; Dm) � 1 ? N1c , where Nc is the number of classes. The variance is therefore less or equal to �Bayes (Dm)(1 ? N1c ) ? (�Bayes (Dm ))2 and the variance of the estimator is bounded by � � var(�valid;2) � m 1 �Bayes (Dm)(1 ? N1 ) ? (�Bayes (Dm ))2 valid c Bayes (D ) � = var(�valid;1) ? m Nm : valid c
The variance of the estimate has been decreased compared to �valid;1, but it still scales as 1 mvalid .
Average over input distribution. If the distribution of the inputs is known, one may
in principle get the exact value of the generalization error, by averaging the estimate of the generalization error 1 ? p(� Bayes (s; Dm )js; Dm) over the input distribution
�est = �est (Dm) = 1 ? hp(� Bayes (s; Dm)js; Dm)is :
(2.20)
As for �valid;2, this estimator is only unbiased when the learning scenario is consistent.
Cross-validation. If one does not want to waste valuable training data for doing val-
idation, cross-validation may be used [2]. In cross-validation the generalization error is estimated by dividing the whole data set into a set used for validation and a set used for training. The generalization error for the smaller training set may now be estimated using the validation set. This procedure may be repeated for di�erent divisions of the training set. Note that the analysis for the variance is no longer valid, because the di�erent test cases are correlated. There are two drawbacks of this approach. Firstly, it is computationally expensive and secondly, since at least one example is kept out of the data set for testing, the estimate for the generalization error is not for a classi er/regressor that uses the whole data set. The extreme version of cross-validation is leave-one-out estimation. In leave-one-out estimation the training set is divided m times into a training set of m ? 1examples and a validation set containing only one example. This gives an estimate of the generalization error for a training set of size m ? 1 which should not be too di�erent from the generalization error using all m examples. In section 3.2, the idea of leave-one-out estimation will be used within mean eld theory.
2.2 Statistical Mechanics There is a very clear correspondence between Bayesian statistics and statistical mechanics. This is not strange since in both, one is interested in calculating averages over statistical ensembles. In the following, the setup for Bayesian inference will be used to explain
2.2. STATISTICAL MECHANICS
13
concepts of statistical mechanics, but one could also have used a model from statistical physics (for example the Ising model [13]). The normalization constant p(Dm) in Bayes formula eq. (2.6) is nothing but the partition function Z in statistical physics. Another important quantity in statistical physics is the free energy3
F = ? ln Z :
(2.21)
To see how all average quantities may be obtained from F or equivalently from Z , external elds o coupled to w are introduced in Z
Z
Z (o) = dwp(w)p(Dmjw)eo�w :
(2.22)
All moments and correlations of elements of w, the wis, may be obtained from derivatives of F . For example the nth moment of wi is obtained from minus the nth derivative of F with respect to oi with o set equal to zero in the end. This method is called the linear response theorem [13]. Likewise, one may introduce external elds for more complicated functions of w.
Disordered systems. The neural network scenarios studied in this thesis belong to the
type of models for which the free energy is expected to be self-averaging in the thermodynamic limit of in nite system size. I.e. the mean of the free energy { over the distribution of the training data pt (Dm) { scales like the system size, whereas the uctuations are expected to scale only as the square root of the system size. The uctuations may therefore be neglected in the thermodynamic limit. A prominent example of such a disordered system is the so-called SK-model for a spin glass (see [7] for a review of the di�erent approaches to the SK-model). The random couplings between spin variables give rise to disorder in the SK-model. The disorder in a learning context comes from the randomness in the inputs. As will be shown in the following, it is not only the free energy, but also other quantities which are expected to become self-averaging in the thermodynamic limit. R One example is the generalization error, i.e. �(Dm ) � � = dDm�(Dm )pt (Dm). In mathematical statistics, one studies nite systems and one would therefore not expect such a self-averaging property to hold. However, it is the hope here that using the powerful techniques developed for calculating the free energy in the thermodynamic limit may serve as a rst approximation to make Bayesian predictions for nite dimensional arti cial and real data sets. The main task in Bayesian statistics, as well as in statistical physics, is to calculate the free energy. For disordered systems of the spin glass type this is done using mean eld theory, which is expected to become exact in the thermodynamic limit [7]. Precisely, which mathematical approximations are used in mean eld theory shall be discussed in the next chapter. In general, one may distinguish between two approaches to disordered systems � Averaged disorder. The free energy is averaged over the distribution of the training examples pt(Dm ). Thus the average free energy of the student is
Z Fav: = ? dDmpt(Dm ) ln p(Dm ) :
3 There will
be no formal temperature used here, thus = 1 in the following.
14
CHAPTER 2. THEORY The Bayesian scenario corresponds to pt(Dm ) = p(Dm). This approach thus involves averaging over a logarithm which is usually handled by using the replica identity ln Z = limn!0 n1 (Z n ? 1) [7]. The average over the examples will couple the parameters belonging to di�erent replicas of the system. It is convenient to introduce order parameters that measure this coupling in order to be able to perform the integrals over the high-dimensional parameter space. The free energy may now be written in terms of integrals over the order parameters. In the thermodynamic limit, they become self-averaging and the integral may thus be evaluated using the saddle-point method. To get an analytical solution for the free energy, a symmetry assumption for the order parameters is needed. The simplest possible is that of replica symmetry. Replica symmetry, however, does not always hold, as indicated by the fact that the second derivative matrix of the free energy with respect to the order parameters may have negative eigenvalues at the saddle-point. For the SK-model, the so-called Parisi scheme with an in nite number of replica symmetry breaking steps is needed in order to get the correct thermodynamic behavior. The physical interpretation of replica symmetry assumptions is, very loosely speaking, as follows [7]: If the replica symmetric assumption holds, the part of w space with non-zero probability is ergodic. The ergodic component is called a pure state. If replica symmetry is broken ergodicity is also. This means that there will exist states in w space separated by free energy barriers which diverge in the thermodynamic limit. In these cases it may be hard dynamically to nd the global minimum of the free energy because the dynamics might get stuck in meta-stable states, i.e. higher free energy states. For Bayesian learning scenarios replica symmetry normally holds. However, as it will be shown below this is not always the case for discrete systems even in the Bayesian scenario. For mismatched problems and for meta-stable solutions, replica symmetry may also be broken. Replica symmetric theory may still be used as a good approximation in many cases.
� Fixed disorder. In the so-called Thouless, Anderson and Palmer (TAP) approach
[14, 7], one does not average over the distribution of the training examples. The resulting mean eld theory is expressed as a set of coupled non-linear equations for an extensive number of microscopic non-self-averaging order parameters (an example could be hwi(wjDm) ). For the learning scenarios studied here, it will be shown that the solution to the TAP-equations may be used for making approximate Bayesian predictions. In the original TAP-paper [14, 7], the derivation of the mean eld free energy and the mean eld equations was based on a perturbative expansion. In this thesis, the TAP-equations (in the following simply called mean eld equations) will be derived using the cavity method [7] and from the saddle-point of the TAP mean eld free energy. The cavity method is more physically intuitive but less systematic than the replica method. In this thesis, the simplest possible cavity theory corresponding to replica symmetric theory is used. Generalization to the equivalent of replica symmetry breaking is possible [7]. The stability condition which corresponds to the limit of non-negative second derivative eigenvalues in the replica approach will also be considered within the microscopic approach. It is also shown how one from the microscopic equations may obtain macroscopic replica results. The TAP mean eld free energy is obtained from a heuristic approach proposed by Parisi and Potters
2.3. LEARNING MACHINES
15
[8] which avoids the perturbative approach by identifying the relevant terms in the free energy from a solvable model with the same kind of disorder as the unsolvable model in question.
2.3 Learning Machines The learning machines considered here are feed-forward neural networks and Gaussian processes. Clearly, many other learning machines exist. For example, right now you are using the best multipurpose type known to read this line. A lot of arti cial learning machines have been suggested within the literature of statistics, machine learning and neural networks. For a good introduction see the book by Ripley [2].
2.3.1 Feed-Forward Neural Networks
The neural network models considered here are of the feed-forward type. The simplest network which also serves as the building block for multi-layer networks is the simple perceptron with transfer (or activation) function g ! 1 (2.23) f (w; s) = g p w � s : N Here, the input is taken to be N -dimensional. In the following the components of both w and s are taken to be of order one with zero mean. The factor p1N has been introduced to make the argument of the activation function of order one, in the case where the central limit theorem may be applied to w � s.4 The choices of transfer functions used here are R 1 either linear, sigmoidal or the sign: g(x) = x; 2�(x) ? 1; sign(x), with �(x) = ?x Dt and 2 =2 p ? t Dt = dte = 2�. The special choice of sigmoidal 2�(x) ? 1 2 [?1; 1] is very similar to the usual choice tanh, but is much more convenient for theoretical analysis. The two-layer network with one output unit is written as !! K X 1 1 (2.24) W g p w �s f (w; s) = g2 p K k k1 N k For applications, one normally uses g1 sigmoidal and g2 either sigmoidal or linear. The theoretical studies in this thesis are limited to so-called committee machines with xed Wk = 1 hidden-to-output weights. The choice g1 = g2 = sign corresponds to the committee machine used for binary �1 classi cation and g1 sigmoidal and g2 linear is the `soft' committee machine used for regression. In the Bayesian approach to learning, the output of the learning machine f (w; s) only enters through the likelihood p(� jw; s). This will allow us to make a simpli cation for classi cation, because the likelihood eq. (2.4) p(� jw; s) = � + (1 ? 2�)� (� f (w; s)) only depends upon the sign of the network output. The choice of the output activation function { g for the simple perceptron and g2 for the two-layer networks { is therefore irrelevant, and will be taken to be linear in the following, i.e. g(x) = g2(x) = x. 4 In some cases a threshold is added to the argument of a function corresponding to having one of the
inputs si xed to the same value (di�erent from zero) for all examples.
CHAPTER 2. THEORY
16
2.3.2 Gaussian Processes
The purpose of the following section is twofold. Firstly, it is to show that one may write the posterior average in terms of a posterior average over the distribution of learning machine outputs [15]. Secondly, Gaussian processes is introduced. For Gaussian processes, the prior distribution of the learning machine outputs is by de nition Gaussian. Gaussian processes provide a very exible tool for doing modelling because di�erent choices of the so-called covariance function (to be de ned below) allow us to try quite di�erent models for the data. This will be demonstrated for some real data sets in section 5.4. In the next section, it will be shown that the simple perceptron and the two-layer networks with the number of hidden units tending to in nity are equivalent to Gaussian processes with speci c analytical covariance functions. So Gaussian processes and Bayesian neural networks have intersecting `model space'. There of course exist neural network models which are not Gaussian processes and vice versa.
From an average over weights to average over outputs. The likelihood p(� jw; s) is a function of the output of the learning machine f (w; s). For example for the simple perceptron for classi cation, the output is f (w; s) = p1N w � s because we { as discussed above { may take the activation function to be linear. In the following the output f (w; s) will be denoted by hR and we will write p(� jw; s) = p(� jh). The predictive probability eq. (2.7), p(� js; Dm ) = dw p(� jw; s)p(wjDm), may be written in terms of an average over the posterior distribution of h
Z p(� js; Dm ) = dh p(� jh)p(hjs; Dm)
Z p(hjs; Dm) = dw �(h ? f (w; s))p(wjDm) : We can go further along this road and also introduce the training set outputs ff (w; s�)g as fh� g. The likelihood of the training examples may thus be written as Q variables � � � � p(� jh ). Using Bayes rule, the posterior over training set outputs fh g and the output h on the new input may be written as Q p(� � jh�)p(h; fh� gjs; fs�g) � Q � p(h; fh gjs; Dm) = R dh0 Q dh ; (2.25) � 0� � p(� � jh0� )p(h0 ; fh0� gjs; fs� g) where the prior distribution of outputs, i.e. the distribution before the training set labels have arrived, is Z Y � � p(h; fh gjs; fs g) = dw �(h ? f (w; s)) �(h� ? f (w; s�))p(w) : with
�
The predictive probability may now be written in terms of an average over the posterior distribution of learning machine outputs p(h; fh�gjs; Dm)
Z Y p(� js; Dm ) = dh dh� p(� jh)p(h; fh� gjs; Dm) �
The denominator in eq. (2.25) may be simpli ed since
Z
dh p(h; fh�gjs; fs�g) =
Z
dw
Y �
�(h� ? f (w; s�))p(w) = p(fh�gjfs�g) :
(2.26)
2.3. LEARNING MACHINES
17
Note that inference is only possible because of the a priori correlation of the output h of the new example with the outputs of the training set expressed through the prior distribution p(h; fh�gjs; fs�g), i.e. if p(h; fh�gjs; fs�g) = p(hjs)p(fh� gjfs�g) we would not be able to generalize at all.
Gaussian processes. For a Gaussian process, the prior over learning machine outputs
is Gaussian for any data set,R i.e. in general a Gaussian process is completely speci ed by the mean function m(s) = dwp(w)f (w; s) (which in the following will be set to zero) and the covariance function
Z C (s; s0 ) = dwp(w)(f (w; s) ? m(s))(f (w; s0) ? m(s0 )) :
(2.27)
Denoting the covariance matrix for the prior for the training set outputs by C = fC�� g = fC (s�; s� )g, a Gaussian process with zero mean function is written explicitly as 1 P h� (C ?1 )�� h� 1 ? � � 2 q e �� p(fh gjfs g) = : (2�)m det C To show that a Gaussian prior over learning machine outputs is not a very unfamilar choice within neural networks, consider the linear perceptron f (w; s) = p1N w � s and p a spherical Gaussian prior p(w) = e?w�w=2= 2�N . This choice implies that the prior distribution of training set outputs f (w; s) is Gaussian with mean function Z m(s) = dwp(w) p1 w � s = 0 N and the covariance for input s and s0 Z C (s; s0 ) = N1 dw p(w) w � s w � s0 = N1 s � s0 : Below, it will be shown that also other neural network models studied here converges to Gaussian processes. We will consider the simple percpetron for general Gaussian prior and the limit of in nite number of hidden units for a two-layer network. Thus, in these cases using neural networks for Bayesian predictions will simply correspond to prediction with a Gaussian process with the speci c mean and covariance function implied by the weight prior and network architecture. To de ne a Gaussian process, it is not necessary to start from an network architecture and weight prior. One may simply start out by specifying the mean and covariance functions. The only constraint for the choice of covariance function is that it should generate a non-negative de nite covariance matrix for the data set used. Speci c choices and their properties are discussed in refs. [15, 5]. Gaussian processes are non-parametric in the sense that one does not have to write h� as a parametric function of w to make predictions. However, one still has to deal with the hyperparameters of the covariance function. In applications of Gaussian processes the following translational invariant covariance function is often used [16] ! X 1 0 2 0 (2.28) C (s; s ) = v0 exp ? 2 ui(si ? si) + v1 i
CHAPTER 2. THEORY
18
where = fv0 ; v1; ug are the hyperparameters. The physical interpretation of this choice it that nearby points a priori should give similar predictions. This covariance function may be obtained from a network of Gaussian radial basis functions in the limit of in nite number of hidden units [15].
A Solvable Example { Gaussian Processes for Regression
To show how one makes Bayesian predictions with Gaussian processes, an exactly solvable example will be considered. For regression with Gaussian output noise the likelihood eq. (2.5) is Gaussian ! 2 1 ( � ? h ) p(� jh) = p exp ? 2�2 2�� and since the prior over function outputs by de nition is Gaussian, so is the posterior distribution of outputs eq. (2.25) and the predicitive probability eq. (2.26). The elements of the covariance matrix for the prior over function outputs will be denoted by C�� = C (s� ; s� ), C�� = C (s� ; s) and C�� = C (s; s). PerformingR Q the Gaussian integrals over the model outputs fh� g, the two rst moments of p(hjs; Dm ) = � dh� p(h; fh� gjs; Dm ) become
hhi(hjs;Dm ) = and
X �;�
h
C�� (I�2 + C )?1
hh2 i(hjs;Dm) ? hhi2(hjs;Dm ) = C�� ?
X �;�
i
��
��
h
C�� (I�2 + C )?1
i
C �� � �
where I denotes the identity matrix. The predictive probability
Z
p(� js; Dm ) = dh p(� jh)p(hjs; Dm ) has the following two rst moments hhi(hjs;Dm ) and hh2 i(hjs;Dm ) ? hhi2(hjs;Dm ) + �2 . The Bayes regressor eq. (2.13) is the predictive mean � Bayes (s; Dm ) = hhi(hjs;Dm ) and the variance of the predicitive probability gives the error bar on the prediction. In this solvable case, the probability of the training set outputs { used in the Bayesian ML-II model selection scheme {
p(f� � gjfs� g) =
ZY �
dh�
Y �
p(� � jh� )p(fh� gjfs� g)
is also analytically tractable
i X h ln p(f� � gjfs� g) = ? m2 ln 2� ? 21 � � (I�2 + C )?1 �� � � ? 12 ln det(I�2 + C ) : �;�
(2.29)
To complete the example, we may also show that it is possible to calculate the the exact leaveone-out estimator for the generalization error for this model. The variance of the predictive probability gives the error bar on the prediction for the new example. For the leave-one-out estimator, we should for every example in the training set calculate the error bar for that example using a training set without the example. Denoting the reduced (m ? 1) � (m ? 1)-covariance matrix without the �th example by C� , the exact leave-one-out estimator is
0 X 1 @
�loo = �2 + m
�
C�� ?
X �0 ;� 0 6=�
C��0
h
1 (I� �2 + C� ) �0 � 0 C� 0 � A : i ?1
(2.30)
2.3. LEARNING MACHINES
19
Using an identity for the inverse of a matrix by partition
h
A?1
i?1
= A�� ? ��
X
�0 ;� 0 6=�
h i A��0 A?� 1 �0 � 0 A�0 �
(see e.g. ref. [31]), �loo may be written in terms of the full covariance matrix X �loo = m1 [(I�2 +1C )?1 ] : �� �
(2.31)
(2.32)
For classi cation, it is not possible to perform the average over function outputs analytically. Therefore mean eld techniques will be used to compute the integrals approximately (see appendix A for a discussion of other approaches to this problem).
2.3.3 Convergence of Neural Networks to Gaussian Processes
We have already seen that the linear perceptron with spherical Gaussian weight prior is a Gaussian process. Below, we will show that also other weight priors for the simple perceptron and a network with in nite number of hidden units converge to Gaussian processes and that it is possible to derive analytical results for the covariance function for the choices of activation functions considered here. It means that we can make predictions with the simple perceptron and in nite networks using Gaussian processes.
Simple perceptron. For the linear perceptron taking the prior p(w) to be Gaussian with zero mean and covariance matrix �, the ` eld' p1N w � s will be Gaussian and the
corresponding covariance function is
C (s; s0) = N1 sT �s0 :
(2.33)
For a zero mean binary weight prior with covariance function �, the same result holds in the thermodynamic limit of large input if the central limit theorem may be applied. For a discussion of when such a sum will converge to a Gaussian, see ref. [17]. In the next chapters, it will be shown that this does not mean that in the thermodynamic limit, learning a network mapping which has a Gaussian weight prior is equivalent to learning a network mapping with, for example, a binary weight prior.
In nite two-layer network. Neal [6] has considered the limit of in nite hidden units
for the general two-layer network eq. (2.24) with linear output unit and bounded (e.g. tanh) hidden unit activation functions g1 ! X 1 1 W g p w � s + Wt : f (w; s) = p K k k1 N k The hidden-to-output weights are taken to be independent p(fWk g) = Qk p(Wk ) with zero mean and variance �W2 and the output threshold Wt is taken to have zero mean and variance �t2. In the limit of an in nite number of hidden units, the central limit theorem can be applied to show that the output tends to a Gaussian with mean
ZY k
[dWk dwk p(Wk )p(wk )] dWt p(Wt) f (w; s) = 0
CHAPTER 2. THEORY
20 and covariance function
C (s; s0)
= =
ZY k
[dWk dwk p(Wk )p(wk )] dWt p(Wt) f (w; s)f (w; s0)
�t2 + �W2 K1
XZ k
!
dwk p(wk )g1 p1 wk � s g1 p1 wk � s0 N N
!
for inputs s and s0. If all hidden units have the same weight prior we have
!
!
Z
1 1 0 (2.34) t W dwp(w)g1 p w � s g1 p w � s : N N For the committee machine with in nite number of hidden units with no prior correlations between weights belonging to the di�erent hidden unit, the result of eq. (2.34) applies with �W2 = 1.
C (s; s0) = �2 + �2
Average over input-to-hidden weights. For the choices of transfer functions consid-
ered above, one may calculate the average over the prior for the input-to-hidden weights and thus give an analytical expression for the covariance function. For g1(x) = 2�(x) ? 1 and a Gaussian weight prior with zero mean and covariance matrix �, Williams [15] has found ! ! Z 1 1 0 2 2 0 C (s; s ) = �t + �W dwp(w)g1 p w � s g1 p w � s N N T 0 s �s : (2.35) = �t2 + �W2 �2 arcsin q (N + sT �s)(N + s0 T �s0 )
For g1 = sign, we nd a similar (but less smooth) covariance function
Z
!
!
C (s; s0) = �t2 + �W2 dwp(w)g1 p1 w � s g1 p1 w � s0 N N T 0 = �t2 + �W2 �2 arcsin p T s �s0 T 0 : (2.36) s �s s �s For in nite input dimensionality these results apply even for non-Gaussian weight priors when the central limit theorem may be applied to the ` eld' p1N w � s of the input unit. The four covariance functions mentioned here eqs. (2.28,2.33,2.35,2.36) are tested on three benchmark data sets in section 5.4.
2.4 Other Algorithms In this section three alternatives to Bayes algorithm are discussed. These are included for two reasons. Firstly, because the performance of these algorithms are compared to that of Bayes algorithm for di�erent learning scenarios and secondly, because in some cases it may be shown that they are related to the Bayes algorithm. The Gibbs and the optimal learning algorithm are de ned within the Bayesian framework. The last algorithm, called maximum stability [18, 19] is quite di�erent in spirit.
2.4. OTHER ALGORITHMS
21
Gibbs Algorithm and the Optimal Learning Algorithm
As has been shown above, Bayes algorithm does not use the original learning machine f (w; s) for predictions, e.g. for binary �1-classi cation the Bayes classi er is given by eq. (2.10) � Bayes = signhf (w; s)i(wjDm). Gibbs and the optimal learning algorithm, on the other hand, make predictions using the learning machine f (w; s) with a speci c choice of w. In the Gibbs algorithm, w is sampled from the posterior distribution p(wjDm).5 An expression for the generalization error will be derived in the following. For simplicity the learning scenario is taken to be consistent and only classi cation is considered. The generalization error for a speci c w is
X �Gibbs (w; Dm) = 1 ? h p(� js; Dm )�(�; f (w; s))is � = 1 ? hp(f (w; s)js; Dm)is :
(2.37)
Averaging over the posterior distribution p(wjDm), the average generalization error of the algorithm is �Gibbs (Dm) = 1 ? hp(f (w; s)js; Dm)i(wjDm);s : (2.38) The optimal learning algorithm was introduced by Watkin [21], and it answers the question of what is the best generalization performance, one may get using the learning machine f (w; s). The answer is clearly found by minimizing �Gibbs (w; Dm): wopt(Dm ) = argminw �Gibbs (w; Dm). The generalization is given by
�opt (Dm ) = min �Gibbs (w; Dm) w
(2.39)
and optimal learning classi er is
� opt (s; Dm) = f (wopt (Dm); s) :
(2.40)
Maximum Stability Algorithm
The maximum stability algorithm [18, 19] has been proposed for the simple perceptron and is only concerned with the case where the training set can be realized, i.e. there exists a weight vector w such that for every training example � � w � s� � c > 0. The objective of the maximum stability algorithm is to maximize the `stability'6 � � min � w � s : �
jwj
This is equivalent to minimizing jwj2 with the constraints � � w � s� � c. The (unique) solution to this quadratic programming problem is X w = N1 � � x� s� (2.41) � 5 The
name is derived from the fact that one may write the likelihood as a Gibbs distribution ? 1 P� log p(y� jw) and is the inverse temperature. 6 Not to be confused with the stability discussed in section 3.2.
p(Dm jw) = exp(? E ), where the `energy' or training error is E =
CHAPTER 2. THEORY
22
[19], where the prefactor has been introduced for later convenience and the `embedding strengths' x� are given by the the so-called Kuhn-Tucker condition, which says that for every example (x� = 0 and � � w � s� � c) or (x� > 0 and � � w � s� = c) :
(2.42)
This condition means that every example belongs to one of two classes, `easy' and `hard'. The `easy' patterns are the ones that are learned without being embedded. The `hard' patterns should be embedded, but only so much that they are exactly learned. The solution may be rescaled to choose c > 0 arbitrarily. In the following c = 1 will be used. The motivation for using the maximum stability algorithm is that by pushing the solution away from the decision boundaries it will become more stable against small threshold uctuations [22].
Generalization to arbitrary covariance function. Using the expansion of w eq. (2.41), the inner product w � s� may be written as X w � s� = C�� � � x� �
with C�� = N1 s� � s� . Inspired by the results for Gaussian processes, we will generalize this result and allow C to be a general covariance function. Thus, for the results written above we take w � s� ! P� C�� � � x� with C�� being a general covariance function. The prediction for a new input s, which for the simple perceptron is sign w � s, is therefore generalized to X � ms(s; Dm) = sign C�� � � x� ; (2.43)
C�� = C (s; s� )
�
where is the covariance between the new input and example �. This generalized maximum stability scheme is closely related to Vapnik's support vector machines [20]. For support vector machines, the model is like for the simple perceptron linear in model parameters, but may be non-linear in the inputs. The objective of the algorithm is to minimize the sum of a suitably de ned error on the training set and the square norm of the model parameters. The error on the training examples are allowed to be non-zero, thus generalizing the results of the maximum stability algorithm to non-zero training error. Due to the linearity in model parameters and the choice of error-function on the training examples, the optimization problem is still a quadratic programming problem and the prediction on a new input is written in terms of the expansion eq. (2.43). The Kuhn-Tucker condition for x� coe�cients for this algorithm is not identical to the one for maximum stability. However, the feature with some of the x� s identical to zero is still present and the inputs with non-zero coe�cients are called support vectors, giving name to the algorithm. Vapnik [20] motivates the use of such an expansion, with zero valued coe�cients, as an e�ective way of regularizing the solution to get good generalization ability. Severals methods have been proposed to realize the maximally stable simple perceptron [18, 23, 22] (in order of increasing convergence speed). In the simulations in chapter 5 the AdaTron algorithm [23] is used. The update rule for the coe�cients, which has eq. (2.42) P � � � as a xed point is simply �x = max (?x ; �(1 ? � � C�� � � x� )).
Chapter 3 Algorithms In this chapter mean eld algorithms for feed-forward neural networks and Gaussian processes will be derived. The chapter is organized as follows. In section 3.1, it is shown that a mean eld approximation to the key quantity for making Bayesian predictions, the predictive probability, may be written in terms of O(m) (or in the most general case O(m2)) order parameters, where m is the number of training examples. The purpose of the rst section is therefore to derive the mean eld expressions for the predictive probability for the di�erent models and identify the relevant order parameters. The rest of the chapter is concerned with deriving mean eld equations for these order parameters. Solving the set of coupled non-linear equations that are found thus provides a Bayesian mean eld algorithm. Two di�erent techniques will be employed to derive the mean eld equations
� The cavity method (section 3.2). Besides from deriving mean eld equations, it is
also shown how generalization error estimators emerge naturally from the cavity formalism. The training error of Bayes algorithm is de ned and the stability of the solution for the continuous weight perceptron is calculated. A negative stability indicates that the basic assumptions made in the derivation are invalid. Mean eld theory may thus be used to predict its own breakdown.
� The saddle-point method (section 3.3). In the saddle-point method the mean eld
equations are derived from the saddle-point of the mean eld free energy. In section 3.3, it is shown that there is more than one way to derive the mean eld free energy leading to di�erent mean eld free energies and mean eld equations. Later in sections 5.2.3 and 5.4 the di�erent mean eld algorithms are compared in simulations on respectively arti cial and real data sets.
The two methods are suplementary and we will show that under some conditions they give the same same results. The mean eld equations for the simple perceptron and for Gaussian processes are summarized in appendix B. For the neural network models studied here, the mean eld equations are expected to become exact in the thermodynamic limit. For nite systems, the solution to the mean eld will only give approximate Bayesian predictions. In chapter 5, our simulations show that even in small systems the results get quite close to the theoretical average for systems in the thermodynamic limit (derived in chapter 4). The exactly solvable case of Gaussian processes for regression may also be written as a mean eld algorithm and is included 23
CHAPTER 3. ALGORITHMS
24
as an example to highlight the (necessary) approximations made in the derivation of the mean eld algorithms for classi cation problems. In this chapter we shall almost solely be concerned with the average over the student parameters w. The average over the posterior distribution p(wjDm) is in the following denoted by h: : :i. We will also introduce a posterior distribution with a reduced training set without the �th example Q p(� � jw; s� ) p ( w ) � � p(wjDmn(s ; � )) = R dwp(w)�Q6=� p(� � jw; s� ) (3.1) � 6=� R and denote the posterior average over this distribution, dw : : : p(wjDmn(s� ; � � )) by h: : :i�.
3.1 Predictive Probability In this section, mean eld expressions for the predictive probability are derived for the following models � The simple perceptron. � The committee machine with both tree connected architecture and the fully connected architecture in the limit of large number of hidden units. � Gaussian processes. Through the derivation of the predicitive probability, we identify the relevant set of order parameters, which we shall derive mean eld equations for in sections 3.2 and 3.3. For the neural network models, only classi cation is considered. For Gaussian processes, we consider both classi cation and regression. There is an important distinction to be made between the predicitive probability expressions: � For the neural network models a cavity derivation [7] is used. The cavity derivation makes explicit use of the speci c parametric form of the neural network mapping and an assumption of the second moment of the `cavity eld' being self-averaging (to be de ned below). The relevant order parameters are identi ed with the rst moment of the network weights and the second moment of the cavity eld. � For Gaussian processes, there is no speci c parametric form of the mapping and there is no natural method or need to apply a self-averaging assumption. It is still possible to write down exact expressions for the moments of the predictive distribution in terms of the moments of a set of auxiliary variables. The two rst moments of the auxiliary variables are identi ed as the relevant order parameters. This expression also serves as a more general result for neural network models that converge to Gaussian processes.
Simple Perceptron
At rst look it seems very complicated to calculate the predictive probability
Z p(� js; Dm ) = dw p(� jw; s)p(wjDm) = hp(� jw; s)i
3.1. PREDICTIVE PROBABILITY
25
because one must average the likelihood expression eq. (2.4) ! 1 p(� jw; s) = � + (1 ? 2�)� p w � s N over a posterior distribution which is highly non-linear with sharp decision boundaries. The rst step towards a mean eld approximation to this average is to observe that the likelihood only depends on the weights through the eld h = p1N w � s. For the average over the posterior, one therefore only needs to know the posterior distribution R of h, p(hjs; Dm ) = dw�(h ? p1N w � s)p(wjDm). It is therefore convenient to write p(� jw; s) = p(� jh) and
Z
p(� js; Dm ) = hp(� jh)i(hjs;Dm) = dh p(� jh)p(hjs; Dm) = hp(� jw; s)i :
(3.2)
The eld h is the projection of w on a new random direction. The eld h is called a cavity eld because s is an input not used in the training set. In a non-cavity eld w is projected on to one of the training set inputs, h� = p1N w � s� . The distinction between the two will be very important in the following because the two types of elds will have quite di�erent distributions. We will return to this point in section 3.2.
Mean eld approximation. Here, the mean eld approximation amounts to applying the central limit theorem to h = p1N w � s. For N ! 1, the sum of many (possibly) non-Gaussian components will add up to a Gaussian with mean hhi = p1N hwi � s and variance
X � = hh2i ? hhi2 = N1 sisj (hwiwj i ? hwiihwj i) : ij
Furthermore, � is expected to be a self-averaging quantity in the thermodynamic limit [7]. Self-averaging means that the di�erence between � and � � h�is is expected to vanish as O( N1 ) for any realization of the training set and s. The variance �2 ? �2 is therefore also expected to vanish. Assuming correlated (Gaussian) data si = hsiis = 0 and sisj = hsisj is = Bij and introducing the covariance matrix of the weights Mij = hwiwj i ? hwiihwj i, the variance may be written as X �2 ? �2 = N12 Bij BklMik Mlj ijkl If the variance is vanishing { as we shall assume in the following { we may write X � � � = N1 Bij (hwiwj i ? hwiihwj i) : ij
(3.3)
To repeat the above, in the mean eld approximation the posterior distribution of the cavity eld is Gaussian 2! 1 ( h ? h h i ) p(hjs; Dm) = p exp ? 2� ; (3.4) 2�� and the order parameters may be identi ed with hwi and �, where we have suppressed their explicit training set dependence.
CHAPTER 3. ALGORITHMS
26
Predictive probability and Bayes algorithm for the simple perceptron. We
may now carry out the average over the likelihood eq. (2.4)
p(� jh) = � + (1 ? 2�)�(�h) with the Gaussian distributed eld to obtain the predictive probability
!
hhi : p(� js; Dm ) = � + (1 ? 2�)� � p p
R
(3.5)
�
where �(x) = ?1x Dt and Dt = dte?t2 =2 = 2�. The Bayes classi er eq. (2.10) � Bayes (s; Dm ) = sign [p(+1js; Dm ? p(?1js; Dm )] becomes
� Bayes (s; Dm) = signhhi :
(3.6)
The optimal learning classi er eq. (2.40) is implemented by inserting the mean weights in the original architecture � opt (s; Dm) = signhhi ; (3.7) which is identical to the Bayes classi er in this case since the Bayes classi er may be implemented by the original architecture. In general, for more complicated networks { as will be shown below { second order information is also needed to make Bayesian predictions.
Committee Machine
The hidden-to-output activation functions will be taken to be the sign, although one might as well consider the sigmoidal activation function proposed in the previous chapter. The likelihood for the committee is ! K X 1 p(� jfhk g) = � + (1 ? 2�)� � p signhk : K k=1
Tree committee machine. For the committee machine, one may rewrite the likelihood by introducing internal representations �k = �1 p(� jfhk g) =
X Y f�k =�1g k
K !# X 1 �k : �(�k hk ) � + (1 ? 2�)� � p K
"
k=1
(3.8)
For the tree q Kcommittee machine (non-overlapping receptive elds), the elds are now de ned as hk = N wk � s, where the hidden unit k is only connected to the N=K inputs i = 1 + (k ? 1)N=K; : : : ; kN=K . To calculate the predictive probability, one may repeat the arguments used above. In the thermodynamic limit the hidden elds hk will become Gaussian. They will be assumed uncorrelated because the receptive elds are non{overlapping. The predictive probability therefore becomes K !# X Y � hhk i � " X 1 p p(� js; Dm ) = � �k p �k � + (1 ? 2�)� � K k=1 �k ; f�k =�1g k
(3.9)
3.1. PREDICTIVE PROBABILITY
27
with �k = hh2k i ? hhk i2 . The mean output is
X ! X Y � hhk i � ? 1 = 2 �k : � �k p sign K h� (w; s)i = p(+1js; Dm ) ? p(?1js; Dm ) = � k
�k =�1 k
k
The Bayes classi er eq. (2.10) is obtained from taking the sign of this expression. Clearly, it depends on �k as well. The optimal learning classi er is obtained by inserting the optimal P opt weight in the original architecture [39]: � (Dm ) = sign k signhhk i. This result is not identical with the Bayes classi er. The optimal learning classi er, by only considering the sign of hhk i, disregards information on the strength of the prediction made by the hidden unit. This means that for example in the K = 3 case { studied by Opper and Winther [40] { sometimes a large hh1 i may overrule a pair of smaller hh2 i and hh3 i with opposite sign. On average this leads to a (slightly) superior generalization ability.
Large fully connected committee machine. For the fully connected committee ma-
chine, things get more complicated since di�erent hidden elds are correlated. The distribution of the elds is now a joint Gaussian with covariance �kl = hhk hl i ? hhk ihhli � �kl = N1 Pij Bij (hwiwj i ? hwiihwj i)
e? 12 p(fhk gjs; Dm) = q 1K (2�) det �
P
?1 kl (hk ?hhk i)(� )kl (hl ?hhl i)
:
(3.10)
For the fully connected network, it is only possible to derive analytical expressions for the predictive probability if one takes the limit of an in nite number of hiddenPunits and apply the central limit theorem to the hidden layer output eld hout = p1K k sign hk . This corresponds to the Gaussian process limit and hout will be Gaussian with mean
hhout i =
!
X X p1 hsign hk i = p1 g phhk i ; �kk K k K k
(3.11)
with g(x) = 2�(x) ? 1 and variance
X �out � K1 (hsignhk signhl i ? hsignhk ihsignhl i) :
(3.12)
kl
If �out is assumed to be self-averaging, i.e. �out � �out , it is possible to perform the average over the correlation term hsignhk signhl i analytically. The joint average over p(wjDm) and p(s) makes hk Gaussian with mean hhk i = p1N hwk i � s = 0 and covariance Tkl � hhk hl i = N1 Pij Bij hwiwj i. Likewise, the average over p(s) in the second term makes P 1 hhk i Gaussian with mean hhk i = 0 and covariance qkl � hhk ihhl i = N ij Bij hwiihwj i. Using identities for averages over multi-variate Gaussian distributions [45], the following result is found
�out
� �out
!
X = 2 arcsin p Tkl ? arcsin p qkl �K kl Tkk Tll Tkk Tll
!!
:
(3.13)
CHAPTER 3. ALGORITHMS
28
Predictive probability and Bayes algorithm for the committee machine. In the limit of in nite number of hidden units, the predictive probability is written exactly in the same form as for the simple perceptron
!
hhout i : p(� js; Dm ) = � + (1 ? 2�)� � p out
(3.14)
�
The Bayes classi er eq. (2.10), � Bayes (s; Dm ) = sign [p(+1js; Dm) ? p(?1js; Dm)] is
� Bayes (s; D
!
X
hhk i = signhhout i : m ) = sign g p �
(3.15)
kk
k
Compared to the original architecture, the sign hidden units have been replaced by sigmoidal units with gain given by the variance of the eld. The optimal learning classi er is again given by inserting the optimal weights in the original architecture [39]
� opt (s; Dm) = sign
X k
signhhk i :
(3.16)
Gaussian Processes
For the neural network models the rst moment of the weights hwi and the second moment of the cavity eld � were identi ed as being the relevant order parameters needed to specify the mean eld approximation to the predictive probability. For Gaussian processes there is no explicit parametric form of the mapping, which we may use to derive an expression for the predictive probability. Instead, as it will be shown in the following, the relevant order parameters are identi ed with the tow rst moments of a set of auxiliary variables. We will consider both regression and classi cation. As discussed in section 2.3.2 for Gaussian processes the prior distribution p(h; fh�gjs; fs�g), of the training set outputs fh�g and the output h of a new example, is a joint Gaussian. The mean function will be assumed to be zero and the elements of the covariance matrix will be denoted by C�� = C (s� ; s� ), C�� = C (s�; s) and C�� = C (s; s). As for the simple perceptron, we will make the mean eld assumption that the posterior distribution of h, p(hjs; Dm), is Gaussian with mean hhi and variance � = hh2 i ? hhi2, where for Gaussian processes h: : :i = h: : :i(hjs;Dm) denotes an average over the posterior p(hjs; Dm ). For classi cation we therefore get the simple perceptron result for the predictive probability eq. (3.5).
Predictive probability for regression. For regression with likelihood given by eq. (2.5)
!
2 p(� jh) = p 1 exp ? (� 2?�2h) 2�� the Gaussian assumption is exact and the predictive probability becomes
Z
!
2 exp ? (2(� �?2 h+hi�)) : p(� js; Dm) = dhp(� jh)p(hjDm) = q 12 2�(� + �)
(3.17)
3.2. MEAN FIELD EQUATIONS FROM CAVITY METHOD
29
h and � written in terms of moments of auxiliary variables. The task is now to derive expressions for the two rst moments of h in terms of quantities, which we may derive mean eld equations for. We cannot use the same method as for the neural network models, because there we explicitly exploited the parametric form of the network function. Instead, we will write hhi and � in terms of the two rst moments of a set of auxiliary variables. The starting point is the partition function ZY Y Z (o) = dh� dh p(� � jh�)p(h; fh�gjs; fs�g)eho : (3.18) �
�
To get the partition function in a form where it is easy to derive the moments of h, a set of auxiliary variables is introduced Z Y dh�dx� dhdx Y 1 P x� C�� x� + 1 x2 C�� +P C�� x� ?P x� h� ?xh+ho � � 2 � � Z (o) = ; p(� jh )e 2 �;� � 2�i 2�i � where the integration over the x-variables are taken along the imaginary axis to avoid having to carry along imaginary units in the following. To show that the integral is well-de ned and that it is in fact identical to an ordinary multi-dimensional Gaussian integral Z i1 Y dx� 1 P x�C x� ?P x�h� 1 P h� (C ?1 )�� h� 1 ? �� 2 2 �;� � p e e �;� ; =p ?i1 � 2�i det C one should make the substitution x~� = ix� . Integrating over x and h and taking the log derivative with respect to o, we nd the following rst moment
hhi = and second moment
� = hh2i ? hhi2 = C�� +
X �
X �;�
C�� hx� i
C�� (hx� x� i ? hx� ihx� i)C�� :
(3.19)
(3.20)
The rst two moments of the auxiliary variables may thus be identi ed as the order parameters. The next two sections are dedicated to deriving mean eld order parameters equations.
3.2 Mean Field Equations from Cavity Method We saw in the previous section that the mean eld approximation to the predictive probability could be written in terms of a set of order parameters. In this section mean eld equations for these order parameters are derived using the cavity method. The simple perceptron with both continuous and binary weights and the large fully connected committee machine will be considered. The derivation for the tree committee machine follows along same lines and are given in ref. [40]. M�ezard [46] gave the rst derivation of the mean eld equations for the simple perceptron. Opper and Winther [47] gave a simple derivation. The derivation of mean eld equations for Gaussian processes will be postponed until section 3.3.
CHAPTER 3. ALGORITHMS
30
3.2.1 Simple Perceptron
For the simple perceptron, we identi ed the posterior mean of the weights hwi and the second moment of the cavity eld � as the order parameters needed for mean eld approximation to the predictive probability eq. (3.5).
Mean eld equations for hwi. We will start out by deriving an exact expression for hwi written in terms of the rst moment of a set of auxiliary variables. The starting point of the derivation is the partition The prior is chosen to be spherical p Nfunction eq. (2.22). 1 ? w � w = 2 Gaussian p(w) = e = 2� and the elds pN w � s� are introduced as variables
through an integral representation of the Dirac �-function Z dh�dx� p1 x�w�s�?x�h� Z 1 � � � p w � s ) = 2�i e N 1 = dh �(h ? N with the integration over x� being along the imaginary axis. Introducing external elds coupled to the weights we have Z dw Y dh�dx� Y 1 w�w+ p1 P x� w�s� ?P x� h� +w�o ? � � 2 � N � Z (o) = p N ; (3.21) p(� jh )e 2 �i � 2� � where we have written the likelihood p(� � jw; s�) as p(� � jh�). Integrating out the weights and taking the log derivative with respect to the external elds, we nd that the mean weight vector is expanded by the input vectors
hwi = p1
N
X �
s� hx� i :
(3.22)
This result holds for any choice of the likelihood, p(� � jw; s�). The next task is to derive equations the hx� is.
Mean eld equations for hx� i. To nd the the mean of the auxiliary variables, we
introduce external elds coupled to x� in eq. (3.21). For simplicity we will denote these by o� Z dw Y dh� dx� Y 1 w�w?P x� (h� ? p1 w�s� ?o� ) ? � � � 2 � N Z (fo g) = p N p(� jh )e : (3.23) 2� � 2�i �
We may now integrate out both the x� variable (giving a �-function) and the h� variable to see that the external eld ends up inside the argument of the likelihood, e.g. for classi cation we have Z dw Y " X � � !# ? 21 w�w 1 � � w�s +o ) e : (3.24) Z (fo g) = p N � + (1 ? 2�)� � ( p N � 2� � In the following, we will use h� as a shorthand for p1N P� w � s� and write the above result as Z dw Y � (3.25) Z (fo g) = p N p(� � jh� + o� )e? 21 w�w : 2� �
3.2. MEAN FIELD EQUATIONS FROM CAVITY METHOD
31
Taking the log derivative we arrive at the exact result Z @p(� � jh� + o� ) Y 1 hx� i = Z dw : (3.26) p (� � jw; s� )p(w) � @o o� =0 � 6=� Introducing the reduced posterior average in which the �th example is kept out of the training set R dw : : : Q p(� � jw; s� )p(w) (3.27) h: : :i� � R dw Q �6=p�(� � jw; s� )p(w) ; � 6=�
eq. (3.26) may be recast into a form for which we may apply a cavity argument
hx� i =
h @p(� �@ojh��+o�) i� hp(� � jh�)i�
@p(� � jh� ) i h = hp(�@h� j�h�)i� : � o� =0
(3.28)
To calculate hx� i, one has to perform average over expressions which only depend upon the eld h� . In the reduced average h: : :i�, h� is a cavity eld.
Mean eld approximation. Because h� is a cavity eld, we may apply the mean eld
approximations used above and approximate the distribution p(h�js� ; Dmn(s� ; � �)) with a Gaussian with mean hh�i� and variance X hh2i� ? hhi2� = N1 si sj (hwiwj i� ? hwii�hwj i�) ij X � N1 Bij (hwiwj i� ? hwii�hwj i�) ij X � N1 Bij (hwiwj i ? hwiihwj i) = � : (3.29) ij The third line follows from the fact that � is expected to be self-averaging, and thus only change O( N1 ) when one pattern is added [7]. To repeat the above { in the mean eld approximation the distribution of the cavity eld p(h� js�; Dm n(s�; � � )) is � ? hh� i� )2 ! ( h 1 � � � � : p(h js ; Dm n(s ; � )) = p exp ? 2� 2�� For classi cation, within the mean eld approximation, one gets a result analoguous to the predictive probability eq. (3.5) � i� ! h h � � � (3.30) hp(� jh )i� = � + (1 ? 2�)� � p : � In fact hp(� jh�)i� is the predictive probability for the �th input given a training set without the �th example. We will use this later to de ne generalization error estimators. hx�i eq. (3.28) may be written as a logarithmic derivative
hx� i =
@ lnhp(� � jh�)i� @ hh� i�
�
�
�
(1 ? 2�)D hhp�i� � �; p = � � + (1 ? 2�)� � � hhp��i�
��
(3.31)
CHAPTER 3. ALGORITHMS
32
p
where D(t) = e?t2 =2 = 2�. This is a general result independent of the weight prior. Note that hx�i will always have the same sign as the output label. To close the equations we have to deal with the following two points 1. Relationship between full and reduced posterior average. hx� i is written in terms of the reduced average of h� , hh� i�. In order to close the equations, we have to write everything in terms of full posterior averaged quantities. 2. Second moment of the cavity eld { � depends on unknown second moments of the weights.
Relationship between full and reduced posterior average. The distribution of h� given the whole training set (including the �th example), p(h�jDm ) may be written in terms of the reduced posterior p(h� js�; Dmn(s� ; � � )) using Bayes rule � � � � � � (3.32) p(h� jDm) = R dhp0�(�p(j�h� j)hp0�(h)p(jhs 0�;jDs�m; nD(s n;(�s�)); � � )) : m The same relation may be written in terms of the reduced average as � � (3.33) h: : :i = hph(p�(�j�hjh)�:):i:i� : � We may now relate the reduced average of the led h� to the full posterior average
hh� i = hph(p�(� j�hjh)�h)i i� = hh� i� + �hx� i ; � � �
�
(3.34)
where the rst equality is exact and the second equality follows from partial integration using the mean eld approximation for the distribution of the cavity eld. The last term is called the Onsager reaction term [7] and it accounts for the di�erence between the full and reduced average of h�. The fact that it does not vanish in the thermodynamic limit shows that the distribution of the cavity eld and non-cavity eld are very di�erent, e.g. the di�erence in the mean value is O(1). One may also observe, that the hx�is (or alternatively the hh�i� s) cannot be written in terms of other variables. They are therefore fundamental order parameters of the mean eld equations, whereas the hwiis are not because they follow from the hx� is according to eq. (3.22).
Second moment of the cavity eld { �. To solve the second problem of writing � in
terms of known quantities, there are two possibilities. For uncorrelated inputs Bij = �ij , it follows from the choice of prior and the speci c likelihood's independence of the scale of weights that hw � wi = N . Thus � reduces to 1 ? N1 hwi � hwi. For other cases, e.g. regression this argument does not hold. Alternatively, one may generalize the result of M�ezard [46] to an add-two-weights cavity method to nd the second moments expressed in terms of the hx� is and derivatives of the hx�is. For the case of the binary weight simple perceptron this add-one-weight cavity method will be explained. Here, we will just state the result: The new weights wi and wj will have a Gaussian distribution with covariance
h
i
hwiwj i ? hwiihwj i � (I ? BR)?1 ij ;
(3.35)
3.2. MEAN FIELD EQUATIONS FROM CAVITY METHOD
33
where I is the identity matrix and
X R = N1 (h(x� )2i ? hx� i2) �
with
h(x�)2 i ? hx� i2
! �i �i 2 lnhp(� � jh� )i @ h x h h @ � � � � = @ hh� i = ?hx i � + hx i : = @ hh� i2� �
(3.36)
(3.37)
The derivation of this result relies on the so-called clustering hypotheses, saying that within one pure state the distribution of the cavity elds belonging to di�erent examples factorize [46]. This is reasonable as long as `temporal correlations' are not expected, i.e. correlations between di�erent training examples. That this `weak coupling' assumption has been used, may be seen from the fact that R is written as a sum over the examples, i.e. there are no cross terms. Now the mean eld equations are closed with the following result for � � = N1 Tr B (I ? RB )?1 : (3.38)
Generalization Error Estimators and Training Error
In this subsection we will show how generalization error estimators and the training error may be de ned within the cavity approach.
Generalization error estimators. In section 2.1.2, di�erent estimators of the gen-
eralization error were de ned. In the consistent scenario, they are all unbiased, i.e. on average they are equal to the generalization error, but they have di�erent variances. In the following, we will show how generalization error estimators may be de ned for the simple perceptron using the cavity formalism. In the cavity approach, one calculates the mean of the cavity eld hh�i� . Taking signhh� i� is nothing but the mean eld approximation to the Bayes classi er for the �th input given a training set with the �th example left out. Using eq. (2.18) we may thus form the following leave-one-out estimator X �loo1 = m1 �(?� � hh� i�) ; (3.39) � which simply corresponds to counting the number of errors made on the training set labels
f� � g by the leave-one-out predictors fsignhh�i�g. Likewise hp(� jh� )i� is the mean eld approximation to the predictive probability of � for input s� given a training set with the
�th example left out. The second leave-one-out estimator, eq. (2.19), may thus be written in terms of the mean eld expressions X X �loo2 = 1 ? m1 h p(signhh�i�jh� ) i� = m1 h p(?signhh� i�jh�) i� � ! � � X (3.40) = � + (1 ? 2�) m1 � ? jhhp i�j : � �
CHAPTER 3. ALGORITHMS
34
An additional generalization error estimator may obtained using eq. (2.20) �est = h 1 ? p(� Bayes (s; Dm )js; D!m) is = h p(?� Bayes (s; Dm)js; Dm) is = � + (1 ? 2�)h � ? jhphij is : � In the thermodynamic limit we may apply the central limit theorem, and conclude that on average over the input distribution, si = 0 and sisj = Bij , the eld hhi = p1N hwi � s is Gaussian with zero mean (because the input distribution has zero mean) and variance P 1 q = N ij Bij hwiihwj i. We obtain pqt ! Z1 �est = � + (1 ? 2�)2 Dt� ? p 0 rq � 1 = � + (1 ? 2�) � arccos( T ) ; (3.41)
with T = � ? q = N1 Pij Bij hwiwj i. See chapter 4 for more details about the derivation of this result. In chapter 5 the leave-one-estimators will be tested in simulations. One expects O( p1N ) corrections on quantities like the predictive probability. These nite size e�ects will be studied numerically in section 5.2.2.
Training error. In the Bayesian approach to learning, one considers averages over the
posterior, so a training error does not play any role. This is di�erent from many other algorithms which aims at minimizing the training error. We may still, however, de ne the training error of the Bayes classi er as the number error made by the Bayes classi er X Et = m�t = �(?� � hh�i): (3.42) �
Note that the training error is de ned in terms of the full posterior mean of the elds, whereas the rst leave-one-out estimator eq. (3.39) is de ned in terms of the the reduced average, consequently �t � �loo1 . All these results are easily generalized to the other models.
Stability
One of the basic implicit assumptions made in the derivation of the mean eld equations is that adding a new example will only induce a small change of O( p1N ) of the mean weight. In the following, the cavity method is used to make a self-consistent check within mean eld theory of this assumption. The analysis given here is for simplicity restricted to the simple perceptron with uncorrelated inputs. Because the di�erence between the m and m ? 1 posterior mean hwii ? hwiim on average will be zero, one is instead lead to consider the so-called stability � = (hwi ? hwim) � (hwi ? hwim) : (3.43) In appendix C, � is calculated self-consistently based upon the method proposed by Wong [48]. The condition for � being nite { the so-called stability condition { becomes
X @ hx� i 1 ? N1 �2 � � @ hh i�
!2
>0:
(3.44)
3.2. MEAN FIELD EQUATIONS FROM CAVITY METHOD
35
For the SK-model, it has been shown that the left hand side of the stability condition is equal to the lowest eigenvalue of the second derivative matrix of the mean eld free energy at the saddle-point [7]. This is also expected to be true for the simple perceptron. The mean eld free energy and its saddle-point will be calculated in the next section. In section 4.2 it will be shown that the average over the distribution of the training set of the stability condition coincides with the stability condition for the replica free energy.
3.2.2 Simple Perceptron with Binary Weights
The mean eld equations for the simple perceptron with binary weights are derived using both a leave-one-weight-out and the leave-one-example-out cavity method. We shall not go into so many details of the derivation here since the leave-one-weight-out cavity method is very similarQto leave-one-example-out cavity method. The binary weight prior is chosen to be p(w) = i p(wi) with p(wi) = 21 (�(wi ? 1) + �(wi + 1)). For simplicity uncorrelated inputs si = 0 and sisj = �ij will be assumed.
The leave-one-weight-out cavity method. The starting point is as usual the parti-
tion function with the elds introduced as variables. Averaging over the ith weight and introducing the posterior average excluding the ith weight
R Q [dw p(w )] : : : Q �R dh� dx� e?x�(h� ? p1N Pj6=i wj s�j) p(� � jh�)� j j j 6=i � 2�i � � h: : :ii = R Q P R Q dh� dx� e?x� (h� ? p1N j6=i wj s�j ) p(� � jh� ) [dw p(w )] j 6=i
j
j
�
2�i
the mean weight may be written as P P p1N � x� s�i ? p1N � x� s�i i ? e h e hwii = p1 P� x�s�i ? p1 P� x�s�i i : +e N ii he N
(3.45)
Mean eld approximation. A cavity argument may now be applied. x� and P Since � �
si are uncorrelated in the reduced average, the new type of eld p1N � x� si will add up to become Gaussian in the thermodynamic limit with mean p1N P� s�i hx� ii and variance, which for uncorrelated patterns approximately are, N1 P�(h(x� )2ii ? hx� i2i ). Using this Gaussian assumption, one has X � � ! 1 hwii = tanh p s hx i : (3.46) N � i i
Relationship between full and reduced posterior average. To close the equations, one has to express hx�ii in terms of the full posterior average. Using the Gaussian assumption for the eld and the exact relation similar to eq. (3.33)
P
R dw p(w ) : : : e pN � x�si wi i h h: : :i = R i i p1 P� x�s�iwi i ; ii h dwip(wi)e N 1
�
one obtains a relation between the reduced and the full posterior mean of x� hx� ii = hx� i ? p1 hwiis�i (h(x�)2 ii ? hx� i2i ) : N
(3.47) (3.48)
CHAPTER 3. ALGORITHMS
36
We may now insert this relation into eq. (3.46) using that the sum over the second term { the reaction term { is expected to be self-averaging [7], i.e. one may set (s�i)2 � (s�i )2 = 1 and h(x� )2ii ? hx� i2i � h(x� )2i ? hx� i2.
Mean eld equations. The nal result is
!
X X hwii = tanh p1 s�ihx� i ? hwii N1 (h(x� )2i ? hx�i2 ) ; N � �
(3.49)
where hx� i and h(x� )2i ? hx� i2 are given by the general results eqs. (3.31) and (3.37) and � � N1 (hw � wi ? hwi � hwi) = 1 ? N1 hwi � hwi.
Criticality
In the following, we will consider the limit where the mean eld equations eq. (3.49) converge to a binary solution, i.e. hwii = �1 and thus � = 1 ? N1 hwi � hwi = 0. The motivation for considering this limit is that we will be considering the learning scenario with a binary weight vector teacher. In this scenario, the thermodynamic average case analysis predicts a transition in which the student becomes identical to binary weight teacher [9]. The mean eld equations for the binary solution { which we want to nd { is exactly the equations obtained by taking the � ! 0 limit in the mean eld equations. This phenomenon of criticality, i.e. that the solution space becomes point-like, have been studied in many cases for example for learning in presence of noise [36] and learning of random examples [34]. To derive mean eld equations for the limit � ! 0, we need the asymptotic expansion D(x) ! ?x�(?x) for jxj ! 1 (3.50) �(x) Taking � ! 0 and � = 0 in eq. (3.49) gives to leading order � hx� i = ? hh�i� �(?� � hh� i�) : (3.51) Inserting this result in eq. (3.34), hh�i = hh�i� + �hx�i, gives a simple relation between the full and the reduced posterior mean of the eld hh� i = hh�i��(� � hh� i�) : (3.52) The reaction term may also be rewritten � (3.53) h(x�)2 i ? hx� i2 = @@hhhx� ii = ? �1 �(?� � hh�i� ) : �
Mean eld equations for criticality. Introducing t� = � � hh� i� and x� = ?t� �(?t� ), and inserting the asymptotic results in the mean eld equations (3.49), one obtains
!
X X hwii = sign p1 � � s�ix� + hwii N1 �(x� ) : N � �
(3.54)
3.2. MEAN FIELD EQUATIONS FROM CAVITY METHOD
37
We see from x� = ?t� �(?t� ) and � � hh� i = t� �(t� ) that for every example, dependent on the sign of t� , we get (x� = 0 and � � hh� i � 0) or (x� > 0 and � � hh� i = 0) :
(3.55)
This condition is identical to Kuhn-Tucker condition eq. (2.42) for a normalized weight vector at zero stability [48]. Thus in this limit the mean eld equations are closely related to the maximum stability algorithm. The method for nding the maximum stable solution (see section 2.4) may therefore be employed to solve these equations. It is only the expression for weights which is modi ed from eq. (2.41) for the continuous weights to eq. (3.54) for the binary weights.
3.2.3 Committee Machine
The derivation of the mean eld equations for the fully connected committee machine goes along the same lines as for the simple perceptron. Here, we will not go into as much detail as for the simple perceptron. Only independent spherical weight priors will be considered. One nds the following exact result for the mean weights
hwk i = p1
N
X �
s� hx�ki
(3.56)
and for the auxiliary variables, which now have an additional hidden unit index, one nds the exact result � � hx�k i = @ lnh@ph(h�� ijh )i� : (3.57) k � Taking N � K ! 1 and using the results from the derivation of the predictive probability eq. (3.14) one obtains within the mean eld approximation �out i� ! h h � � � (3.58) hp(� jfhk g)i� = � + (1 ? 2�)� � p out � with X X hh�ki� ! 1 1 � � out : (3.59) hh i� = p hsign hk i� = p g p �kk K k K k As for the simple perceptron, one nds the relation between the full and the reduced posterior mean of the elds by partial integration
hh�ki = hh�k i� +
X l
�klhx�l i :
(3.60)
To nd appropriate expressions for �kl, one may again consider uncorrelated inputs Bij = �ij and note that the prior will x hwk � wli. Thus for independent spherical priors hwk � wl i = �klN and �kl = �kl ? N1 hwk i�hwl i. An expression for general input correlations may be obtained using the cavity method for two new weights. Introducing � � X X 2 (3.61) Rkl = N1 (hx�kx�l i ? hx�k ihx�li) = N1 @ @lnhhh�pi(�hhjh�i )i� � � k � l �
CHAPTER 3. ALGORITHMS
38 one may write
X h i �kl = N1 Bij V ?1 ijkl ; ij
(3.62)
where Vijkl = �kl �ij ? RklBij .
3.3 Mean Field Equations from Free Energy In this section two sets of mean eld equations will be derived from the saddle-point condition of two di�erent variational mean eld free energies. It is important to stress that mean eld theory is not unique. The derivation of the rst `naive' mean eld theory (section 3.3.1) is based on a convexity inequality for the free energy. This approach leads to the usual mean eld theory for Ising systems [13]. Unfortunately (or fortunately if one likes hard problems), for disordered systems this approach does not give the correct result, i.e. the TAP result which we derived using the cavity method in section 3.2. To calculate the TAP mean eld free energy a heuristic method suggested by Parisi and Potters [8] will be used (section 3.3.2). A more rigorous derivation requires a perturbative expansion. For the SK-model, it has been shown in ref. [49], that it is su�cient to go to second order in a high-temperature expansion of the Gibbs free energy to get the correct result. However, for the models studied in ref. [8] and the models studied here, one has to sum to in nite order to get the correct Gibbs free energy. The perturbative expansion may be formulated in usual eld theoretic diagrammatical terms, but we will prefer the heuristic approach because the relevant term in the Gibbs free energy, i.e. the result of summing in nitely many terms, may be obtained directly from a solvable model. For both the naive and the TAP approach, one has to choose the set of order parameters for the model. For the classi cation problems, only the choice corresponding to the weak coupling assumption discussed in section 3.2 will be analytically tractable. Contrary to the cavity approach, we shall not necessarily use a self-averaging assumption for the second moments of the cavity elds. For the simple perceptron, we will show how one may reproduce the cavity result by applying a self-averaging assumption to the so-called Onsager term in the mean eld free energy. Only the simple perceptron and Gaussian processes are treated. Since the simple perceptron is equivalent to a Gaussian process a uni ed presentation may be given. Generalization to, for example the committee machine, is straightforward. In section 3.3.3, it is shown how the Gibbs free energy in principle may be used to make a Bayesian ML-II estimation of hyperparameters.
3.3.1 Naive Mean Field Theory
The naive mean eld theory will be derived for the simple perceptron and Gaussian processes. In both cases the partition function is written as
Z Y dx�dh� Y 1 P C�� x� x� ?P h� x� � � 2 � Z= ; p(� jh )e �;� � 2�i �
(3.63)
where the integrals over the x� variables are taken along the imaginary axis. For Gaussian processes C may be a general covariance matrix C�� = C (s� ; s� ). For the perceptron the
3.3. MEAN FIELD EQUATIONS FROM FREE ENERGY
39
partition function above is obtained by integrating over the Gaussian prior for the weights. For a spherical weight prior we have C�� = N1 s� � s� . When the likelihood is not Gaussian, the partition function is not analytically tractable and we have to resort to approximative methods. The following convexity inequality for the free energy F = ? ln Z ([13],page 31) { derived from exp x � 1 + x { is used to obtain an upper bound to the free energy F = ? ln Z � Fnmft = ? ln Z0 + hH ? H0i0 (3.64) with Z Z Z = dvp(v)e?H Z0 = dvp(v)e?H0 and ?H0 (H ? H0 ) dvp ( v ) e R : hH ? H0i0 = dvp(v)e?H0 The result is derived taking x = H ? H0 . H = H (v) is the exact Hamiltonian, H0 = H0 (v) is any trial Hamiltonian and p(v) denotes the measure over variables. In the following, we will drop the 0 subscript and write the posterior average over the trial Hamiltonian h: : :i0 as h: : :i. The naive free energy Fnmft should be minimized to make the bound as tight as possible. This variational principle implies that the order parameters, which Fnmft is a function of, should be found from the saddle-point of Fnmft. In this case, the Hamiltonian is X H = ? 21 C�� x� x� �;� and dvp(v) = Q
P
dx� dh� Q p(� � jh� )e? � h� x� . � � 2�i
The convexity inequality holds { at least { whenever the integrals over the variables are along the real axis. Here, the x� -integrals are along the imaginary axis and it is an open question whether the inequality holds (M. Opper personal communication 1997-98). For the problem studied here, it turns out that the order parameters are always real. The mean eld theory is therefore always well de ned and the variational method gives usable mean eld equations.
A Solvable Example { Gaussian Processes for Regression
As the most general case considered the trial Hamiltonian is taken to be X X H0 = ? 21 ��� x�x� ? x� � : � �;� For this choice, the integral in the rst term in Fnmft in eq. (3.64) is only analytically tractable for Gaussian process regression. For Gaussian process regression, we will demonstrate the reassuring fact that the convexity bound is tight when the trial and exact Hamiltonian have the same parametric form. Below, we shall consider a diagonal trial Hamiltonian to get analytical results for classi cation. We will go through the derivation of the free energy for this trial Hamiltonian in some detail. The Z0 term is
Z Y dx� dh� Y 1 P ��� x� x� +P x� ( � ?h� ) � � � p(� jh )e 2 �;� Z0 = � 2�i � Z Y dh� 1 Y 1P � � ?1 � � p p p(� � jh� )e? 2 �;� (h ? )(� )�� (h ? ) : = �
2� det � �
(3.65)
CHAPTER 3. ALGORITHMS
40 For the Gaussian output noise regression, the likelihood is
2 p(� jh) = p 1 exp ? (� 2?�2h) 2��
!
and we may perform the Gaussian integrals to get the nal result h i X ? ln Z0 = + m2 ln 2� + 21 ( � ? � �) (I�2 + �)?1 �� ( � ? � � ) ? 12 ln det(I�2 + �) : �;� The second term is easily found
hH ? H0i = ? 21
X
X
�;�
�
(C�� ? ��� )hx� x� i ?
hx� i � :
The mean eld free energy eq. (3.64) therefore becomes h i X Fnmft = m2 ln 2� + 12 ( � ? � �) (I�2 + �)?1 �� ( � ? � � ) + 12 ln det(I�2 + �) �;� X X 1 (3.66) + 2 (��� ? C�� )hx� x� i + � hx� i : � �;� @Fnmft @Fnmft @Fnmft The saddle-point conditions @F@�nmft �� = @ � = @ hx� x� i = @ hx� i = 0 give
i Xh 2 (I� + C )?1 �� � � �h i � � � � hx x i ? hx ihx i = ? (I�2 + C )?1 �� : hx� i =
(3.67) (3.68)
The predictive probability for Gaussian process regression eq. (3.17) is Gaussian and the two rst moments are obtained by inserting the results found above in eqs. (3.19) and (3.20). This result is identical to the result found in section 2.3.2 using direct integration. Inserting the saddle-point into the free energy, one gets the exact free energy F = ? log p(f� � gjfs� g), where log p(f� � gjfs� g) is given by eq. (2.29). To conclude, we have demonstrated that the convexity bound is tight when we use a trial Hamiltonian with non-diagonal terms for this analytically tractable example.
Diagonal Trial Hamiltonian
In order to get analytical results for the classi cation problems the trial Hamiltonian is chosen to be diagonal X X H0 = ? 21 �� (x� )2 ? x� � : �
�
Note that with this choice of trial Hamiltonian, one implicitly assumes that the di�erent patterns are weakly correlated. Introducing an external eld coupled to x� , i.e. H ! P H + � x� o� , correlations may be found using the linear response theorem
hx� x� i ? hx� ihx� i = ?
@ 2 F = @ hx� i @o� @o� o=0 @o� o=0
(3.69)
3.3. MEAN FIELD EQUATIONS FROM FREE ENERGY
41
Derivation of naive mean eld free energy for classi cation. We will go through
the derivation of the naive mean free energy for classi cation in details here. Below, we will identify the di�erent terms in the free energy and give the result for regression for the diagonal trial Hamiltonian. The Z0 term is # Z Y " dx� dh� 1 �� (x� )2 +x� ( � ?h� ) � � 2 Z0 = 2�i p(� jh )e � 3 Z Y 2 dh� ( � ?h� )2 ? 4q = p(� � jh� )e 2�� 5 : 2��� � For classi cation with output noise, the likelihood is p(� jh) = � + (1 ? 2�)�(�h) and we get the nal result � !# X "
� ? ln Z0 = ln � + (1 ? 2�)� � p � : � � The second term does not have any cross-correlation terms because the trial Hamiltonian is diagonal, i.e. hx� x� i = ��� (h(x� )2i ? hx� i2) + hx� ihx� i. We therefore get X X X hH ? H0i = ? 21 C�� hx� x� i + �hx� i + 12 ��h(x� )2i �� � � X X X X 1 1 = ? 2 C�� hx� ihx� i ? 2 C�� R� + � hx� i + 21 �� h(x� )2i �� � � � with R� = h(x� )2i ? hx� i2 : (3.70)
Naive mean eld free energy. In general, three di�erent terms may be identi ed in the free energy [8]
Fnmft = Genergy + GOnsager + G0 : (3.71) In the following, we will describe the di�erent terms and give the results for the models studied here 1. Naive mean eld energy Genergy is for H = ? 21 P�;� C�� x� x� given by X Genergy = ? 12 C�� hx� ihx� i : (3.72) �;� 2. Onsager reaction term GOnsager accounts for the di�erence between the reduced leave-one-example-out posterior average and full posterior average. The Onsager reaction is also discussed in section 3.2 for the cavity method. We will show below that the di�erence between the naive and TAP mean eld free energy is found in this term. The naive mean eld result is X (3.73) GOnsager = ? 21 C�� R� : � with R� given by eq. (3.70).
CHAPTER 3. ALGORITHMS
42
3. Entropy term. G0 is minus the entropy or `single variable contribution', i.e. the to zero order (in the interaction between the variables) contribution to the free energy.1 G0 is the only term, which depends on the likelihood p(� jh). This property will be used below for the heuristic derivation of the TAP mean eld free energy. For respectively regression and classi cation, one nds
m ln 2� + 1 X ln(�2 + � ) + 1 X (� � ? � )2 Gregress = � 0 2 2 � 2 � � 2 + �� X X + ( � + o� )hx�i + 1 �� h(x�)2 i 2 � � " � !# X
class � G0 = ? ln � + (1 ? 2�)� � p � � � X � � � 1X + ( + o )hx i + 2 �� h(x�)2 i : � �
Mean eld equations. Two of the saddle-point conditions are G0 independent. 0 leads to
� =
X �
C�� hx� i ? �� hx�i ? o�
nmft and @@F h(x� )2 i = 0 leads to
�� = C�� :
(3.74)
(3.75)
@Fnmft @ hx� i
=
(3.76)
(3.77)
The two last saddle-point conditions give di�erent results for regression and classi cation.
Regression. For regression, @F@ nmft � = 0 leads to hx� i = and
@Fnmft @��
Xh
(I�2 + C )?1
i
(� � + o� )
(3.78)
R� = h(x� )2i ? hx� i2 = ? �2 +1 C :
(3.79)
�
��
= 0 leads to ��
The result for R� is not identical with the correct result eq. (3.68) obtained from using the trial Hamiltonian with non-diagonal terms. However, applying the linear response theorem eq. (3.69), one nds the exact result. This apparent contradiction may be understood from the fact that the linear response theorem eq. (3.69) only holds for the exact �i @ h x Hamiltonian and the error one makes in the response function @r� by using the diagonal trial Hamiltonian is smaller than the error in the correlation function ([13],page 33). 1 Here the
single variable refers to the training example variable x� .
3.3. MEAN FIELD EQUATIONS FROM FREE ENERGY
43
Classi cation. For classi cation the two last conditions give �
hx�i = and
R�
�
� p (1 ? 2 � ) D � � �� � � q� �� � + (1 ? 2�)� � � p ��
= ?hx� i
(3.80)
!
� + hx� i : ��
(3.81)
Comparing with the cavity result for the perceptron eq. (3.28), one sees that � gives a naive mean eld approximation to hh�i� . It is only an approximation because the variance of the cavity elds �� is set to C�� within this approach. In the next subsection this shortcoming will be cured. The linear response theorem may unfortunately not be applied in this case, because the equations for the hx� is are not linear.
3.3.2 TAP Mean Field Free Energy
In this subsection, a heuristic method proposed by Parisi and Potters [8] for computing a better approximation to the Gibbs free energy is applied to the simple perceptron and Gaussian processes. The starting point is the partition function with external elds Z Y dx� dh� Y 1 P (�� ��� +C�� )x� x� +P x� ( � ?h� ) � � � 2 � : (3.82) Z ( ; ��) = p(� jh )e �;� � 2�i �
The variables are passed to hx� i and h(x� )2i using Lagrange transforms to form the Gibbs free energy X X G(hx�i; h(x� )2i) = ? ln Z ( �; �) + hx� i � + 12 �� h(x�)2 i : (3.83) � � @G The saddle-point conditions are @h(@G x� )2 i = @ hx� i = the Gibbs free energy is equal to the free energy.
@G @��
=
@G @ �
= 0. At the saddle-point,
Parisi-Potters approach. The Gibbs free energy contains the same basic terms as the
naive mean eld free energy
G = Genergy + GOnsager + G0 : The entropy term contributes to G to zeroth order in the interaction term, i.e. the Gibbs free energy calculated without H , the interaction between variables X X G0 = ? ln Z0 + hx� i � + 21 �� h(x�)2 i � � with
Z Y dx� dh� Y P P � jh� )e 21 � �� (x� )2 + � x� ( � ?h� ) : p ( � Z0 = � 2�i �
CHAPTER 3. ALGORITHMS
44
This is exactly the naive mean eld expression for G0 which is given by eq. (3.74) for regression and by eq. (3.75) for classi cation. Below, we will also identify the energetic term with the naive mean eld result eq. (3.72). The Onsager reaction term is the only term which is changed compared to naive mean eld theory. This term is at least for the neural network models expected to be self-averaging in the thermodynamic limit. For the simple perceptron, we will show how this self-averaging assumption is used to rid of the explicit example dependence in the Onsager term. The aim of this section is therefore to identify the correct Onsager term. The proposed heuristic is based on the observation that the entropy only depends upon the constraint on each single variable, i.e. in this case the constraints imposed by the likelihood, whereas the energetic and Onsager terms only depend upon the interaction between the variables. Models with di�erent single variable constraint, but with the same type of interaction, e.g. regression and classi cation models, will thus only have di�erent entropy terms. We already saw this in the derivation of the naive mean eld free energy - the classi cation and regression models only di�ered in the G0 term. We may therefore derive the Gibbs free energy for an unsolvable model by calculating the entropy term for the unsolvable model and identifying the rest of the terms in the Gibbs free energy from a solvable model with the same type of interaction as the unsolvable model. Denoting the entropy term sol and the Gibbs free energy for the solvable model by respectively Gsol 0 and G , the above statement is written as G = G0 + Gsol ? Gsol 0 : p As a (non-trivial) solvable model p(� � jh� ) � 2��(h�) is chosen.2 This choice is not normalized, but that does not matter because this error will cancel out in Gsol ? Gsol 0 .
Gibbs free energy for the solvable model. The task is now to calculate the two
terms Gsol and Gsol 0 . (We already have calculated the third term G0 ). The partition function for the solvable model is Z Y dx� dh� Y 1P �2 P � � � p ln Z sol = ln �(h� )e 2 �;� (�� ��� +C�� )(x ) + � x ( ?h ) (3.84) 2�i � � i X h = ? 12 ln det(� + C ) ? 12 � (� + C )?1 �� � : �;�
For later convenience �� has been renamed to �� here. The Gibbs free energy is
Gsol = ? ln Z sol +
X
X
�
�
hx� i � + 21
��h(x� )2i :
(3.85)
Eliminating � gives
X X Gsol = ? 21 C �� hx� ihx� i + 12 ln det(� + C ) + 21 ��R� : �;�
�
(3.86)
As for naive mean eld theory the rst term in Gsol may be identi ed with naive mean eld energy Genergy . 2 Another obvious choice which leads to
the same result is the Gaussian process regression model.
3.3. MEAN FIELD EQUATIONS FROM FREE ENERGY
45
To identify the entropy term Gsol 0 for the solvable model, one has to calculate the single variable contribution X Z dx� 12 P� ��(x� )2 +P� x� � X � � 1 X Gsol = ? ln p e + hx i + 2 ��h(x� )2i 0 2 �i � � � X 1 m ln (?R� ) : (3.87) = ? ? 2 2 � The second equality is obtained by eliminating � and ��.
TAP Gibbs free energy. We now have identi ed all the terms needed for the Gibbs free energy G = G0 + Gsol ? Gsol 0 X X G = ? 12 C �� hx�ihx� i + 12 ln det(� + C ) + 12 ��R� �;� � X 1 m (3.88) + 2 + 2 ln (?R� ) + G0 ; �
where G0 is given by eqs. (3.74) and (3.75) for regression and classi cation respectively. The TAP Onsager term may thus be identi ed with X X GOnsager = 21 ln det(� + C ) + 21 �� R� + m2 + 21 ln (?R� ) : (3.89) � � @G @G Mean eld equations. The saddle-point conditions @@G hx� i = @ h(x� )2 i = @ �� = 0 give the
following G0 independent saddle-point equations
X
C�� hx� i ? �� hx�i � �� = ?(�� + R1 ) � i h R� = ? (� + C )?1 �� ;
� =
(3.90) (3.91) (3.92)
where the last equation is for ��. The two last saddle-point conditions @ @G� = @�@G� = 0 are dependent on the model. For regression �� is identi ed with the noise variance �2 and one nds the exact results eqs. (3.67) and (3.68) for hx� i and R� . For classi cation the saddle-point conditions lead to same expressions as for naive mean eld theory eqs. (3.80) and (3.81), but now with �� given by eq. (3.91) (and not the naive mean eld result eq. (3.77) �� = C�� ). For both regression and classi cation the order parameters � and �� may be identi ed with cavity averages hh�i� and h(h�)2 i� ? hh�i2�. The di�erence between the naive mean eld theory and this mean eld theory only comes through the expression for �� . Denoting
CHAPTER 3. ALGORITHMS
46
the reduced (m-1)�(m-1)-covariance matrix without the �th example by C�, and using the matrix identity eq. (2.31) for the partitioned inverse, eq. (3.91) may be rewritten i h X (3.93) �� = C�� ? C��0 (�� + C�)?1 �0 �0 C�0 � : �0 ;� 0 6=�
The naive mean eld expression eq. (3.77) is the rst term in this expression and the second term is the correction to the naive mean eld result.
Self-Averaging Ansatz for Onsager Term
The Onsager reaction term eq. (3.89) is expected to be self-averaging in the thermodynamic limit for the simple perceptron learning scenario. One may therefore average 1 2 ln det(� + C ) in eq. (3.86) over the input distribution. For spherically distributed inputs it has been shown that det(� + C ) is self-averaging [50]. We expect the same to be true for correlated inputs. It is therefore enough to perform the simpler task of calculating det(� + C ). The determinant is rewritten using the Gaussian integral identity ! Z Y dx� X 1 1 ? � � p exp ? 2 x x (����� + C�� ) ; det 2 (� + C ) = �� � 2� making it possible to carry out the average over the input distributionPsi = 0 and sisj = Bij . Eliminating �� under the assumption �� = � and R� = R = N1 � R� leads to the simple result GOnsager = 12 ln det(I ? RB ) : (3.94) The nal result for the Gibbs free energy for the simple perceptron in the thermodynamic limit is therefore
X (3.95) G = ? 12 C�� hx� ihx� i + 12 ln det(I ? RB ) �;� � !# X X X "
� ? ln � + (1 ? 2�)� � p � + hx� i � + 21 � h(x� )2i : � � � � It is easy to check that the saddle-point conditions lead to the same mean eld equations as obtained by the cavity method with � being identi ed with the mean of the cavity eld hh� i�. Inserting the saddle-point solution into the free energy one gets X (3.96) G = ? N2 (1 ? � + ln �) + 21 hx� ihh�i� � � i� !# X " h h � ? ln � + (1 ? 2�)� � p � � The advantage with this approach, compared to the one without using the self-averaging assumption, is that the potentially very time consuming task of nding the diagonal elements of the inverse of a m�m-matrix is avoided. However, there are two dangers. First of all, the Onsager term might not be self-averaging in practical situations, and secondly, this approach requires knowledge of the second moments of the input distribution.
3.3. MEAN FIELD EQUATIONS FROM FREE ENERGY
47
3.3.3 Bayesian Estimation of Noise using ML-II
In the Bayesian ML-II model selection approach eq. (2.17), the hyperparameters are found from maximizing the probability of the training set p(Dm) = p(f� � gjfs�g) Q� p(s� ). But ? ln p(f� �gjfs� g) is nothing but the free energy which is equal to the saddle-point value of the Gibbs free energy. Here, we will consider classi cation and estimation of the output noise level �. At the saddle-point of G, ML-II simply corresponds to an additional saddlepoint condition dG d� = 0. The result for the saddle-point condition is
X �
�
1 ? 2� p ���
�
� � � =0 � + (1 ? 2�)� � � p ��
Averaging this saddle-point condition over the estimated predictive distribution
(3.97)
� !#
hp(� � jh�)i� = � + (1 ? 2�)� � � p � � � � { like it was done for the leave-one-out estimator in section 3.2 { gives the trivial result that the saddle-point condition is ful lled. This is reassuring since it shows, that on average, the correct noise estimate will be a solution to the saddle-point condition. The ability of the mean eld approach to correctly estimate the noise level will be tested in simulations in section 5.3.1. An average case analysis valid in thermodynamic limit (and thus neglecting nite size e�ects) is presented in section 4.3.
Y
Y"
48
CHAPTER 3. ALGORITHMS
Chapter 4 Average Case Analysis In this chapter the average case performance of the neural network algorithms derived in the previous chapter will be studied for di�erent learning scenarios.1 The aim is to derive learning curves, i.e. the average generalization error over all possible training sets and teachers (with xed hyperparameters, e.g. noise level) versus the number of training examples � = Nm . Below, we shall show how the two types of averages needed in the average case analysis are performed in the thermodynamic limit using the cavity method. Firstly, we will consider the average over the input distribution needed to compute the generalization error. It will be shown that the generalization error will be a function of self-averaging order parameters. Thus, the generalization error will also be self-averaging. Secondly, we will show how saddle-point equations for the order parameters may be obtained directly from the mean eld algorithm. Here, a second average over the distribution of the training set is needed to get rid of the explicit training set dependence. This average may also be performed using the cavity method. We will use Bayes algorithm for the simple perceptron as an example to show how the generalization error and the saddle-point equations for the order parameters are found. In the rest of the chapter, we shall not go into as much detail because the results follow from exactly the same type of considerations as in the example given here.
Generalization error. The generalization error of Bayes algorithm eq. (2.12) for the
consistent scenario is given by �Bayes (Dm) = h 1 ? p(� Bayes (s; Dm )js; Dm) is = h p(?� Bayes (s; Dm)js; Dm) is ; where the second equality holds for binary �1 classi cation. For the simple perceptron the predictive probability eq. (3.5) is ! h h i p(� js; Dm ) = � + (1 ? 2�)� � p ; � p R where �(x) = ?1x Dt, Dt = dte?t2 =2= 2�, hhi = p1N hwi � s, � = N1 Pij Bij (hwiwj i ? hwiihwj i) and Bij = hsisj i. The Dm dependence is implicit in the two rst moments of the weights. The Bayes classi er � Bayes (s; Dm ) eq. (2.12) is given by eq. (3.6) for the simple perceptron � Bayes (s; Dm) = signhhi : 1 This
chapter.
chapter is not necessary for understanding the the simulation results presented in the next
49
CHAPTER 4. AVERAGE CASE ANALYSIS
50
The expression for the generalization error therefore becomes ! jh h ij Bayes � (Dm) = � + (1 ? 2�)h� ? p is : � The average over the input distribution with si = 0 and sisj = Bij will according to the central limit theorem make the eld hhi Gaussian with mean hhi = 0 and variance P 1 2 q = hhi = N ij Bij hwiihwj i. We may thus rewrite the above pqt ! Z1 Bayes � = � + (1 ? 2�)2 Dt � ? p : 0 � This integral may be carried out to give the well known result [38] �r � �Bayes (Dm ) = � + (1 ? 2�) �1 arccos Tq ; (4.1) with T = N1 Pij Bij hwiwj i. Below, it is shown that in the thermodynamic limit the order parameters q and T and thus also the generalization error are self-averaging. We will therefore in the following omit the Dm argument from the generalization error expressions.
Order parameter equations. The second task is to derive saddle-point equations q(�) and T (�). We will consider uncorrelated inputs, thus q = N1 hwi�hwi and T = N1 hw � wi =
1. The procedure to nd q(�) consists of two steps. First, we will use the mean eld equation eq. (3.22) X hwi = p1 s� hx� i N � to write q as X q = N1 hh� ihx�i :
where hx� i is given by eq. (3.31)
p
(4.2)
�
�
�
�
(1 ? 2�)D phh1?i�q � � � � hx i = � � + (1 ? 2�)� � � phh1�?i�q
and D(x) = e?x2=2 = 2� is the Gaussian measure. The second step is to average out the explicit example dependence appearing on the right hand side of eq. (4.2). Note that the input dependence of hx� i enters through the eld hh� i� = p1N hwi� � s� . This simpli es the calculation because hwi� and s� are uncorrelated. We may thus apply the central limit theorem to hh�i� , when taking the average over the input distribution, and conclude that it has mean hh�i� = 0 and variance hh�i2� = q. In the expression for q above, the eld hh�i appears. We may get rid of hh�i by using the relation between the full posterior mean and the reduced posterior mean of the eld eq. (3.34), hh� i = hh�i� + (1 ? q)hx� i, and thus write m X q = N1 (hh�i� + (1 ? q)hx� i)hx�i : (4.3) �=1 Each term in this sum is independent of the other, and q will therefore be self-averaging for m ! 1.
51
Average over training set distribution. The distribution of the �th training example for xed teacher w is given by p(� � jw; s�)p(s� ) with p(� � jw; s�) = � + (1 ? 2�)�(� � p1N w � s�). We may consider the teacher to be xed {
as will done for the inconsistent scenario { and average q over the training set distribution Q for xed teacher, which in this case is p(Dmjw) = � [p(� � jw; s�)p(s� )]. In the Bayesian scenario, on the other hand, we will average p(� � jw; s�) over the distribution of teachers w compatible with the m ? 1 remaining training examples p(wjDmn(s� ; � �)). This gives the following distribution for the �th example hp(� � jw; s�)i� p(s�) ; where the mean approximation for the reduced average is given by eq. (3.30) � i� ! h h � � hp(� jh )i� = � + (1 ? 2�)� � p1 ? q : Because the order parameter is self-averaging, the same result is obtained whether we consider the teacher xed or average over the distribution of teacher as it is done in the Bayesian scenario. After averaging over hp(� � jw; s�)i�p(s� ) every term in the expression p � for q eq. (4.3) gives the same contribution. Substituting hh i� with qt, t being a zero mean unit variance Gaussian variable, we nd pqt !# p XZ " Dt � + (1 ? 2�)� � p1 ? q ( qt + (1 ? q)hxi)hxi ; q=� (4.4) � =�1 where �p � (1 ? 2�)D p1qt?q � p �: hxi = � � + (1 ? 2�)� � p1qt?q The average over � simply yields a factor of 2, and after a few manipulations we obtain the nal result Z 2 e? 21 qt2 q (1 ? 2 � ) � q = � 1 ? q Dt � + (1 ? 2�)�(pqt) ; (4.5) which may also be obtained from a replica calculation (see e.g. [38]). The solution to eq. (4.5) implies a smooth decay of the generalization error with �, as shown in gure 5.1.
Outline. The rest of this chapter is organized as follows: In section 4.1 the generalization error expressions for the di�erent architectures and scenarios will be derived. This includes the simple perceptron for both the consistent and an inconsistent scenario and the consistent scenario for the large fully connected committee machine. For an inconsistent scenario, the model used for learning is not necessarily identical to the one which generated the training set. In the inconsistent scenario considered here, the teacher and student are for simplicity both simple perceptrons, but they will be allowed to have different noise levels. The rest of the sections are devoted to nding saddle-point equations for the order parameters. Section 4.2 deals with the consistent continuous-weights scenarios. Section 4.3 deals with the performance of Bayes algorithm for an inconsistent scenario. We furthermore consider the Bayesian ML-II estimation of the noise levels and the stability of the solution to the saddle-point equations.
52
CHAPTER 4. AVERAGE CASE ANALYSIS
4.1 Generalization Error In the following, the generalization error expressions for Bayes algorithm eq. (2.12), optimal learning eq. (2.39) and Gibbs algorithm eq. (2.38) will be derived. The simple perceptron (both the consistent and inconsistent scenario) and the fully connected committee machine are considered. We will allow the inputs to be correlated si = 0 and sisj = Bij .
Simple Perceptron Consistent Scenario
The well known generalization error expressions for the three algorithms are [38, 21, 36] �r � �Bayes = �opt = � + (1 ? 2�) �1 arccos Tq (4.6) �q� 1 Gibbs � = � + (1 ? 2�) � arccos T : (4.7)
We have already derived the results for Bayes algorithm for the simple perceptron consistent scenario in the rst part of the chapter. The optimal learning result is identical to the Bayes result because the the optimal learning classi er is identical to the Bayes classi er for the simple perceptron. The Gibbs result may be derived by noting, that averaged over the posterior � hhi � a Gibbs classi er (described in section 2.4) will give output � with probability � � p� . The probability that� � is�the correct output is given �by the� predictive probability p(� js; Dm ) = � +(1 ? 2�)� � phh�i . Therefore averaging 1 ? � � phh�i over p(�; s) = p(� js; Dm )p(s) gives the expected error of Gibbs algorithm.
Inconsistent Scenario
For the inconsistent scenario the training data is assumed to be generated by a noisy perceptron teacher v with output noise level �t pt(� jv; s) = �t + (1 ? 2�t )�(�hv ) ; (4.8) where hv = p1N v � s. The generalization error of Bayes algorithm for the inconsistent scenario for xed v is therefore Bayes (v; D ) = h p (?� Bayes (s; D )jv; s) i : �incon m t m s This expression is expected to be self-averaging in the thermodynamic limit, so it does not Bayes (v; D ) over the posterior distribution matter whether we consider v xed or average �incon m pt(vjDm). Using the same techniques as above, we may derive the generalization error expressions for the inconsistent scenario. Now we have to consider two correlated Gaussian elds with mean hv = hhi = 0 andPcovariance h2v = Tt , hv hhi = R and hhi2 = q where P R = N1 ij Bij vihwj i and Tt = N1 ij Bij vivj are additional order parameters. Going through similar steps as above, we nd ! 1 R opt Bayes �incon = �incon = �t + (1 ? 2�t) � arccos pqT (4.9) t ! R 1 Gibbs : (4.10) �incon = �t + (1 ? 2�t ) � arccos p TTt
4.1. GENERALIZATION ERROR
53
Note that even in the inconsistent scenario, Bayes algorithm will be better than Gibbs Bayes � �Gibbs . This may be seen from the fact that T ? q = hh2 i ? hhi2 � 0. algorithm �incon incon
Committee Machine For the large committee machine, the Bayes classi er eq. (3.15) andPoptimal � hhk i �classi1 Bayes out p er eq. (3.16) are respectively � (s; Dm) = signhh i = sign K k g p�kk and � opt (s; Dm ) = sign Pk signhhk i with g(x) = 2�(x) ? 1. The derivation of the generalization error expression becomes very similar to the simple perceptron case, because � � the average over the input distribution implies that the elds hhout i = p1K Pk g phh�kkki and p1 Pk signhhk i become Gaussian. To calculate the generalization error expressions, we K need the predictive probability which is given by eq. (3.14) for the large fully connected committee machine out i ! h h p(� js; Dm ) = � + (1 ? 2�)� � p out � with �out = T out ? qout ,
T out qout
!
X 2 X arcsin p Tkl = K1 hsignhk signhl i = �K Tkk Tll kl kl ! ! ! X hhk i X 2 h h i 1 q l kl g p = �K arcsin p = K g p Tkk Tll �kk �ll kl kl
and qkl = N1 Pij Bij hwkiihwlj i and Tkl = expressions become
�Bayes �opt �Gibbs
qopt
!
(4.12)
P B hw w i. The generalization error ij ij ki lj
0s 1 out = � + (1 ? 2�) 1 arccos @ q out A � T opt ! 1 R = � + (1 ? 2�) arccos p out opt � T !q out = � + (1 ? 2�) �1 arccos Tq out ;
with the additional parameters de ned as
Ropt
1 N
(4.11)
(4.13) (4.14) (4.15)
!
X X = 1 g phhk i signhhl i = 2 arcsin p qkl Tkk qll K kl �K kl �kk ! X X 1 2 q kl = K signhhk i signhhl i = �K arcsin pq q : kk ll kl kl
(4.16) (4.17)
It is possible to show that these results coincide with the results found by Winther, Lautrup and Zhang [39], where symmetry assumptions about the order parameters were made.
CHAPTER 4. AVERAGE CASE ANALYSIS
54
4.2 Consistent Scenarios As shown in the beginning of the chapter, the starting point of the derivation of learning curves are the mean eld equations (summarized in appendix B). For simplicity the derivation will be restricted to uncorrelated inputs Bij = �ij . We expect qualitatively similar results for correlated inputs. The weight priorsR considered are spherical Gaussians in the input variables, i.e. the simple perceptron dwp(w)wiwj = �ij For the Rfully connected committee machine correlation between hidden units will be allowed, Q i.e. k dwk p(fwk g)wkiwlj = �ij Tkl(0) . Since for spherical input distributions, the weight prior xes the correlation, one has T = N1 hw � wi = 1 for the simple perceptron and Tkl = N1 hwk �wli = Tkl(0) for the fully connected committee machine. The only varying order parameters are therefore q = N1 hwi�hwi for the simple perceptron and qkl = N1 hwk i�hwli for the fully connected committee machine.
4.2.1 Simple Perceptron
We have already derived the the saddle-point equation for this scenario eq. (4.5). The training error for the Bayes classi er eq. (3.42)
X �t (Dm) = m1 �(?� � hh� i) �
depends upon the full posterior mean of the elds. But this may be written in terms of the cavity posterior elds using eq. (3.34). Averaging over the example distribution as done above, one arrives at the expression
� pqt � 1 pqt ! 0p p1?q (1 ? 2 � ) D � p �A �t = 2 Dt(� + (1 ? 2�)� p1 ? q )� @ qt + � + (1 ? 2�)� p1qt?q Z
(4.18)
The same procedure may be followed for the other scenarios, but that will not be pursued here.
4.2.2 Committee Machine
Before considering the fully connected architecture, the tree committee machine is used to illustrate how the saddle-point equations for multi-layer networks are derived.
Tree committee machine. The mean eld equations for a spherical Gaussian prior in the limit of a large number of hidden units limit are [40] hwk i =
s
K X s�hx� i k N �
� � hx�k i = @ lnh@ph(h�� ijh )i� = k �
�
�
�
�
� �out i� (1 ? 2�)D phh1?qout � � g0 phh1k?iq�k � � q i� (1 ? qout )(1 ? qk ) � + (1 ? 2�)� � � phh�outout 1?q
(4.19)
;(4.20)
4.2. CONSISTENT SCENARIOS 55 � hh� i � P 1 � out p where hh i� = K k g p1k?q�k and qout = �K2 Pk arcsin qk . Two zero mean Gaussian � hh�i � q � � � 1 2 � out p elds with covariance hhk i� = qk , hhk i�hh i� = K hhk i� g p1k?q�k = �K2 qk and hh�out�i2� =�qout may now be identi ed. The correlation between the two elds only give
an O p1K contribution and may therefore be neglected to leading order. The nal result for the saddle-point equation is
p
Z 2 e? 21 qout t2 1 ? q (1 ? 2 � ) 2 � k Dt � + (1 ? 2�)�(pqout t) ; qk = � 2 q (1 ? qout )(1 + qk )
(4.21)
which has the solution qk = q. This result was rst derived by Schwarze and Hertz [59] using the replica method. The learning curve for tree committee machine is qualitatively identical to the one for the simple perceptron [59, 40].
Fully Connected Committee Machine
First the saddle-point equations for qkl for general choice of Tkl will be derived. The solution will therefore depend upon Tkl , � and �. However, no attempt to solve the equations will be made. It will be shown that they reduce to the result of Schwarze [60], who studied the simplest case of Tkl = �kl and made the following symmetry assumption qkl = �klq +D to reduce the number of order parameters. Under this symmetry assumption Winther, Lautrup and Zhang [39] studied Bayes algorithm and optimal learning. The results will be summarized here. The expression for the posterior mean weights for general Tkl is X X hwk i = p1 s� Tkl hx�li : (4.22) N � l and the result for hx�li eq. (3.57) is unchanged. A straightforward generalization of the above derivations leads to the result
� hhouti � 2 D2 p Z (1 ? 2 � ) X Tkl0 �k0l 0 hhk0 i ! 0 hhl0 i ! 2 � out � � � p g p 0 0 g p 00 : qkl = K�out dsp(s) �k k �l l � + (1 ? 2�)� phh�outouti k0l0 �l0l0 �k0k0
(4.23) The input average will make the elds into correlated Gaussians: hhk ihhli = qkl , hhk ihhouti = q 2 P qkl out �out 2 �K l pTll and hh i� = q . This is the most general result for the large fully connected committee machine. To evaluate the right hand side, one has to perform an average over a three dimensional Gaussian measure with the above covariance. If the equations have more than one solution, the physical solution is the one with the lowest free energy. So the solution to saddle-point equations alone, do not describe the thermodynamics of the system. The free energy may be derived either from the replica or cavity method [7, 61, 60].
Symmetry Assumption for Tkl = �kl
The saddle-point equations may be simpli ed if hhk ihhout i is small. For Tkl = �kl , one may follow ref. [60] and prove self-consistently that qkl � O(K ?� ) for k 6= l, where � is a
CHAPTER 4. AVERAGE CASE ANALYSIS
56
coe�cient. One thus has hhk ihhout i � O(K 12 ?� ). If � > 21 the correlation hhk ihhouti may be disregarded to leading order in K . The saddle-point equations reduce to 2 e? 21 qout t2 X �kk0 Z 2 � 1 (1 ? 2 � ) qkl = K�2 p out q Dt � + (1 ? 2�)�(pqout t) : (4.24) � k0 1 ? qk20 l Using 1the quite plausible permutation symmetric assumption qkl = �klq + D with D < O(K ? 2 ), one arrives at the following two equations s ! � 1 + q out q = K f (q ) 1 ? q ? DK (4.25) (4.26) D = K� f (qout ) (1 ? q ? DK ) ; where f (qout ) is order one
qout t2 2 p 1 Z Dt (1 ? 2�)2 e? 12p (4.27) �2 �out � + (1 ? 2�)�( qout t) : Two scaling regimes for � may be identi ed. For � � O(1) the solution to the equations is q = 0 { signaling that the network is far from the capacity limit { and D � O( K1 ) thus proving the scaling assumption. For � � O(K ) above a certain value of �, the saddle-points equations have two solutions: the previous q = 0 solution which in this limit simpli es to D = K1 and a solution with q = O(1) and DK = 1 ? q. For � = 0 the thermodynamic transition between the two solutions is at �K = 7:65 and the q = 0 solution is meta-stable [60]. The average case analysis for Bayesian algorithm and the optimal learning algorithm has also been done [39]. In the nite � regime, Bayesian learning and optimal learning are equivalent. This may be seen from inserting the saddle-point solution into the generalization error expressions above. In this regime, the best student is a singlepsimple perceptron, which may be seen from the fact that since the normalized overlap qkl = qkk qll is 1 for qkl = �kl q + D = D, all the mean weight vectors must be parallel. Thus, lacking training data, it is best to be conservative, only exploiting a fraction of the computational powers of the learning machine. On the other hand for � � O(K ) in the q > 0 solution, the hidden units perform distinct mappings and the Bayes classi er is superior to the optimal learning classi er. Asymptotically { for �=K ! 1 { the two are equivalent and the following simple relation holds
f (qout ) =
?t2 =2 !?1 K e K: Dt �(t) � 0 : 883 � � This relation has also been found for the simple perceptron [38, 21]. The last equality may be understood by noting that �kk ! 0 for �=K ! 1, and thus the expressions for the Bayes and optimal learning classi ers eqs. (3.15) and (3.16) become identical.
�Bayes
= �opt
p = �Gibbs = 2 = 2
Z
4.3 Inconsistent Scenario The inconsistent scenario studied here is almost the simplest possible. The teacher, which provides the output label is a noisy simple perceptron. The noise level �t is not necessarily
4.3. INCONSISTENT SCENARIO
57
equal to the one used in the algorithm. The distribution of the output is given by eq. (4.8). Again the analysis will be restricted to uncorrelated inputs and a spherical prior for v thus Tt = 1. The two order parameters of problem are X q = N1 hwi � hwi = N1 hh� ihx�i (4.28) � X (4.29) R = N1 v � hwi = N1 h�v hx� i ; � where h�v = p1N v � s� . The �th term should be averaged over the distribution of �th example p(s� )pt (� � jv; s�). The average over the inputs will make the distribution of hh�i� and h�v a zero mean joint Gaussian with covariance hh� i2� = q, hh�i�h�v = R and (h�v )2 = 1. The saddle-point equations become
�
�
Rp1?q t �t + (1 ? 2�t )� p R2 Dt (� + (1 ? 2�)�(pqqt?)) 2
Z q � 2 q = � 1 ? q(1 ? 2�) e? 12 qt2 � p � s q pR q?1?Rq2 t � + (1 ? 2 � )� Z t t 2 p (4.30) +� � q 1 ? q(1 ? 2�) Dt t � + (1 ? 2�)�(pqt) ( s ? 21 Rq?1R?2q) t2 2Z � (1 ? 2 � )(1 ? 2 � ) e R t R = � 1 ? q Dt � + (1 ? 2�)�( pqt) � p � s pR q?1?Rq2 t � + (1 ? 2 � )� Z t t q 2 R +� � pq 1 ? q(1 ? 2�) Dt t � + (1 ? 2�)�(pqt) : (4.31) For � = �t the equations reduce to the Bayesian case with q = R. This follows from the fact that the order parameters are self-averaging and v is sampled from the same distribution as w. For general � the order parameters will be functions of �, � and �t. Solving these equations will give the expected generalization error of the di�erent algorithms eqs. (4.9)-(4.10). Furthermore, one may calculate the expectation values of the generalization error estimators eq. (B.7)-(B.8), the stability eq. (B.8), the saddle-point condition eq. (B.9) for ML-II estimation of the noise level � and the free energy is eq. (3.96). The averages are computed as above and the results are 1. Generalization error estimators: ! R 1 �loo1 = �t + (1 ? 2�t ) � arccos pq (4.32) �loo2 = �est = � + (1 ? 2�) �1 arccos(pq) : (4.33) This shows that only �loo1 is unbiased estimator of the generalization error eq. (4.9). �loo2 and �est are biased because they are already averaged over the wrong predictive probability.
CHAPTER 4. AVERAGE CASE ANALYSIS
58 2. Stability:
!! Rt 1 ? 2� Dt �t + (1 ? 2�t)� p q ? R2 pqt !2 pqt pqt !!2 p1 ? q + p1 ? q > 0 ;
p1 ? q
where
Z
(x) = (1 ? 2�)D(x) : � + (1 ? 2�)� (x)
3. ML-II saddle-point condition:
�
Z �t + (1 ? 2�t)� pqRt?R2 �p � 2�N Dt � + (1 ? 2�)� p1qt?q
�
pqt !! 1 ? 2� p1 ? q = 0 :
(4.34) (4.35)
(4.36)
4. Free energy:
! 2 q ? R N (4.37) G = ? 2 1 ? q + ln(1 ? q) !! pqt !! Z Rt ?�N Dt �t + (1 ? 2�t )� pq ? R2 ln � + (1 ? 2�)� p1 ? q :
We compare the theoretical predictions for the inconsistent scenario with simulations in section 5.3.
Chapter 5 Simulations In this chapter the mean eld algorithms { developed in chapter 3 { are tested in simulations on both arti cial data learning scenarios and on a few benchmark data sets. The chapter has the following outline. In section 5.1, it is described how the mean eld equations are solved for the case of the simple perceptron with self-averaging second moments of the cavity elds. In section 5.2, simulation results and the theoretical predictions (from chapter 4) for consistent scenarios are compared. This is done for both the simple perceptron and the fully connected committee machine. Finite size e�ects and simulations for the naive mean eld theory are also considered. In section 5.3, the inconsistent simple perceptron scenario is studied. Results for learning curves, generalization error estimators and stability for di�erent teacher and student noise levels are given. Finally, simulation and theoretical results for the Bayesian ML-II saddle-point for estimation of the output noise level are given. In section 5.4 the mean eld algorithms are tested on three small publicly available benchmark data sets: `Sonar { Mines versus Rocks' [65], `Pima Indians Diabetes' and `Leptograpsus Crabs' [2].
5.1 Solving the Mean Field Equations The mean eld equations are solved by iteration. The whole scheme is summarized in table 5.1 in pseudo-C for the simple perceptron and details are given here. Iteration (in one dimension) means solving the equation x = f (x) by updating an estimate of the solution using the prescription xt+1 = (1 ? �)xt + �f (xt) = xt + �(f (x) ? x). We may analyze the convergence condition close to the solution x� , where the di�erence �x = x ? x� is small. Expanding to rst order in �x, we obtain �xt+1 = (1 + �(f 0(x� ) ? 1))�xt . The condition for i.e. that the iterative approach gets closer to solution in every step is �xtconvergence, +1 �xt = j1 + �(f 0(x� ) ? 1)j < 1. This implies the following condition for the derivative of f at the solution 1 ? 2=� < f 0(x� ) < 1. In our simulations, using the value for the learning rate given below, the iterative scheme has always converged. Whether the mean eld equations have a solution or not is in principle indicated by the sign of the stability, which we have calculated in section 3.2 for the simple perceptron. In practice, it has turned out that it does not matter whether the stability becomes negative or not. This suggests, that even though a more advanced mean eld theory corresponding to replica symmetry breaking gives the correct physical description of the system, the mean eld theory corresponding to replica symmetry may still be used as a good approximation. 59
CHAPTER 5. SIMULATIONS
60
: Solving the mean eld equations by iteration parallel update.
Table 5.1
/* initialize */ =0.1; ftol=0.1; max ite=100; =1.0; calculate eigenvalues
�
�
�
� m�
for( =1; ftol && ite ftol && ite