May 29, 2017 - 4082. Coastal Engineering 2006 Downloaded from www.worldscientific.com by NATIONAL AUTONOMOUS UNIVERSITY OF MEXICO (UNAM) ...
BEACH NOURISHMENT IN CUNIT, SPAIN: SHIFTING FROM HARD TO SOFT PROTECTION
Coastal Engineering 2006 Downloaded from www.worldscientific.com by NATIONAL AUTONOMOUS UNIVERSITY OF MEXICO (UNAM) on 05/29/17. For personal use only.
Christian M. Appending, Jose Maria Medina Villaverde2, Jordi Galofre3, Jose Santos Lopez Gutierrez2 and Alejandro Palmeiro2 A beach protection enhancement project has been developed for the Spanish Coastal Authority following guidelines for littoral enhancement set by the Ministry of the Environment's coastal zone management plan. Located on the northern Mediterranean coast of Spain, Cunit is a 3.000-meter urban beach protected by a series of detached breakwater. This long stretch of beach constitutes probably the most important asset of the Municipality of Cunit, which relies on tourism as the main income source. The coastal front development combined with beach erosion in the eighties resulted in beach protection with detached breakwaters creating a series of pocket beaches. Despite to the strong armouring of the coast, erosion problems are still evident and critical at some points of the coast, as well as flooding. On the other hand, the existing structures represent also a hazardous condition for swimmers. As a result, a critical analysis of the existing structures has been overtaken, which together with detailed analysis of the coastal processes, have allowed to provide a new solution, replacing the hard structures with soft protection.
INTRODUCTION The coast of Cunit, located in the north Mediterranean coast of Spain (Figure 1) has been under protection measures since the seventies and beginning of the eighties, in order to reduce the beach erosion problem on its beaches. The main protection scheme consisted in the construction of a series of detached breakwaters, as shown in Figure 2, so that a series of pocket beaches were created to provide protection and leisure space.
DHI Inc., 577 Second street, Encinitas CA, 92024, USA - Formerly in Coastal and Natural Resources Departmen, Alatec, S.A. Madrid, Spain Marine Division, DHI Espana, Isabel de Valois, 20, 28660 Boadilla del Monte, SpainFormerly in Coastal and Natural Resources Departmen, Alatec, S.A. Madrid, Spain Servicio Provincial de Costas de Tarragona, Direction General de Costas, Plaza Imperial Tarraco, 4, 3a planta, Tarragona, Spain 4082
4083
COASTAL ENGINEERING 2006
Coastal Engineering 2006 Downloaded from www.worldscientific.com by NATIONAL AUTONOMOUS UNIVERSITY OF MEXICO (UNAM) on 05/29/17. For personal use only.
^w /
n
^'
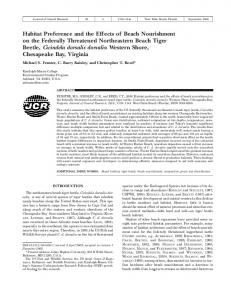
Figure 2.-Aerial photograph of Cunit, 1995
Despite the adopted protection scheme, there are still important problems in the area. On one hand, the detached breakwaters have proved not to be an effective coastal defense system in this particular case, without creating a beach wide enough for backshore protection in the area between breakwaters. And on the other hand, the elevation of the coastal promenade is to low, so that during extreme events there arefloodingand sand invasion problems (Figure 3).
Coastal Engineering 2006 Downloaded from www.worldscientific.com by NATIONAL AUTONOMOUS UNIVERSITY OF MEXICO (UNAM) on 05/29/17. For personal use only.
4084
COASTAL ENGINEERING 2006
Figure 3.- Promenade flooding and sand sedimentation after extreme events
Other problems are created with this protection scheme, such as the creation of strong currents which are potentially dangerous for the beach users, as it is the advice of the authorities not to swim in those areas (Figure 4).
Figure 4.- Swimming prohibited sign
The main objective of this paper is to present the solution proposed to the Spanish Government in order to solve the erosion and flooding problems at Cunit.
COASTAL ENGINEERING 2006
4085
LITTORAL DYNAMICS
Coastal Engineering 2006 Downloaded from www.worldscientific.com by NATIONAL AUTONOMOUS UNIVERSITY OF MEXICO (UNAM) on 05/29/17. For personal use only.
Sediment transport in the area of Cunit is highly sensitive to the orientation of the coast, due to the peculiar wave climate dominating the transport (figure 5). From the wave rose it is clear than the sediment transport will be dominated by the SSW and E waves. Altura Significative!
(in)
y.2 - 00 0.5 - I .0 1.0-1,5 1.5-2.0 2.0 - 2.5
Figure 5.- Wave rose at 65 m depth offshore the coast of Cunit
A general calculation of the sediment transport rates was obtained for different stretches of coast between Arenys de Mar (northeast of Barcelona) and Calafat (southwest of Tarragona). The transport rates were calculated with LITPACK, CERC and Kamphuis formulations. As a result of the wave climate and the shoreline orientation, the net sediment transport is from northeast to southwest, with exception of Cunit and adjacent areas (figure 6) Longshore sediment transport --X...CERC
y*
-j
I
i
1
—o— Kamphuis
*
•••«—LITPACK 1 J
at
x
, X
* x~"
Figure 6.- Longshore sediment transport estimates (negative transport is from northeast towards southwest)
COASTAL ENGINEERING 2006
Coastal Engineering 2006 Downloaded from www.worldscientific.com by NATIONAL AUTONOMOUS UNIVERSITY OF MEXICO (UNAM) on 05/29/17. For personal use only.
4086
Despite the net longshore transport rates at Cunit show a northeasterly directed transport, the transport rates can be considered null for practical applications (figure 7), although the gross transport rate is in the order of 300,000 m3/year. This means that a slight shift in the shoreline orientation or a year with a more dominant wave condition can create a considerable shift in the net transport rate, but that in the average the shoreline is in equilibrium. This conclusion is also obtained from aerial photographs showing a symmetrical shape of the tombolos (see figure 2). Longshore sediment transport (LITPACK)
-100000
•200000
* E
80
90
100
110
120 130 140 150 180 Shore normal orientation
170
180
190
200
210
- Gross transport
-Net transport
Figure 7.- Longshore sediment transport estimates for different shoreline orientations using the wave climate at Cunit (negative transport is from northeast towards southwest)
A more detailed 2D study was undertaken with the MIKE 21 system, following the flowchart shown in figure 8. Wave propagation was performed to obtain the wave fields in order to model the currents and the sediment transport. wave MIKE21PMS
«
1
Radiation stress (Sxx, Sxy, Syy)
/ W A NA* - / 206 1049
/
7
/
MIKE 21 HD
Hydrody namic condit ons Wave parameters (Hs, Tm, dir)
i
MIKE 21 ST
Figure 8.- Detailed modeling flowchart (* WAM data from the Port Authority of Spain)
COASTAL ENGINEERING 2006
4087
Coastal Engineering 2006 Downloaded from www.worldscientific.com by NATIONAL AUTONOMOUS UNIVERSITY OF MEXICO (UNAM) on 05/29/17. For personal use only.
The sediment transport results confirmed the rate estimation mentioned before, obtaining a net longshore transport rate of approximately 15,000 m3/year with a northeasterly direction (see figure 9).
Figure 9.- Longshore sediment transport at Cunit under present conditions
From the results obtained in the coastal processes analysis it was possible to develop alternative solutions. PROJECT ALTERNATIVES
Considering the criteria establish by Seiji, et al. (1987) for gap erosion in a system of detached breakwaters, it is expected to have erosion between the five breakwaters located at the west, where the narrowest stretches of the beach are present. From this, it is suggested that longer detached breakwaters, located further offshore and with longer gaps between breakwaters could provide a solution. This was tested for several detached breakwaters configurations, from which only two configurations are shown in the present paper (figure 10 and figure 11). The alternatives include a beach nourishment that will advance the shoreline in about 75 m, and a groin at the eastern end of the beach for reducing longshore sand losses (the marina at the west end of the beach already fulfill this function). Together with the alternatives shown, another alternative was developed including only the groin at the east end of the beach and the sand nourishment (figure 12). For all the alternatives, a 2D modeling analysis was performed for the assessment of the longshore sediment transport patterns. Also, a shoreline
change study was done for all alternatives.
Coastal Engineering 2006 Downloaded from www.worldscientific.com by NATIONAL AUTONOMOUS UNIVERSITY OF MEXICO (UNAM) on 05/29/17. For personal use only.
4088
COASTAL ENGINEERING 2006
Figure 10.- Alternative I. Nourishment, groin and long detached breakwater
Figure 11.- Alternative II. Nourishment, groin and two long detached breakwaters
Figure 12.- Alternative III. Nourishment and groin
4089
COASTAL ENGINEERING 2006
Coastal Engineering 2006 Downloaded from www.worldscientific.com by NATIONAL AUTONOMOUS UNIVERSITY OF MEXICO (UNAM) on 05/29/17. For personal use only.
From the shoreline change analysis performed to the different alternatives, it was determined that the beach nourishment without detached breakwaters was stable enough. On the other hand, the presence of the detached breakwaters resulted in a redistribution of sand in the area, creating accretion in some parts but erosion in others, without proving the optimal solution. The results of the shoreline change analysis are presented in figures 13 through 15.
V I
1
5
9
13
17
21
25
29
33
37
41
45
49
53
57
61
65
•Present shoreline
J
69
73
77
61
65
89
93
97
Nourishment
101 105 109 113 117 121
• 10 years
Figure 13.- Shoreline change analysis for Alternative I
5
9
13
17
21
25
29
33
37
41
45
49
53
57
61
65
• Present shoreline
69
73
77
81
85
89
93
97
Nourishment
101 105 109 113 117 121
•10 years
Figure 14.- Shoreline change analysis for Alternative I
'"A _/v_ j** 5
9
13
17
21
25
29
33
37
41
45
49
53
• Present shoreline
57
61
65
69
73
77
81
85
89
Nourishment
Figure 15.- Shoreline change analysis for Alternative I
93
97
101 105 109 113 117 121
• 10 years
4090
COASTAL ENGINEERING 2006
Coastal Engineering 2006 Downloaded from www.worldscientific.com by NATIONAL AUTONOMOUS UNIVERSITY OF MEXICO (UNAM) on 05/29/17. For personal use only.
SELECTED ALTERNATIVE
From the 2D modeling of the different alternatives, as well as the morphological response analysis, Alternative III was selected. The results from the 2D analysis of sediment transport are shown in Figure 16. As it is seen, there are no steep gradients in sediment transport, so that it is considered a stable nourishment from the longshore transport perspective. Still, due to the high gross transport and the inter-annual change in wave climate, the beach nourishment is confined by groins at both ends. The sediment transport map shown in Figure 16 also shows that there are no sand losses out of the beach system.
Figure 16.- Annual sediment transport for alternative III
Figure 15 shows that the nourishment is also stable in the shoreline changes perspective, where shifts in the shoreline orientation are expected due to interannual wave climate variability. Despite those changes, the shoreline width is considered adequate even after the sand is redistributed along the beach. The beach profile for the nourishment was also studied in order to assess the expected erosion from initial nourishment, as well as from the equilibrium profile as obtained from the fill grain size applying Dean (1991) formulation. Two models were applied: PETRA (developed by the Grupo de Ingenieria Oceanografica y de Costas from the University of Cantabria, for the Spanish Coastal Authority) and SBEACH (Rosati, et al. 1993). The results are shown in Table 1. Table 1. Profile erosion obtained from PETRA and SBEACH. (Storms are considered to act for 48 hours) Case
Profile
Waves
1 2 3 4
Nourishment
Mean climate, P = 0.95 Extreme climate P = 40 yrs Mean climate, P = 0.95 Extreme climate P = 40 yrs
Equilibrium
Erosion (m) PETRA 0.8 2.5 0 1.2
Erosion (m) SBEACH 5 10 0 2.5
COASTAL ENGINEERING 2006
4091
Coastal Engineering 2006 Downloaded from www.worldscientific.com by NATIONAL AUTONOMOUS UNIVERSITY OF MEXICO (UNAM) on 05/29/17. For personal use only.
The results obtained show that the maximum expected erosion with a 40 years storm persistent during 48 hours in a 10 m erosion of the profile. This erosion is considered acceptable for the project. In order to address the flooding issues, a dunar field is considered, so that there is a net increment in the height of the beach profile that will provide protection against storm surge. CONCLUSIONS
Based on the analyses performed, the actual beach protection system in Cunit does not address erosion and flooding issues. As a result, it was evaluated and several alternatives for solution were proposed. Based on the littoral dynamics, an alternative was selected which encompass the removal of the existing detached breakwaters, the construction of a groin at the eastern end of the beach, and a beach nourishment with a final design width increment of 75 meters. The proposed alternative was evaluated from the littoral dynamics perspective and geomorphological evolution, proving to be an effective measure providing coastal protection. REFERENCES
Dean, R.G. 1991. Equilibrium beach profiles: characteristics and applications, Journal of Coastal Research 7(1), 53-84. Rosati, J.D., R.A. Wise, N.C. Kraus and M.Larson. 1993. SBEACH: Numerical Model for Simulating Storm-Induced Beach Change, Report 3, Users Manual, US Army Waterways Experiment Station, Vicksburg, MS, May 1993.