Framework for proper beach nourishment as adaptation to beach erosion due to sea level rise
467
Framework for proper beach nourishment as an adaptation to beach erosion due to sea level rise Jun Yoshida†, Keiko Udo‡, Yuriko Takeda‡, Akira Mano‡ †Department of Civil and Environmental Engineering, Tohoku University, Sendai 980-8579, Japan
[email protected]
‡International Research Institute of Disaster Science, Tohoku University, Sendai 980-8579, Japan
[email protected] [email protected] [email protected]
www.cerf-jcr.org
ABSTRACT Yoshida, J., Udo, K., Takeda, Y., Mano, A., 2014. Framework for proper beach nourishment as adaptation to beach erosion due to sea level rise. In: Green, A.N. and Cooper, J.A.G. (eds.), Proceedings 13th International Coastal Symposium (Durban, South Africa), Journal of Coastal Research, Special Issue No. 70, pp. 467-472, ISSN 0749-0208. www.JCRonline.org
Beach erosion caused by sea level rise is a serious problem for people over the world. Beaches play important roles in disaster prevention, recreational use, and nurturing unique ecosystems. Beach nourishment is capable of maintaining the position of the shoreline and the natural environment. However, applying artificial nourishment to the whole beach area is not a practical method due to high costs and the large quantity sand required. There has been no framework for effective adaptation of beach nourishment to solving coastal erosion issues. In this study, we focus on the beach nourishment as an adaptation to beach erosion due to sea level rise and attempt to construct a framework for proper beach nourishment. The framework for the adaptation proposal is as follows: (i) Prediction of shoreline changes and future beach width due to sea level rise; (ii) Determination of beach width to be protected in terms of disaster prevention, ecosystem conservation and recreation respectively; (iii) Specifying vulnerable areas where the area of and width of the beach Step; (iv) Estimation of sand volume and its cost applied only to the vulnerable area. This framework was applied to Japanese beaches where the determine beach width indicated that when a beach width of more than 10 m is needed for prevention against disasters, more than 20 m for ecosystem conservation, and more than 30 m for recreation use. The volume of sand required to maintain the beach width along the whole Japanese beach varies from 61× 106 to 2,300× 106 m3, and by the use of this framework, it is possible to estimate practical nourishment volume and its associated costs for disaster prevention, ecosystem conservation and recreation use. ADDITIONAL INDEX WORDS: sea level rise, beach erosion, adaptation, beach nourishment, framework.
INTRODUCTION Coastal erosion caused by sea level rise and climate change is a serious problem for people over the world. The IPCC 5th Assessment Report (2013) estimated that global sea level for 2081-2100 will likely be in the range of 0.26 to 0.82 m under all RCP scenarios due to thermal expansion and melting glaciers and ice sheets. With the change in wave characteristics due to climate change presenting another concern, such as the growth of wave height due to extream storms. The future shoreline would retreat due to sea level rise and the increase in wave heights during storms, which consequently, would causes harmful impacts on socio-economics in coastal regions as 10% of the world’s population live in low-lying coastal regions within 10 m above the present sea level (McGranahan et al. 2007). Sandy beach play important roles in disaster prevention with existing unique ecosystems and recreational use, they have the ability to dissipate wave energy, preventing waves from overtopping coastal defenses therefore decreasing the force of incoming waves. Coastal areas with no beaches are affected by high energy waves during storm events. Beaches are important for tourism because people visit for various activities and during vacation and therefore the economic value of recreational beaches was estimated using the travel cost ____________________ DOI: 10.2112/SI70-079.1 received 30 November 2013; accepted 21 February 2014. © Coastal Education & Research Foundation 2014
method at 9.2 billion US dollars per year for the whole Japanese beach (Ohno et al., 2009). Unique ecosystems existing on these beaches which encompass as beach vegetations and nesting sea turtles. It is necessary to carefully consider adapting beaches for recreational use so as to maintain ecosystems, and prevent possible disasters. In order to make an adaptation against beach erosion, evaluation of the possible impacts due to sea level rise and climate change and associated beach erosion shoul be carried out. The effects of sea level rise have previously been estimated using Bruun rule (Zhang et al., 2004). In Japan, Yoshida et al. (2013) estimated shoreline change in the five Japanese beaches with the causes of past long-term beach erosion taken into consideration which showed that the main cause of beach erosion is sea level rise. Examples of recent proposed adaptations based on the impact assessments include periodic beach nourishment, associated with breakwaters and dune afforestation, which could protect tourist resorts from erosion and inundation risks (Snoussi et al., 2008). Stabilization and accretion of the beach requires artificial beach nourishments (Marcinkowski et al., 2013). The average cost per beach nourishment project was estimated in the USA at $175,400 by Corporations of Engineers, with the average cost of $12 million for hard structure, which is significantly more expensive than beach nourishment (Sudar et al., 1995). Beach nourishment is the method where sand is sorced from an outside region and used to
Journal of Coastal Research, Special Issue No. 70, 2014
Yoshida et al.
468
replace sediment lost through longshore drift, high wave energies or sea level rise; factors which progressively eroding beach areas. This method has previously been used for preventing the undermining of coastal defenses foundation, such as sea wall and levees, amd exposing or making beach width wider in the coastal resort city where the existing beach conditions are indispensable (e.g. Miami beach from 1976 to 1981). According to the relationship between hurricane damage and prior beach width, it is evident that the damage incurred drastically decreases in wide beach (Dean et al., 1988). In other words, beach nourishment that maintains a wide beach width can mitigat seacoasts hazards. It is ideal to maintain beaches without hard structures considering beach benefits for disaster prevention, environment conservation and recreational use. Applying beach nourishment to the whole beach area is not a practical method because of its high cost and large sand quantities (Cooper et al., 2012). This paper focuses on the beach nourishment as an adaptation however, as no new frameworks for proper beach norishment have been identified. Therefore, this study aims to construct a framework for a proper beach nourishment regarding disaster prevention, presavation of ecosystems and recreation use, as an adaptation to beach erosion due to sea level rise.
STUDY SITE AND PHYSICAL FEATURES Figure 1 shows the location of Japan with twenty-five percent of Japan’s entire coastline (35000 km) consisting of sandy beaches of which 50% are natural beaches without artificial coastal structures (Nature Conservation Bureau of the Environment Agency, 1994). The study sites consist of 77 coastal areas in Japan, categorized in terms of topographical and oceanographic similarities, and longshore sediment transport; continuity according to the Basic Policy for Coastal concervation in Japan. Seawalls and levees were installed from the 1950’s in potential disaster coasts to prevent typhoon and storm surge inland. From the 1950s-1990s coastal structures and developed seaside structures afterWorld War II deacreased longshore drift, causing erosion along the Japanese beaches. However, from 1990 to 2008, the shoreline did not change significantly because the coastal law revised in 1999, to focus on beach conservations under the consideration of "use" and "environment" besides disaster prevention (Yoshida et al., 2013). The anuual mean and maximum tide level tended to increase over the past few decades in Japan according to Sugawa et al. (2011). The Nationwide Ocean Wave Information Network for Port and Harbours (NOWPHAS) of the Ministry of Land, Infrastructure and Transport has been observing waves. The sea of Japan is characteristices by high waves in winter and low waves in summer, with a high frequency of swell throughout the year on the Pacific Ocean side, with a small seasonal change of wave height and the period (Sugimoto et al., 2008).
METHODS
Figure 1. Location of Japan.
Figure 2. Framework for proper beach nourishment.
1. 2. 3. 4.
Framework for proper beach nourishment Considering the important roles of beaches, it is desirable to preserve sandy beaches as much as possible. However, applying beach nourishment to the whole beach area is not a practical method. Therefore, beach nourishment need only be applied to vulnerable areas for disaster prevention, preservation of ecosystems, and recreation, using beach width as a vulnerable evaluation index. Thus a framework for estimating a proper beach nourishment volume based on this concept may be applied, using the following proposal (Figure. 2).
Prediction of shoreline changes and future beach width due to sea level rise. Determination of beach width to be protected for disaster prevention, ecosystem conservation, and for recreation. Specifying vulnerable areas where the area of beach width of Step 2 is narrower than the beach width of Step 1. Estimation of sand volume and its cost to maintain the beach width to be protected in terms of disaster prevention, recreation and beach ecosystems respectively.
The step 1 is to estimate beach width for 2100 by obtaining differences between predicted shoreline change and present beach width. The predicted shoreline change we used in this paper is the results of the estimation using the Bruun rule (Bruun, 1962) as Udo et al., (2013) estimated for 75 beaches over the whole Japan which is divided from geographical features, marine phenomenon and continuity of longshore drift. For the grain size of 0.2 mm,
Journal of Coastal Research, Special Issue No. 70, 2014
Framework for proper beach nourishment as adaptation to beach erosion due to sea level rise
shoreline would retreat between 26 and 56 m under RCP2.6, between 28 and 62 m under RCP4.5, between 26 and 57 m under RCP6.0, and between 37 and 84 m under RCP8.5 by the end of 21st century. For the grain size of 0.6 mm, shoreline would retreat between 11 and 24 m under RCP2.6, between 12 and 27 m under 4.5, between 11 and 25 m under 6.0, and between 16 and 36 m under RCP8.5 by the end of 21st century. The Bruun rule can easily estimate shoreline change in large-scale areas; however, the rule has been criticized due to its limitation and assumptions (Cooper and Pilky, 2004). On the other hand, the model tests have claimed to provide verification of Bruun rule (Zhang et al., 2004). The present dry beach width of 75 beaches was obtained by dividing each beach area by the corresponding shoreline length. The beach area and length were extracted from 1/25000 scale maps from 1990 by Kishida and Shimizu (2000). The step 2 is to determine the beach width in order to protect the beach from disaster, preserve ecosystems, and recreation. We determine that the beach width of 10 m is required for disaster prevention, 20 m for ecosystem conservation, and 30 m for recreation. The focus was placed on the wave-dissipating property on the beach, as risk reduction. In Japan, the determination of beach width against wave-overtopping has been evaluated by using wave run-up height. Wave run-up is estimated by using the improved Saville's hypothetical slope concept (Nakamura et al., 1975). Many examples show that the beach width against waveovertopping should be more than 10 m in beaches where a seawall exists (e.g. Sendai Bay Coast and Kujukurihama Beach Coast). For ecosystems, we consider the width in order to protect plant habitats. Analyses of aerial photographs of the Kashimanada Coast and the Kujukurihama Beach Coast showed that at least 20 m beach widths are required for plant to inhabitat along coast fronting the Pacific Ocean (Kato et al., 2001). The necessary width for recreational use requires more than 30 to 50 m beach widths, with foreshore slope of 0.10 to 0.02 at high tide (Japan Travel and Tourism Association, 1987; Ministry of Land, Infrastructure, Transport and Tourism, 1992). The specification of 30 m was required to estimate the minimum sand volume required for recreation. The step 3 specifies vulnerable areas where the future beach width of Step 1 is narrower than the beach width of Step 2 that is 10 m against wave-overtopping, 20 m for preserving ecosystem and 30 m for recreational use. Beach nourishment applies only to the vulnerable beaches of step 3. The step 4 is to estimate beach nourishment volume and its cost for maintaining beach width to be protected in step 2.
Beach nourishment model with sea level rise The current beach profile is assumed to be in equilibrium (Dean, 1977). The profile can be described by the equation (1):
h Ay 2 3
(1)
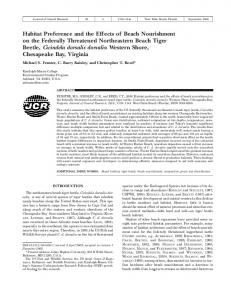
where h is the water depth, y is the distance offshore and A is the scaling parameter based on sediment characteristics. Dean (1977) found that the scaling parameter, A, depends on grain size alone. Beachs maintain equilibrium profile when sea level does not rise. On the other hand, the beach profile spreads towards offshore and shoreline tends to retreat landward without additional sand input to the beach under rising sea level (Figure 3a). In order to maintain the beach equilibrium profile facing future sea level rise, the entire beach profile would have to increase vertically with the same amount of sea level rise (Astrid, 2010; Cooper et al., 2013). Based on this, the necessary additional sand volumes are calculated by the following equation (2):
469
(a) Shoreline retreat without beach nourishment
(b) Increase of the profile Sn
(c) Shoreline retreat after beach norishment
Figure 3. The concept of beach nourishment for keeping beach width to be protected. (b) The profile increases the amount of Sn by adding sand. (c) The shoreline would retreat due to sea level rise after beach nourishment. The blue point on the figure (c) is shoreline position after beach nourishment. This nourishment prevents future beach width from being narrower than Y* while allowing shoreline to be retreated when the future beach width will be wider than the beach width of step 2 after rising sea level. W*
W*
0
0
V p S nY0 (Ay 2 3 S n )dy Ay 2 3 dy
(2)
where Vp is the profile change volume (m3m-1), Y0 is the dry beach width, Sn is the height of beach nourishment, i.e. the amount of vertical increase of equilibrium profile, to maintain the beach width to be protected, Y*, and W* is the cross-shore distance to closure the depth h*. The amount of vertical increase of equilibrium profile Sn is given by the following equation (3) obtained from the Bruun equation:
Journal of Coastal Research, Special Issue No. 70, 2013
Yoshida et al.
470
(a) For 10 m beach width
RCP2.6
RCP4.5
RCP6.0
RCP8.5
RCP4.5
RCP6.0
RCP8.5
(b) For 20 m beach width RCP2.6
(c) For 30 m beach width
RCP2.6
Profile volume (m3 m-1)
RCP4.5
RCP6.0
RCP8.5
Figure 4. The profile volume (grain size of 0.2 mm) required for (a) beach width of 10 m for disaster prevention, (b) 20 m for ecosystem conservations, and (c) 30 m for recreational use under RCP2.6, RCP4.5, RCP6.0, and RCP8.5.
h Bh Y0 Y* S n S W*
(3)
S is the sea level rise, h* is the closure depth and Bh is the berm height. The amount of sea level rise after beach nourishment causes a permissible retreat (Y0 -Y*) after the profile increases the amount of Sn (Figure 3b). Vp is the additional profile volume for preventing future beach width from being narrower than Y*, while this nourishment allows shoreline to be retreated when the future beach width becomes wider than the beach width of step 2 after sea level rises. The additional sand volume is estimated from multiplying profile change volume of equation (2) by beach length.
The closure depth, h* is given by the following equation (Hallemeier, 1981):
H 3 h 2.28H m 68.5 m 3 gTm
(4)
where Hm is the maximum significant mean wave height, Tm is the maximum significant mean wave period, g is gravity acceleration. The cross-shore distance, L*, was used for the distance offshore, y, calculated by substituting the scaling parameter, A, and the closure depth, h*, into Eq. (1). The berm height, Bh, is given by the equation mentioned by Takeda and Sunamura (1983):
Bh 0.125H b5 8 gTs
Journal of Coastal Research, Special Issue No. 70, 2014
2 38
(5)
Framework for proper beach nourishment as adaptation to beach erosion due to sea level rise
where Hb is the breaker wave height, Hs is the mean significant wave height, Ts is the mean significant wave period. Hb is given by the following equation (Sunamura, 1983):
Hb 0.2 H tan s Hs Ls
0.25
(6)
where tanα is the beach gradient, and Ls is mean significant wave length. The shoreline change was thus estimated by using the data of sea-level rise, grain size, beach gradient and wave conditions. The data used in this framework was sea level rise, waves, grain size and foreshore slope. The sea level rise used in this study was of sea level rise data of Udo et al. (2013) added with the contribution from ice sheet melt under RCP2.6, RCP4.5, RCP6.0, and RCP8.5 scenarios. The sea level rise ranges between 0.41 and 0.49 m under RCP2.6, between 0.46 and 0.51 m under RCP4.5, between 0.45 and 0.47 m under RCP6.0, and between 0.59 and 0.69 m under RCP8.5 by the end of 21st century. We obtained annual mean and maximum significant wave heights from NOWPHAS. Average annual mean and maximum significant wave heights and periods were assigned as the wave conditions required by estimating beach nourishment volumes. We uniformly used the grain sizes of 0.2 and 0.6 mm throughout Japanese beaches because it is difficult to examine each size over the whole beach in Japan. About 80 % of sand particle size of 35 prefectures in Japan was found to be between 0.125 and 1.0 mm according to 120 literatures surveyed (Udo et al., 2013). The sediment scale parameter, A, we used for equilibrium equation is 0.10 for 0.2 mm and 0.17 for 0.6 mm in grain sizes. The slope we used in this paper is 0.014 for 0.2 mm and 0.11 for 0.6 mm in grain sizes. The input data we use in this study such as grain sizes, beach slope and beach width are uniformly applied to the whole Japanese beaches because it is difficult to obtain detailed data of large scale areas.
RESULTS We applied the constructed framework to the 77 beaches in Japan to estimate necessary nourishment volume and its cost until
471
2100. Figure 4 shows the profile volumes (only 0.2 mm of grain size because of the limited pages) required for keeping the 10 m of the beach width against wave-overtopping, 20 m for inhabiting plants, and 30 m for recreational use under RCP2.6, RCP4.5, RCP6.0, and RCP8.5. For the grain size of 0.2 mm, the profile volume estimates between 120 and 1600 m3/m for maintaining the present position of the shoreline, 11 and 197 m3/m against waveovertopping, 13 and 394 m3/m for inhabiting plants, and 1 and 591 m3/m for recreation. For the grain size of 0.6 mm, the profile volume estimates between 51 and 680 m3/m for keeping present shoreline position, 2 and 194 m3/m against wave- overtopping, 2 and 390 m3/m for inhabiting plants, and 1 and 580 m3/m for recreation. Table 1 shows the total nourishment volume for keeping shoreline position and considering beach width. For the grain size of 0.2 mm, the additional volume to keep the present shoreline position ranges from 3,700 × 106 to 5,200 × 106 m3. As for protection against wave-overtopping, the additional volume ranges from 600 × 106 to 720 × 106 m3. As for inhabiting plants, the additional volume ranges from 1300 × 106 to 1,500 × 106 m3. As for recreational use, the additional volume ranges from 2,000 × 106 to 2,300 × 106 m3. For the grain size of 0.6 mm, the additional volume to keep the present shoreline position ranges from 1,700 × 106 to 2,300 × 106 m3. As against wave-overtopping, the additional volume ranges from 61 to 240 × 106 m3. As for inhabiting plants, the additional volume ranges from 350 × 106 to 720, × 106 m3. As for recreational use, the additional sand volume ranges from 870 × 106 to 1400 × 106 m3. The necessary sand volume depends on the grain size. All beaches require additional volumes according to the increase of the beach width determined in the step 2. For the grain size of 0.6 mm, beach nourishment for keeping the 10 m beach width would not be needed under RCP2.6 and RCP6.0 because the future beach width would be maintained at least 10 m over entire Japanese beaches under these scenarios. Table 2 shows the maximum and minimum cost of beach nourishment. Beach nourishment cost in Japan mostly ranges from $20/m3 to $60/m3 (Nishi et al, 2005).
Table 1. Sand volume (106 m3) to keep present shoreline position: beach width of 10 m for disaster prevention, 20 m for ecosystem conservation, and 30 m for recreational use. Grain size 0.2 mm 0.6 mm Scenario RCP2.6 RCP4.5 RCP6.0 RCP8.5 RCP2.6 RCP4.5 RCP6.0 RCP8.5 Keeping 3,700 4,100 3,800 5,200 1,700 1,900 1,700 2,300 shoreline 10m for 600 640 630 720 66 93 61 240 protection 20 m for 1,300 1300 1,300 1,500 350 420 370 720 ecosystem 30 m for 2,000 2,100 2,100 2,300 870 980 910 1,400 recreation Table 2. Maximum and minimum cost of beach nourishment (million dollar, 1dollar = 100 Japanese yen). Maximum is estimated from nourishment cost of $60/m3 with 0.2 mm in grain size, and minimum from $20/m3 with 0.6 mm in grain size. Case Maximum cost Minimum cost Scenario RCP2.6 RCP4.5 RCP6.0 RCP8.5 RCP2.6 RCP4.5 RCP6.0 RCP8.5 Keeping 220,000 250,000 230,000 310,000 34,000 38,000 34,000 46,000 shoreline 10m for 36,000 38,000 38,000 43,000 1,300 1.900 1,200 4,800 protection 20 m for 78,000 78,000 78,000 90,000 7,000 8,400 7,400 14,000 ecosystem 30 m for 120,000 130,000 130,000 140,000 17,000 20,000 18,000 28,000 recreation
Journal of Coastal Research, Special Issue No. 70, 2013
Yoshida et al.
472
We use $20/m3 as a cost for the case of 0.6 mm grain size to estimate minimum expenditure, and $60/m3 for the case of 0.2 mm grain size to estimate maximum expenditure for the next century. Minimum expenditure would be $1.2 billion for beach nourishment assuming that the beach width has to be maintained at 10 m for the RCP6.0 scenario, $140 billon would be required for beach nourishment assuming that the beach width be maintained as wide as 30 m for the worst (RCP8.5) scenario. From these results, the necessary sand volume and its cost would be smaller, than the volume and its cost required for maintaining the present shoreline position against sea level rise by the end of 21st century.
CONCLUSION In this study, we constructed the framework for proper beach nourishment for disaster prevention, ecosystem conservation and recreation, estimating the volume of sediment required for beach nourishment in Japan associated with maximum and minimum costs. We uniformly applied the beach width to be protected for disaster prevention, ecosystem, and recreation, throughout Japanese beaches, by using data obtained from Japanese local governments. This framework only takes into consideration the impact of sea level rise on the coast without considering existing erosion. Determining beach width required for disaster prevention must therefore be integrated with evaluation of risks associated to other forms of coastal erosion in order to improve this framework. An appropriate beach width and more reliable input data according to beach characteristics are needed when applying this framework to smaller areas. However, it would be useful to deal with an adaptation in large scale areas such as the whole Japanese coastal because this framework can estimate overviews of beach nourishment against sea level rise. If a necessary beach width of each region can be obtained, it is possible to estimate realistic and practical nourishment volumes required for disaster prevention, ecosystem conservations and recreation by using this framework.
ACKNOWLEDGEMENT This study was supported in part by the Environment Research and Technology Development Fund (S-8) of the Ministry of the Environment, Japan. We express our deepest gratitude to Professor So Kazama of Tohoku University for valuable suggestions regarding how to treat the estimation data of climate change. We are also grateful to an anonymous reviewer for encouraging and constructive comments.
LITERATURE CITED Astrid, F., 2010. Influence of climate change on beach nourishment and the seawall design at the Gold Coast, Australia, Bergische University, Diploma thesis. No. 42551. Bruun, P., 1962. Sea-level rise as a cause of shore erosion, Journal. Waterways and Harbors Division. ASCE, 88, 117-130. Chiba prefecture. 2003. Master plan for storm surge protection projects at the Kujukuri Beach coast, Japan. (in Japanese) Cooper, J.A.G. and Pilkey, O.H., 2004. Sea-level rise and shoreline retreat: time to abandon the Bruun Rule, Global and Planetary Change, 43, 157-171. Cooper, J.A.G. and Lemckert, C., 2012. Extreme sea-level rise and adaptation options for coastal resort cities: A qualitative assessment from the Gold Coast, Australia, Ocean & Coastal Management, 64, 114. Dean, R.G., 1977. Equilibrium beach profiles: U.S. Atlantic and Gulf coasts. Ocean Engineering Technical Report 12, Depertment of Civil Engineers., University of Delaware: Newark, DE; 45 pp.
Dean, R.G., 1988. Realistic economic benefits from beach nourishment, Proceedings of 21st Coastal Engineering Conference, pp.1558-1572. Hallermeier, R. J., 1981. A profile zonation for seasonal sand beaches? from wave climate, Coastal Engineering, 4, 253-277 Intergovernmental Panel on Climate Change (IPCC). 2013. Climate Change 2013. The Physical Science Basis. Working Group I Contribution to the IPCC 5th Assessment Report - Changes to the Underlying Scientific/Technical Assessment (IPCC-XXVI/Doc.4). JapanTravel and Tourism Association. 1987. Guide of marine tourist resort plan pp.33 Kishida, H., and Shimizu, M., 2000. Extraction of coastal erosion and deposition through coastal information survey, Proceeding of Coastal Engineering, JSCE, 47, 681-685. (in Japanese) Marcinkowski, T. and M. Szmytkiewicz., 2013. Performance of submerged breakwaters as improvement of beach fill effectiveness in Gdynia, Poland. Journal of Coastal Research, Special Issue No. 65, pp.326-331. McGranahan, DA., Balk, D., and Anderson, B., 2007. The rising tide: assessing the risk of climate change and human settlements in low elevation coastal zones. Environ. Urban. 19:17-39 Ministry of Land, Infrastructure and Transport Tohoku Regional Bureau. 2009. The report of project appraisal committee at the south Sendai Bay coast, Japan. (in Japanese). Ministry of Land, Infrastructure, Transport and Tourism, 1992. Manual of beach planning and design, pp.118. (in Japanese). Nature Conservation Bureau of the Environment Agency, 1994. The 4th National Survey on the Natural Environment, pp.48. (in Japanese) Nishi, R., Robert G. Dean., Tanaka, R., 2005. Beach nourishment projects in Japan in terms of its size and cost. Proceedings of civil engineering in the ocean No. 21, pp. 355-360. (in Japanese) Ohno, E., Hayashiyama, Y., Morisugi, H. and Nohara, K., 2009. Global warming damage cost of sandy beach loss: travel cost method approach. Proceedings of the Symposium on Global Environment, Volume 14, 291-297. (in Japanese) Port and Airport Research Institute, Marine Information Group, Marine Information Division Marine Environment and Engineering Department. Nationwide Ocean Wave Information Network for Ports and Harbours (NOWPHAS), Wave Data. Sudar, R. A., J. Pope., T. Hillyer, and J. Crumm., 1995. Shore protection projects of the U.S. Army Corps of Engineers, Journal of Shore and Beach, pp. 3-16. Sugawa, T., Udo, K., Mimura, N., and Mano, A., 2011. Projection of Shoreline Retreat due to Sea Level Rise along Japanese Coasts. Journal of Japan Society of Civil Engineers, Ser. B2 (Coastal Engineering), 67, 1196-1200. (in Japanese) Sugimoto, S., Chikasawa, M., 2008. A Study on Japanese Coastal Wave Characteristics Using Coastal Wave Observation by Japan Meteorological Agency. Weather service bulletin No. 75, pp. 77-95. Sunamura, T., 1983. Determination of Breaker Height and Depth in the Field, Annual Report No.8, Institute of Geoscience, University of Tsukuba, Japan, 53-54. Snoussi, M., Ouchani, T., and Niazi, S., 2008. Vulnerability assessment of the impact of sea-level rise and flooding on the Moroccan coast: The case of the Mediterranean eastern zone. Estuarine, Coastal and Shelf Science, 77, 206-213. Takeda, I., and Sunamura, T., 1983. Topographic evolution of sandy beaches in the accretion process, Proceedings of Coastal Engineering, JSCE, 30, 254-258 (in Japanese). Udo, K., Takeda, Y.,Yoshida, J. and Mano, A., 2013. Future projection of beach erosion in Japan using sea level change data of MIROC5 model. Journal of Japan Society of Civil Engineers, Ser. G (Environmental Research), 69, 239-247. (in Japanese) Yoshida, J., Udo, K., Takeda, Y., and Mano, A., 2013.Potential impact of climate change at five Japanese beaches. Journal of Coastal Research, Special. Issue.No. 65, pp. 2185-2190. Zhang K., Douglas B.C., and. Leatherman S.P., 2004. Global Warming and Coastal Erosion. Climatic Change. 64, 41-58.
Journal of Coastal Research, Special Issue No. 70, 2014