As a result, it is of great importance to study the effective fault diagnosis ..... 11, 2014. [20] I. J. Good, âThe interaction algorithm and practical fourier analysis,â.
(IJACSA) International Journal of Advanced Computer Science and Applications, Vol. 9, No. 1, 2018
Bearing Fault Classification based on the Adaptive Orthogonal Transform Method Mohamed Azergui, Abdenbi Abenaou and Hassane Bouzahir Laboratory of Systems Engineering and Information Technology (LISTI) National School of Applied Science, Ibn Zohr University, PO Box 1136, 80000 Agadir, Morocco Abstract—In this work, we propose an approach based on building an adaptive base which permits to make accurate decisions for diagnosis. The orthogonal adaptive transformation consists of calculating the adaptive operator and the standard spectrum for every state, using two sets of vibration signal records for each type of fault. To classify a new signal, we calculate the spectral vector of this signal in each base. Then, the similarity between this vector and other standard spectra is computed. The experimental results show that the proposed method is very useful for improving the fault detection. Keywords—Condition monitoring; vibration analysis; adaptive orthogonal transformation; bearing fault
I.
I NTRODUCTION
informative characteristics of bearing vibration signal. This method was used for voice signals [18] and was recently employed for classification of breast masses in mammography [19]. The use of these transformations is favored by the ability to adapt the shape of their basic functions according to the character of the standard vector. The latter is formed from the vibration signals of each fault type. In other words, each class of defects is associated with a system of basic functions adaptive for the projection of the signals. The formed basic function system is expressed as a factorization orthogonal matrix operator, which allows making a transformation with a fast calculation algorithm.
The rolling bearing is one of the most widely used elements in rotating machinery. As a critical component, it carries most of the load during the running of rotating machinery. If the rolling bearing fails, serious problems arise, which will, in turn, result in the decrease of production efficiency and large economic loss. Records show that faulty bearings contribute to about thirty percent of the failures in rotating machinery [1]. As a result, it is of great importance to study the effective fault diagnosis approaches for rolling bearings.
This paper is organized as follows. The principles of adaptive orthogonal transforms are introduced in Section II. The proposed method is validated using the data collected from bearing run-to-failure tests in Section III. Finally, the main conclusions are outlined in Section IV.
Various monitoring have been developed for bearing fault diagnosis and condition monitoring, such as vibration analysis, temperature and acoustic emission monitoring [2]. Vibration signal analysis is one of the most efficient techniques thanks to the useful information to severity and type of bearing damage [3], [4]. Various signal processing techniques have been proposed for mechanical fault diagnosis are time domain [5], frequency domain [6]–[8], time-frequency domain analysis [9], high frequency resonance technique (HFRT) [10], [11], wavelet transform methods [12], [13] and automatic diagnosis techniques [14]. In summary, such methods can be primarily categorized into two classes: frequency identification and features classification.
In digital treatment, transformed shelf space orthogonal of a signal X can be represented by the matrix (1).
The basic idea of these methods is the decomposition of the vibration signal in a system of function of orthogonal base as those of Fourier, Walsh or Haar, [15]–[17] to obtain the vector (spectre) of the informative characteristics. However, the spectrum obtained by these frequency methods in the majority of cases will complicate the procedure of comparing the signals of various types of faults, since the vibration signal is a nonstationary process. Hence the need for a method of computing the vector of the informative characteristics with a minimum dimension. In this paper, for the first time, we propose to use the adaptive orthogonal transformations for the extraction of the
II.
T HEORETICAL BACKGROUND
Y =
1 HX N
(1)
Where, T
•
X = [x1 , x2 , ........., xN ] is the initial signal is to be transformed (of size N = 2n ).
•
Y = [y1 , y2 , ........., yN ] is the vector of the spectral coefficients calculated by the operator orthogonal H of dimension N × N.
T
To avoid the problem of signals synchronizations, we mention that X is transformed to the Frequency domain. Factorization of Good [20] showed a possibility of representing the matrix operator H as product Gi (2) sparse matrix with a higher proportion of zero which has allowed the construction of the quick transformation algorithms of Fourier, Haar, and Walsh. The matrices Gi (i = 1, ..., n) are constructed by blocks of matrices Vi,j of minimum dimension that is called spectral nuclei:
www.ijacsa.thesai.org
375 | P a g e
(IJACSA) International Journal of Advanced Computer Science and Applications, Vol. 9, No. 1, 2018
�
αi1 βi1 0 0
Gi =
0 � 0 αi2 βi2
0 0
···
αij βij
... ...
0 0
··· 0 0 .. . 0 0
γi1 δi1 0 0
···
�
0 0 �
γi2 δi2
··· ··· ..
αN
βN
i
i
/2
/2
0 0
···
.
0 0
0 0 0 0
γN i /2 δN i /2
(2)
With � vi,j =
γij δij
�
� =
cos (αij ) ... wi,j sin (αij ) sin (αij ) ... −wi,j cos (αij )
� ,
wi,j = exp (jθi,j ) , ϕ ∈ [0, 2π] , θ ∈ [0, 2π] Hence ((1)) can be written as follows:
Y =
n 1 1 Y 1 HX = G1 G2 . . . Gn X = Gi X N N N i=1
(3)
By defining the angular parameters, ϕi,j and θi,j , the operators of orthogonal transformations H can be formed with basic functions complex, or with real functions when θi,j = 0. The calculation of the parameters depends ϕi,j on the choice of the structures of the spectral nuclei Vi,j . What allows generating a system of basic functions adapted to a given class of signals. Yet, to assure a fast calculation, in this work, the spectral nuclei in matrices Gi are established so that they contain a higher proportion of zeros, such as he is explained below. Adapting operator H in (1) is provided by the condition: 1 Ha Zcd = Yc = [yc,1 , 0, 0, . . . 0]T , yc,1 6= 0 N
(4)
Where, •
Yc is the target vector which builds the criterion of adaptation of the operator Ha .
Fig. 1. The procedure of synthesis of the operator of the adaptive transformed.
•
Zcd represents the vector standard of a class calculated by means of the statistical characteristics of several vibratory signals.
•
Ha is adaptable to synthesize operator.
one serves to calculate the standard Zcd of i (class i) and allows to generate the synthesis of the operator. Whereas the second set used to form the spectral standard Ysd,i of i, which is obtained by the projection of the recordings of the second set in the adaptable base Ha .
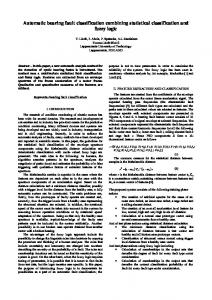
The synthesis of the adaptable operator Ha based standard Zcd (for a given class), consists in calculating the angular parameters ϕi,j matrices Gi according to the condition (4). The procedure of the calculation of the parameters is illustrated by Fig. 1 the principle of which is based on an iterative algorithm introduced by Fig. 2, which allows the calculation of the target vector Yc is according to the equation:
To make the decision and classify vibration signal, we calculate each Yi spectrum in each base Ha,i . To define the fault corresponding to the vector Yi of the informative characteristics, we lean on a rule of decision formed by a combination of two criteria: •
The Euclidean distance δi = kYi − Ysd,i k and
• (5)
The distance of the energy concentrated in their first 2 2 coefficients of the decomposition εi = Y1,i − Y1,sd,i .
The calculation of the vector Yc allows the obtaining of the adapted operator H. For the classification of the vibration signals, we dispose two sets of the vibration signals. The first
So, the vector Yi will correspond to class i if δi = min (δk=1...M ) and εi = min (εk=1...M ), with M is the number of classes. This procedure of classification is illustrated
Yi = Gi Yi−1
www.ijacsa.thesai.org
376 | P a g e
(IJACSA) International Journal of Advanced Computer Science and Applications, Vol. 9, No. 1, 2018
Fig. 3.
Classification procedure.
Fig. 4.
Bearing test rig.
Fig. 2. The algorithm of synthesis of the operator of the adaptive transformed.
in the Fig. 3. III.
A PPLICATION TO E XPERIMENTAL S IGNAL
A. Experimental setup The bearing test rig hosts four bearings were installed on a shaft. The rotation speed was kept constant at a rate of 2000 RPM by an alternative current motor coupled to the shaft via rub belts. A uniform radial load of 6000 lbs is applied onto the shaft and bearing. All bearings are lubricated. Rexnord ZA-2115 double row bearings were installed on the shaft as shown in Fig. 4. A PCB 353B33 High Sensitivity Quartz ICP accelerometers were installed on the bearing housing. The test rig and sensors placement are also shown in Fig. 4. All failures occurred after exceeding designed lifetime of the bearing which is more than 100 million revolutions. Vibration data were collected every 10 minutes by NI DAQCard6062E at the sample rate set at 20 KHz.
The amount the test bearing
test was carried out for 35 days until a significant of metal debris was found on the magnetic plug of bearing. An inner race defect was discovered in test 1.
B. Experimental Results Analysis The proposed method was applied to detect the bearing with outer race fault. The raw vibration signal of normal operating conditions and outer race failure occurred in bearing 1 are plotted in
www.ijacsa.thesai.org
377 | P a g e
(IJACSA) International Journal of Advanced Computer Science and Applications, Vol. 9, No. 1, 2018
0 ,7 0 ,0 3
0 ,6
A m p litu d e (g )
A m p litu d e (g )
0 ,5
0 ,0 0
0 ,4 0 ,3 0 ,2 0 ,1
-0 ,0 3
0 ,0
0 ,2
0 ,4
T im e (s )
0 ,6
0 ,8
0 ,0
1 ,0
0
1 0 0 0
2 0 0 0
3 0 0 0
4 0 0 0
5 0 0 0
6 0 0 0
7 0 0 0
8 0 0 0
9 0 0 0
1 0 0 0 0
6 0 0 0
7 0 0 0
8 0 0 0
9 0 0 0
1 0 0 0 0
F re q u e n c y (H z )
(a)
(a)
0 ,7 0 ,0 3
0 ,6
A m p litu d e (g )
A m p litu d e (g )
0 ,5
0 ,0 0
0 ,4 0 ,3 0 ,2 0 ,1
-0 ,0 3
0 ,0 0 ,0
0 ,2
0 ,4
T im e (s )
0 ,6
0 ,8
1 ,0
0
1 0 0 0
2 0 0 0
3 0 0 0
4 0 0 0
5 0 0 0
F re q u e n c y (H z )
(b)
(b)
Fig. 5. Vibration signal of: (a) normal operating conditions, (b) outer race failure occurred in bearing 1.
Fig. 6. FFT of: (a) normal operating conditions, (b) outer race failure occurred in bearing 1.
Fig. 5a and 5b, respectively.
classification of the signals is much higher and can reach a 100 % value as the interval of analysis increases.
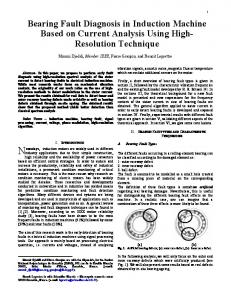
Fig. 6a and 6b present the frequency spectrum of normal state and outer race. The characteristic defect frequencies cannot be obtained directly in FFT spectrum. By using the elaborate method, the projection of normal signal in the normal class base and fault class base are plotted in Fig. 7a and 7b, respectively. We can notice that the energy of the projection of the normal signal in the adaptive base has a small spectral vector (Fig. 7a). Fig. 8a and 8b illustrate the projection of fault signal in the normal class base and fault class base. It can be seen that during the projection of this signal at a normal base, we obtain rather a broad spectral vector (Fig. 8a). This result demonstrate that the first signal belongs to the class of the normal signal and the second signal belongs to the class of abnormal signal, respectively. The same conclusion also manifested by values of δ and ε. The results obtained by the developed method, illustrated in Fig. 7 and 8 indicate its effectiveness and show that it ensures a high distinction that will help to make the classification of bearing vibration signal. The efficiency of the elaborate method is illustrated on Fig. 9 which reflects the certainty of classification according to the size of the interval of the analysis. The certainty of the
IV.
C ONCLUSION
To improve the accuracy fault classification of bearings in rotating machines, a new method is developed based to calculate the informative characteristics of the vibration signal. The experimental results show that the method ensures a high distinction that will help to make the classification of bearing vibration signal. The developed software system according to this method will be beneficial for practical fault classification. R EFERENCES [1]
[2]
[3]
[4]
[5]
N. Tandon and A. Parey, “Condition monitoring of rotary machines,” in Condition Monitoring and Control for Intelligent Manufacturing. Springer, 2006, pp. 109–136. W. Zhou, T. G. Habetler, and R. G. Harley, “Bearing condition monitoring methods for electric machines: A general review,” in Diagnostics for Electric Machines, Power Electronics and Drives, 2007. SDEMPED 2007. IEEE International Symposium on. IEEE, 2007, pp. 3–6. N. Tandon and B. Nakra, “Comparison of vibration and acoustic measurement techniques for the condition monitoring of rolling element bearings,” Tribology International, vol. 25, no. 3, pp. 205–212, 1992. N. Tandon and A. Choudhury, “A review of vibration and acoustic measurement methods for the detection of defects in rolling element bearings,” Tribology international, vol. 32, no. 8, pp. 469–480, 1999. H. A. Khwaja, S. Gupta, and V. Kumar, “A statistical approach for fault diagnosis in electrical machines,” IETE Journal of Research, vol. 56, no. 3, pp. 146–155, 2010.
www.ijacsa.thesai.org
378 | P a g e
(IJACSA) International Journal of Advanced Computer Science and Applications, Vol. 9, No. 1, 2018
0 ,8
0 ,6
0 ,6 0 ,4 0 ,4
0 ,2 0 ,2
0 ,0
0 ,0
0
2 0 0 0
4 0 0 0
6 0 0 0
8 0 0 0
1 0 0 0 0
0
2 0 0 0
4 0 0 0
(a)
6 0 0 0
8 0 0 0
1 0 0 0 0
(a)
0 ,8
0 ,6 0 ,6 0 ,4 0 ,4
0 ,2 0 ,2
0 ,0
0 ,0
0
2 0 0 0
4 0 0 0
6 0 0 0
8 0 0 0
1 0 0 0 0
0
(b)
2 0 0 0
4 0 0 0
6 0 0 0
8 0 0 0
1 0 0 0 0
(b)
Fig. 7. Projection of normal signal in the: (a) normal class base, Fig. 8. Projection of fault signal in the: (a) normal class base, (b) fault class base. (b) fault class base.
[10]
P. McFadden and J. Smith, “Vibration monitoring of rolling element bearings by the high-frequency resonance techniquea review,” Tribology international, vol. 17, no. 1, pp. 3–10, 1984.
[11]
T.-C. Liu and T.-Y. Wu, “Application of empirical mode decomposition and envelop analysis to fault diagnosis in roller bearing with single/double defect,” Smart Science, vol. 5, no. 3, pp. 150–159, 2017.
[12]
N. Nikolaou and I. Antoniadis, “Rolling element bearing fault diagnosis using wavelet packets,” Ndt & E International, vol. 35, no. 3, pp. 197– 205, 2002.
[13]
Y. Jiang, B. Tang, Y. Qin, and W. Liu, “Feature extraction method of wind turbine based on adaptive morlet wavelet and svd,” Renewable energy, vol. 36, no. 8, pp. 2146–2153, 2011.
[14]
P. Jayaswal and A. Wadhwani, “Application of artificial neural networks, fuzzy logic and wavelet transform in fault diagnosis via vibration signal analysis: A review,” Australian Journal of Mechanical Engineering, vol. 7, no. 2, pp. 157–171, 2009.
[15]
K. Rao and N. Ahmed, “Orthogonal transforms for digital signal processing,” in Acoustics, Speech, and Signal Processing, IEEE International Conference on ICASSP’76., vol. 1. IEEE, 1976, pp. 136–140.
[16]
H. Kekre, T. K. Sarode, P. Natu, and S. Natu, “Transform based face recognition with partial and full feature vector using dct and walsh transform,” in Proceedings of the International Conference & Workshop on Emerging Trends in Technology. ACM, 2011, pp. 1295–1300.
[17]
N. Ahmed and K. R. Rao, Orthogonal transforms for digital signal processing. Springer Science & Business Media, 2012.
[18]
A. Abdenbi, A. A. Fadoua, and N. Benayad, “Vers un syst`eme de reconnaissance automatique de la parole en amazighe bas´e sur les transformations orthogonales param´etrables.”
[19]
K. El Fahssi, A. Elmoufidi, A. Abenaou, S. Jai-Andaloussi, and A. Sekkaki, “Feature extraction of the lesion in mammogram images using segmentation by minimizing the energy and orthogonal transformation adaptive,” WSEAS TRANSACTIONS on BIOLOGY and BIOMEDICINE, vol. 11, 2014.
[20]
I. J. Good, “The interaction algorithm and practical fourier analysis,”
Fig. 9. Classification percentage according to the size of the interval of the analysis.
[6]
E. Jantunen, “A summary of methods applied to tool condition monitoring in drilling,” International Journal of Machine Tools and Manufacture, vol. 42, no. 9, pp. 997–1010, 2002.
[7]
F. P. G. M´arquez, A. M. Tobias, J. M. P. P´erez, and M. Papaelias, “Condition monitoring of wind turbines: Techniques and methods,” Renewable Energy, vol. 46, pp. 169–178, 2012.
[8]
[9]
S. Gowid, R. Dixon, and S. Ghani, “A novel robust automated fft-based segmentation and features selection algorithm for acoustic emission condition based monitoring systems,” Applied Acoustics, vol. 88, pp. 66–74, 2015. J.-H. Lee, J. Kim, and H.-J. Kim, “Development of enhanced wigner– ville distribution function,” Mechanical systems and signal processing, vol. 15, no. 2, pp. 367–398, 2001.
www.ijacsa.thesai.org
379 | P a g e
(IJACSA) International Journal of Advanced Computer Science and Applications, Vol. 9, No. 1, 2018
Journal of the Royal Statistical Society. Series B (Methodological), pp.
361–372, 1958.
www.ijacsa.thesai.org
380 | P a g e