ISSN: 0001-5113 AADRAY
ACTA ADRIAT., 53(1): 105 - 122, 2012
UDC: 597.555.5:591.134 (262)
Behavior of some growth performance indexes for exploited Mediterranean hake Sergio RAGONESE1*, Sergio VITALE1, Salvatore Mazzola1, Elena PAGLIARINO2 and Marco L. BIANCHINI2 Institute for the Coastal Marine Environment, IAMC‑CNR, Mazara del Vallo TP, Italy
1
Institute for Agro‑environmental Biology and Forestry, IBAF‑CNR, Monterotondo Scalo RM, Italy
2
*Corresponding author, e‑mail:
[email protected] In this paper, some life‑history estimates concerning the females of the Mediterranean hake Merluccius merluccius (L., 1758), i.e. the parameters of the von Bertalanffy growth function (L∞, K, and t0), the maximum‑ever lengths (Lmx‑e), and the lengths at full maturity (Lmst) were gathered from the pertinent literature and used to derive 5 growth performance indexes (K, φ’, RL=Lmst/ L∞, t50% and ω). The original datasets (n= 70) and the corresponding growth performance indexes were organized and analyzed by various geographical units (GFCM’s geographical sub‑area, GSA; GFCM’s statistical division, GD; and biological province, BP). The parameter distribution resulted to be normal only for the growth performance indexes K and RL; a significant relationship correlation was detected between K and t50%, between φ’ and ω, and between K and ω. The examination of the available historical data showed a scattered and unbalanced geographical distribution by GSA (e.g. 13 of 20 GSAs had less than 5 datasets each), a variability which was higher intra‑GSA than inter‑GSAs (as evidenced by the box‑plots) and no clear geographical trend. GD and BP presented similar patterns, with significant geographical effects only in the RL. Present results suggest that, even if geographical effects are expected, they are obscured by the uncertainty of the original parameters, especially those related to the von Bertalanffy growth function (vBGF). Consequently, growth performance indexes should be used (and interpreted) with caution. Key words: Merluccius merluccius, Mediterranean hake, growth performance index, geographical partition, GSA, Mediterranean Sea
INTRODUCTION Exploited marine living resources are at present assessed in the Mediterranean by refer‑ ring to 26 geographical sub‑areas (GSA: GFCM, 2009), mainly delimited on the basis of politi‑
cal constraints (LLEONART & MAYNOU, 2003). One of the basic implicit assumptions of such a classification is that, inside each GSA, every fish species (or its sub‑groups) has identical ecological properties or at least it is an arbitrary assemblage of populations large enough to be essentially self‑reproducing, with members of
106
ACTA ADRIATICA, 53(1): 105 - 122, 2012
the assemblage showing similar patterns of growth, migration, and dispersal. From a more practical point of view, the fished units (not nec‑ essarily corresponding to a biological or genetic unit) in each GSA are treated as “unit stocks” sensu GULLAND (1969). Whichever the interpretation adopted, com‑ paring present and past life‑history traits (espe‑ cially growth parameters) among GSAs may help in deciding about the correctness of the previously defined basic assumption (i.e. the
so‑called meta‑analysis procedure; HILBORN, 2003), improving the understanding of the under‑
lying phenomena and highlighting the expect‑ ed inter‑ and intra‑stock response to a vari‑ able fishing pattern (ROCHET, 2000; WILLIAMS & SHERTZER, 2005; MARTEINSDOTTIR & PARDOE, 2008). Notwithstanding the relevance of the mat‑
ter, no standard methodology has been proposed within the GFCM to compare growth perform‑ ance when raw data and parameters variances are not available, although the φ’ (phi‑prime;
Table 1. Definition and characterization of the indexes of growth performance applied to the Mediterranean hake females; L∞ (total length; in cm), K (in 1/yr) and t0 (in yr) represent the parameters of the von Bertalanffy growth function (vBGF) Index and main references
Remarks
K
Growth comparison and index of growth performance. It is the most suitable performance indicator among the 6 methods explored by FRANCIS (1996). The
FRANCIS, 1996
higher the better. Usually considered as a growth rate coefficient (COOKE, 1984 in GFCM glossary), but has not yet been used in the Mediterranean hake fisheries context.
φ’= log10K +2*log10L∞
Growth comparison and index of growth performance. It reflects the growth rate of a fish of unit length. The slope value derives from the unweighed mean of
PAULY, 1981;
the empirical log10‑linerar regressions between K‑W∞ and K‑L∞ and isometric
MUNRO & PAULY, 1983;
condition (i.e. W= aL3). Considered more useful than other similar methods
PAULY & MUNRO, 1984
(SPARRE & VENEMA, 1998); not considered in the FRANCIS (1996) review. The higher the better. Likely the most used in the Mediterranean fisheries context.
RL= Lm/L∞= 0.66
Index of growth performance. RL= reproductive load (CUSHING, 1981; a.k.a. the potential growth span, BEVERTON & HOLT, 1957). Usually, the Lm= size at 50%
BEVERTON & HOLT, 1957;
of maturity is employed. In the present case, Lmst= length at full maturity stage
CUSHING, 1981;
(75‑100% of mature specimens). The value 0.66 is theoretically derived; usually
BEVERTON, 1992
the RL varies between 0.45 and 0.78 in Gadiformes (BEVERTON, 1992). The higher the better. Rarely used in the Mediterranean fisheries context.
t50%= t0 +0.6931/K
Growth comparison and index of growth performance. The theoretical age at which the length achieves 50% of L∞. In the original paper, the expression was
modified from ALLEN, 1966
suggested to get an initial guesstimate of K. The lower the better. Never used in the Mediterranean hake fisheries context.
ω= K*L∞
Growth comparison and index of growth performance. Rate of growth at L0 when t0~ 0. It should be applied to stocks or species with almost equal t0 and longevity.
KNIGHT, 1969;
Similar values of ω may correspond to different growth (KINGSLEY et al., 1980);
GALLUCCI & QUINN, 1979
it may be useful for comparing early growth rates (GULLAND, 1983). Almost never used in the Mediterranean fisheries context.
Ragonese et al.: Behavior of some growth performance indexes for exploited Mediterranean hake
Table 1) seems the most used criterion (cfr. SAMED, 2002).
The aim of the present contribution con‑ sists of reviewing and analyzing the suitabil‑ ity of different growth performance indexes for the specificity of the Mediterranean demersal stocks, living in oligotrophic, warmer and saltier water than their Atlantic counterparts, subject to a generalized and persistent pressure by well established “mature” fisheries (PAPACONSTAN‑ TINOU & FARRUGIO, 2000) which have caused a sort of “steady‑state overfishing” (LLEONART & MAYNOU, 2003). As a case study, the females of the Mediterranean hake, Merluccius merluccius, one of the most investigated and representa‑ tive stock in the Mediterranean Sea (OLIVER & MASSUTI, 1995; PAPACOSTANTINOU & STERGIOU, 1995; COLLOCA, 1999; RECASENS & LLEONART, 1999; ORSI RELINI et al., 2002), both for its natural history (e.g.: GARCIA-RODRIGUEZ & ESTEBAN, 2002; BIANCHINI et al., 2008) and for its fishery traits (PAPACOSTANTINOU et al., 1992; ALDEBERT & RECASENS, 1996; BIANCHINI et al., 2003), have
been used in the analysis.
MATERIAL AND METHODS The published and the grey literature (cfr. SAMED, 2002) was extensively searched for sets of von Bertalanffy growth function (vBGF) parameters related to the Mediterranean hake, Merluccius merluccius L., populations. The published growth performance indexes allowing the comparison of growth parameters were browsed and five of them ‑ K, φ’, RL=Lmst/ L∞, t50% and ω (Table 1) ‑ were selected in order to judge their behavior and performance. These 5 growth performance indexes were thereafter applied to the data retrieved for hake females; the growth performance indexes were computed using the estimations of the 3 param‑ eters of the classical vBGF (L∞, total length, in cm; K, in yr‑1; and t0, in yr), the maximum‑ever length (Lmx‑e) and the length at full sexual matu‑ rity (Lmst, to not be confused with length at 50% of maturity). Each recovered dataset of parameters was assigned (Table 2) to its specific GFCM (2009)
107
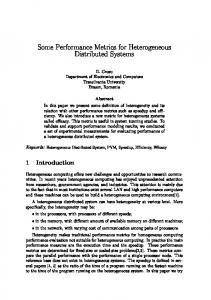
location (geographical sub‑area, GSA; and geo‑ graphical division, GD) and successively to the independent bio‑geographic Mediterrane‑ an provinces (BP, GARIBALDI & CADDY, 1998) (Fig. 1); two contiguous GSAs (15 and 16) were considered together because many estimates were derived before the area splitting (Strait of Sicily).
Fig. 1. The Mediterranean Sea geographical sub areas (GSA) according to the General Fisheries Council for the Mediterranean (GFCM), and the biological prov‑ inces (BP) according to the classification of GARIBAL‑ DI & CADDY (1998). Labels are explained in Table 2
The distributions of each growth perform‑ ance index were tested for normality according to the Shapiro‑Wilk W test and the degree of relationship between each pair of growth per‑ formance indexes was assessed using the coef‑ ficient r2adj. The growth performance indexes were com‑ pared by GSA, GD and BP, qualitatively by producing box‑plot representations (cfr. MOREAU & PAULY, 1999) and quantitatively by implement‑ ing, whenever enough datasets were available, the Kruskal‑Wallis non‑parametric ANOVA. The level of significance was set at p= 0.05, using the expression “marginally significant” or “marginally not significant” in case of 0.04