Aug 4, 2017 - RILEM TC 259-ISR Prognosis of deterioration and loss of serviceability in structures affected by alkali-silica reactions ...
RILEM Technical Committee 259-ISR
Benchmark Problems for AAR FEA Code Validation
University of Colorado, Boulder, USA 2
3
Dr
1
af t
Victor Saouma1 Alain Sellier2 ´phane Multon2 Ste Yann Le Pape3 M-Amin Hariri-Ardebili1
Universit´e de Toulouse, France
Oak Ridge National Laboratory, USA
August 4, 2017
For latest versions.
Contents 1 Introduction
1
1.1
Objectives . . . . . . . . . . . . . . . . . . . . . . . . . . . . . . . . . . . . . . . . . . . . . . .
2
1.2
Important Factors in Reactive Concrete . . . . . . . . . . . . . . . . . . . . . . . . . . . . . .
2
1.3
Problems . . . . . . . . . . . . . . . . . . . . . . . . . . . . . . . . . . . . . . . . . . . . . . .
2
2 Test Problems
5
2.1
P0: Finite Element Model Description . . . . . . . . . . . . . . . . . . . . . . . . . . . . . . .
5
2.2
Materials . . . . . . . . . . . . . . . . . . . . . . . . . . . . . . . . . . . . . . . . . . . . . . .
5
2.2.1
P1: Constitutive Models . . . . . . . . . . . . . . . . . . . . . . . . . . . . . . . . . . .
5
2.2.1.1
Constitutive Model Calibration . . . . . . . . . . . . . . . . . . . . . . . . . .
6
2.2.1.2
Prediction . . . . . . . . . . . . . . . . . . . . . . . . . . . . . . . . . . . . .
6
P2: Drying and Shrinkage . . . . . . . . . . . . . . . . . . . . . . . . . . . . . . . . . .
6
2.2.2.1
Constitutive Model Calibration . . . . . . . . . . . . . . . . . . . . . . . . . .
7
2.2.2.2
Prediction . . . . . . . . . . . . . . . . . . . . . . . . . . . . . . . . . . . . .
8
P3: Basic Creep . . . . . . . . . . . . . . . . . . . . . . . . . . . . . . . . . . . . . . .
8
2.2.3.1
Constitutive Model Calibration . . . . . . . . . . . . . . . . . . . . . . . . . .
9
2.2.3.2
Prediction . . . . . . . . . . . . . . . . . . . . . . . . . . . . . . . . . . . . .
9
2.2.2
2.2.3
2.2.4
2.2.5
9
2.2.4.1
Constitutive Model Calibration . . . . . . . . . . . . . . . . . . . . . . . . . .
10
2.2.4.2
Prediction . . . . . . . . . . . . . . . . . . . . . . . . . . . . . . . . . . . . .
10
P5: Free AAR Expansion; Effect of RH . . . . . . . . . . . . . . . . . . . . . . . . . .
11
2.2.5.1
Constitutive Model Calibration . . . . . . . . . . . . . . . . . . . . . . . . . .
11
2.2.5.2
Prediction . . . . . . . . . . . . . . . . . . . . . . . . . . . . . . . . . . . . .
11
P6: AAR Expansion; Effect of Confinement . . . . . . . . . . . . . . . . . . . . . . . .
12
2.2.6.1
Constitutive Model Calibration . . . . . . . . . . . . . . . . . . . . . . . . . .
12
2.2.6.2
Prediction . . . . . . . . . . . . . . . . . . . . . . . . . . . . . . . . . . . . .
12
Structures . . . . . . . . . . . . . . . . . . . . . . . . . . . . . . . . . . . . . . . . . . . . . . .
14
2.3.1
P7: Effect of Internal Reinforcement . . . . . . . . . . . . . . . . . . . . . . . . . . . .
14
2.3.1.1
Description . . . . . . . . . . . . . . . . . . . . . . . . . . . . . . . . . . . . .
14
2.3.1.2
Prediction . . . . . . . . . . . . . . . . . . . . . . . . . . . . . . . . . . . . .
14
P8: Reinforced Concrete Beams . . . . . . . . . . . . . . . . . . . . . . . . . . . . . . .
14
2.3.2.1
Description . . . . . . . . . . . . . . . . . . . . . . . . . . . . . . . . . . . . .
14
2.3.2.2
Prediction . . . . . . . . . . . . . . . . . . . . . . . . . . . . . . . . . . . . .
16
2.2.6
2.3
P4: AAR Expansion; Temperature Effect . . . . . . . . . . . . . . . . . . . . . . . . .
2.3.2
i
ii
CONTENTS
2.3.3
2.3.4
2.3.5
P9: AAR Expansion; Idealized Dam . . . . . . . . . . . . . . . . . . . . . . . . . . . .
16
2.3.3.1
Description . . . . . . . . . . . . . . . . . . . . . . . . . . . . . . . . . . . . .
16
2.3.3.2
Prediction . . . . . . . . . . . . . . . . . . . . . . . . . . . . . . . . . . . . .
17
P10: Expansion of RC Panel With or Without Lateral Confinement . . . . . . . . . .
19
2.3.4.1 2.3.4.2
Description . . . . . . . . . . . . . . . . . . . . . . . . . . . . . . . . . . . . . Predictions . . . . . . . . . . . . . . . . . . . . . . . . . . . . . . . . . . . . .
19 25
P11: AAR Expansion of Nuclear Containment Vessel Followed by Earthquake . . . . .
26
2.3.5.1
Description . . . . . . . . . . . . . . . . . . . . . . . . . . . . . . . . . . . . .
26
2.3.5.2
Prediction . . . . . . . . . . . . . . . . . . . . . . . . . . . . . . . . . . . . .
27
2.3.5.2.1
Static . . . . . . . . . . . . . . . . . . . . . . . . . . . . . . . . . . .
28
2.3.5.2.2
Dynamic . . . . . . . . . . . . . . . . . . . . . . . . . . . . . . . . .
28
3 Results Submission and Workshop
29
3.1
Excel file for Results . . . . . . . . . . . . . . . . . . . . . . . . . . . . . . . . . . . . . . . . .
29
3.2
Workshop . . . . . . . . . . . . . . . . . . . . . . . . . . . . . . . . . . . . . . . . . . . . . . .
29
RILEM TC 259-ISR Prognosis of deterioration and loss of serviceability in structures affected by alkali-silica reactions
List of Figures 2.1
Deterioration of AAR affected concrete (Capra and Sellier, 2003) . . . . . . . . . . . . . . . .
6
2.2
Drying and Shrinkage test Cases . . . . . . . . . . . . . . . . . . . . . . . . . . . . . . . . . .
7
2.3
Mass variations for non reactive concrete under various RH conditions; (multon03) . . . . .
7
2.4
Strain variations for non reactive concrete under various RH conditions; (multon03) . . . . .
8
2.5
Humidity variation . . . . . . . . . . . . . . . . . . . . . . . . . . . . . . . . . . . . . . . . . .
8
2.6
Creep in non-reactive concrete under sealed condition for different axial stress; (multon03) .
9
2.7
Stress variation . . . . . . . . . . . . . . . . . . . . . . . . . . . . . . . . . . . . . . . . . . . .
9
2.8
Free expansion from Larive’s tests;(Larive:1998) . . . . . . . . . . . . . . . . . . . . . . . . .
10
2.9
Temperature variation . . . . . . . . . . . . . . . . . . . . . . . . . . . . . . . . . . . . . . . .
10
2.10 Mass variation for reactive concrete under various RH conditions; (multon03) . . . . . . . .
11
2.11 Strain variation for reactive concrete under various RH conditions;(multon03) . . . . . . . .
11
2.12 No vertical stress, no confinement (free swelling);(multon03) . . . . . . . . . . . . . . . . . .
12
2.13 10 MPa vertical stress, no confinement; (multon03) . . . . . . . . . . . . . . . . . . . . . . .
13
2.14 Vertical stress of 10 MPa and concrete cast in a 5 mm thick steel container; (multon03) . .
13
2.15 Vertical stress of 10 MPa and concrete cast in a 5 mm steel container; (multon03) . . . . . .
13
2.16 Concrete prism with internal reinforcement . . . . . . . . . . . . . . . . . . . . . . . . . . . .
14
2.17 Multon’s Beams . . . . . . . . . . . . . . . . . . . . . . . . . . . . . . . . . . . . . . . . . . . .
15
2.18 Mass variation of the beams . . . . . . . . . . . . . . . . . . . . . . . . . . . . . . . . . . . . .
16
2.19 Idealized dam . . . . . . . . . . . . . . . . . . . . . . . . . . . . . . . . . . . . . . . . . . . . .
17
2.20 Yearly variation of pool elevation . . . . . . . . . . . . . . . . . . . . . . . . . . . . . . . . . .
18
2.21 Specimens . . . . . . . . . . . . . . . . . . . . . . . . . . . . . . . . . . . . . . . . . . . . . . .
20
2.22 Stress Strain curve (28 days) . . . . . . . . . . . . . . . . . . . . . . . . . . . . . . . . . . . .
22
2.23 Concrete expansion block tested by Prof. E. Giannini . . . . . . . . . . . . . . . . . . . . . . 2.24 Laboratory measured expansion. Error bars: standard deviation. . . . . . . . . . . . . . . . .
23 24
2.25 Location of internal concrete gauges . . . . . . . . . . . . . . . . . . . . . . . . . . . . . . . .
24
2.26 Location of deformation sensors . . . . . . . . . . . . . . . . . . . . . . . . . . . . . . . . . . .
26
2.27 Characteristics of the NCVS . . . . . . . . . . . . . . . . . . . . . . . . . . . . . . . . . . . . .
27
3.1
30
Sample of Excel based presentation of results . . . . . . . . . . . . . . . . . . . . . . . . . . .
iii
List of Tables 1.1
List of Benchmark Problems . . . . . . . . . . . . . . . . . . . . . . . . . . . . . . . . . . . . .
3
2.1
Characteristics of the three specimens . . . . . . . . . . . . . . . . . . . . . . . . . . . . . . .
19
2.2
Target mix design . Aggregate quantities are for oven-dry material. Water quantities assume aggregates in saturated-surface dry (SSD) condition.
(∗)
To limit the early-age temperature
below ≈ 65o C, about 70% of the water was added to the mix as ice cubes. . . . . . . . . . . . 2.3
Reported 28 days compressive strengths ft0
fc0
21
(MPa) . . . . . . . . . . . . . . . . . . . . . . . .
21
2.4
Reported 28 days tensile strengths
(MPa) . . . . . . . . . . . . . . . . . . . . . . . . . . . .
22
2.5
Reported 28 days elastic modulus Ec (GPa) . . . . . . . . . . . . . . . . . . . . . . . . . . . .
22
2.6
Provided shrinkage curve data
. . . . . . . . . . . . . . . . . . . . . . . . . . . . . . . . . . .
22
2.7
Provided expansion curve data . . . . . . . . . . . . . . . . . . . . . . . . . . . . . . . . . . .
23
2.8
Strain gauges location points. ’S’ refers to KM embedded sensors, while ’R’ refers to resistive strain gauges placed directly on the rebars. . . . . . . . . . . . . . . . . . . . . . . . . . . . .
25
2.9
Deformation sensor location points . . . . . . . . . . . . . . . . . . . . . . . . . . . . . . . . .
25
iv
1— Introduction A number of structures worldwide are known to (or will) suffer from chemically induced expansion of the concrete. This includes not only the traditional alkali aggregate reaction (also known as alkali silica reaction) but increasingly delayed ettringite formation (DEF)1 . There are three components to the investigation of structures suffering from such an internal deterioration: a) Chemo-physical characterization focusing primarily on the material; b) Computational modeling of the evolution of damage and assessing the structural response of the structure; and c) managing the structure, (Divet et al., 2003). Focusing on the second one, ultimately an engineer must make prediction for the response of a structure. In particular: a) is the structure operational, b) is it safe, and c) how those two criteria will evolve in time. This task is best addressed through a numerical simulation (typically finite element analysis) which should account for most of the structure’s inherent complexities. This is precisely the object of this document. The assessment of these finite element codes has been partially assessed within the ICOLD International Benchmark Workshops on Numerical Analysis of Dams2 , and there were only limited discussion of AAR within the European project Integrity Assessment of Large Concrete Dams, NW-IALAD, however there has not yet been any rigorous and rational assessment of codes. Similar recent benchmark analyses of shear walls subjected to reverse cyclic load following AAR expansion, highlighted the need for a more comprehensive benchmark. Ultimately, practitioners would like to be able to calibrate their model with the limited historical field observation (typically inelastic crest displacements for dams, or crack maps for reinforced concrete) and then use it to extrapolate the behavior of the existing or modified structure into the future. In science and engineering, any extrapolation should be based on a fundamentally sound model which ideally should be independently assessed for its capabilities. Unfortunately, expansive concrete (finite element) models have not yet been assessed within a formal framework. The objective of this effort is indeed an attempt to develop such a formal approach for the benefit of the profession. Though we are aware of the importance of the chemical constituents of a reactive concrete (part a above), and their potential impact on the residual swelling, this aspect is not considered in this study. Henceforth, we limit ourselves to the interaction of various mechanical aspects: temperature, relative humidity, chemically induced swelling, and mechanical load. The authors believe that prior to the comparison of analysis of a structures, a series of simple tests should first be undertaken. Each one of the test problems in turn will highlight a strength (or deficiency) of 1 It is well known that DEF is often associated with AAR, however it is increasingly observed that it can occur by itself in massive concrete structure subjected to early age high temperature and under high relative humidity (above 95%). 2 The sixth (Salzburg) and the eighth (Wuhan) benchmarks invited participants to analyze Pian Telessio and Poglia dams respectively. There was no submission to the former, and only two for the second.
1
2
1.1. OBJECTIVES
a model, one at a time. Then and only then, we could assess a model predictive capabilities for the analysis of a structure. This document will describe such a series of tests, and format in which data should be reported. In order to facilitate comparison, the test problems are of increasing complexity. For the most part we assess one parameter at a time, then two, and then three. Only after such an exercise could we compare full blown dam and nuclear containment vessel structure subjected to static and dynamic load.
1.1
Objectives
This document is submitted by the authors to the Engineering community for the assessment of finite element codes which can perform a “modern” simulation of reactive concrete expansion. The study is composed of two parts, the first addresses material modeling, and the second structure modeling. For the material modeling each study is split in two parts: a) parameter identification for the constitutive model (through calibration of your model with provided laboratory test results); and b) Prediction.
1.2
Important Factors in Reactive Concrete
Assuming that the final residual swelling of the reactive concrete is known, and based on experimental and field observations, indications are that the following factors3 should be considered in the finite element analysis of a structure: 1. Environmental Conditions of the concrete (a) Temperature (b) Humidity 2. Constitutive models (a) Solid concrete (tension, compression, creep, shrinkage) (b) Cracks/joints/interfaces. 3. Load history 4. Mechanical Boundary Conditions (a) Structural Arrangement (b) Reinforcement (c) Anchorage
1.3
Problems
Table 1.1 describes the 11 problems defined. It should be understood that not all participants will contribute to all of them, but to most of them.
3 There
is no general agreement on the importance of all these parameters, the list is intended to be inclusive of all those perceived by researchers to be worth examining.
RILEM TC 259-ISR Prognosis of deterioration and loss of serviceability in structures affected by alkali-silica reactions
CHAPTER 1. INTRODUCTION
No. P0 P1 P2 P3 P4 P5 P6 P7 P8 P9 P10 P11
Description Textual description of finite element code/models Material Response Constitutive model Capturing drying and shrinkage Capturing creep Effect of Temperature Effect of RH Effect of confinement Structural Response Internal reinforcement Reinforced concrete beam Dam (simplified) Reinforced concrete panel expansion Nuclear containment vessel (Simplified) Table 1.1: List of Benchmark Problems
RILEM TC 259-ISR Prognosis of deterioration and loss of serviceability in structures affected by alkali-silica reactions
3
This page intentionally left blank.
2— Test Problems 2.1
P0: Finite Element Model Description
Provide up to five pages of description of the model adopted in this particular order: Constitutive Model 1. Basic principles of the model and its implementation. 2. Nonlinear constitutive model of sound or damaged concrete (clarify) (a) Instantaneous response (elasticity, damage, plasticity, fracture and others) (b) Delayed response (creep and shrinkage) 3. Effect on the chemically induced expansion by (a) Moisture (b) Temperature (c) Stress confinement 4. Effect on the mechanical properties of concrete by (a) Expansion (b) Shrinkage and creep Finite Element Code Features 1. Gap Element 2. Coupled hydro-thermo-mechanical 3. Others
2.2
Materials
In light of the preceding list of factors influencing AAR, the following test problems are proposed. All results are to be entered in the accompanying spreadsheet and formatting instruction strictly complied with (to facilitate model comparison).
2.2.1
P1: Constitutive Models
At the heart of each code is the constitutive model of concrete. This problem will assess the code capabilities to capture the nonlinear response in both tension and compression. It should be noted that in some codes, (Sellier et al., 2009) the constitutive model is tightly coupled (in parallel) with the AAR expansion one (modeled as an internal pressure), in other, (Saouma and Perotti, 2006) 5
6
2.2. MATERIALS
it is more loosely coupled (in series) with the AAR (modeled as an additional strain). 2.2.1.1
Constitutive Model Calibration
Perform a finite element analysis of a 16 by 32 cm concrete cylinder with fc0 , ft0 and E equal to 38.4 MPa, 3.5 MPa and 37.3 GPa respectively1 . Traction is applied on the top surface, and a frictionless base is assumed. Make and state any appropriate assumption necessary, use the following imposed strain histogram: 0 → 1.5
ft0 f0 → 0 → 3 t → 1.5εc → 0 → 3εc E E
(2.1)
where εc = −0.002. If needed, the fracture energy GF in tension and compression are equal to 100Nm/m2 and 10,000 Nm/m2 respectively. 2.2.1.2
Prediction
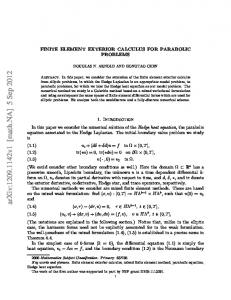
Units: m, sec., MN, and MPa. Repeat the previous analysis following an AAR induced expansion of 0.5%, you may use the experimentally obtained degradation curve, by (Institution of Structural Engineers, 1992) and published by Capra and Sellier ( (2003)), Fig. 2.1 Normalized Compression (ISE 92) Normalized Young Modulus (ISE 92)
Normalized Tension (ISE 92) Normalized Young Modulus (Larive 97)
1.20
Normalized Value
1.00 0.80 0.60 0.40 0.20 0.00 0
0.2
0.4 0.6 Swelling [%]
0.8
1
Figure 2.1: Deterioration of AAR affected concrete (Capra and Sellier, 2003) Results to be tabulated in the accompanying spreadsheet.
2.2.2
P2: Drying and Shrinkage
For some structures not necessarily under water (such as bridges or certain hydraulic structures), drying shrinkage strains may be of similar order of magnitude as the AAR induced ones. As shown in Fig. 2.2 one must consider various cases of drying and shrinkage, reactive and non reactive concrete, and at relative humidities ranging from a low 30% to a fully saturated environment, and sealed or not. There are a total of 6 potential cases of interest: a. Non reactive concrete at 30% RH b. Reactive concrete at 30% humidity 1 These
parameters should be used in all subsequent test problems.
RILEM TC 259-ISR Prognosis of deterioration and loss of serviceability in structures affected by alkali-silica reactions
CHAPTER 2. TEST PROBLEMS
7
c. Non Reactive concrete sealed specimen d. Non Reactive concrete under water. e. Reactive Concrete, sealed cylinder. f. Reactive concrete under water. which will be analyzed in P2 and P5
εfree f) R 100% H e) R Sealed d) NR 100% H c) NR Sealed
Time
b) R 30% H a) NR 30% H
Figure 2.2: Drying and Shrinkage test Cases
2.2.2.1
Constitutive Model Calibration
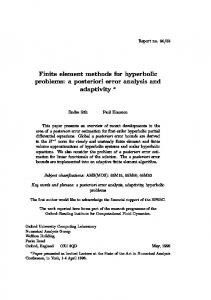
Fit your parameters using a 16 by 32 cm cylinder by performing the following analyses: a, c, and d with respect to the temporal variation of mass (Fig. 2.3) and longitudinal strain (Fig. 2.4) Mass, Fig. 2.3 and strain, Fig. 2.4 temproal variation2 .
2.0 Sealed
Water
30% RH
Mass variation (%)
1.0 0.0 -1.0 -2.0 -3.0 -4.0 0
50 100 150 200 250 300 350 400 450 500 550 600 650 700
Time (day)
Figure 2.3: Mass variations for non reactive concrete under various RH conditions; (multon03)
2 All
available experimental results are tabulated in separate Excel files.
RILEM TC 259-ISR Prognosis of deterioration and loss of serviceability in structures affected by alkali-silica reactions
8
2.2. MATERIALS
0.03 water
0.02
Sealed
30% RH
% Strain
0.01 0.00 -0.01 -0.02 -0.03 -0.04 -0.05 0
50
100 150 200 250 300 350 400 450 500 550 600 650 700 Time (day)
Figure 2.4: Strain variations for non reactive concrete under various RH conditions; (multon03)
2.2.2.2
Prediction
Units: m, sec., MN, and MPa. Using the parameter determined from the previous section, repeat the same analysis with the temporal variation of external RH for the cylinder shown in Fig. 2.5. � � t − 16 RHmax − RHmin RHmax − RHmin sin 2π + RH(week) = 2 52 2
(2.2)
where RHmax and RHmin are equal to 95% and 60% respectively. Yearly External Humidity Variation
RH [%]
100.0 80.0 60.0 40.0
0
10
20
30
40
50
Time [Weeks]
Figure 2.5: Humidity variation Results to be tabulated in the accompanying spreadsheet.
2.2.3
P3: Basic Creep
There is strong experimental and field indications that creep plays a dominant role in the irreversible long term deformation concrete subjected to constant load. Its effect must be accounted for to properly extract the AAR expansion. This may be explained through biaxially or triaxially loaded elements where swelling is restricted in one direction while free to occur on the other(s). Therefore, in the AAR constrained direction creep deformation will be predominant. This is more likely to occur in arch dams. RILEM TC 259-ISR Prognosis of deterioration and loss of serviceability in structures affected by alkali-silica reactions
CHAPTER 2. TEST PROBLEMS
2.2.3.1
9
Constitutive Model Calibration
For a 13 by 24 cm cylinder subjected to 10 and 20 MPa axial compression, plot the longitudinal and radial displacements. You may calibrate your model on the experimental curve shown in Fig. 2.6. Creep of Non Reactive Concrete with 10 and 20 MPa Axial Stress 0.05
0.00
Strain (%)
-0.05
-0.10
-0.15
Axial 10MPa Radial 10MPa
-0.20
Axial 20MPa Radial 20MPa
-0.25
-0.30 0
50
100
150
200
250
300
350
400
450
Time (day)
Figure 2.6: Creep in non-reactive concrete under sealed condition for different axial stress; (multon03)
2.2.3.2
Prediction
Units: m, sec., MN, and MPa. Using the previously determined parameters, repeat the same analysis for the axial load history shown in Fig. 2.7.
Stress [MPa]
Yearly Axial Traction Variation
-5 -6 -7 -8 -9 -10
0
10
20
30
40
50
Time [Weeks]
Figure 2.7: Stress variation Results to be tabulated in the accompanying spreadsheet.
2.2.4
P4: AAR Expansion; Temperature Effect
All chemical reactions are thermodynamically driven. Reactive concrete expansion varies widely with temperature ranges usually encountered in the field or laboratories. Hence, it is of paramount importance that the kinetics of the reaction captures this dependency. RILEM TC 259-ISR Prognosis of deterioration and loss of serviceability in structures affected by alkali-silica reactions
10
2.2. MATERIALS
2.2.4.1
Constitutive Model Calibration
Perform the finite element analysis of a 13 by 24 cm cylinder under water, free to deform at the base and undergoing a free expansion, and for T = 23o C and 38o C. Fit the appropriate parameters of your model with Fig. 2.8 obtained by Larive:1998
Gonflt longitudinal (jours)
Bétons réactifs, cylindres φ13Η24 , en enceinte humide
0.25 0.20 0.15 0.10 Incertitude élargie sur la mesure 0.05
Conservation à 38°C Conservation à 23°C
0.00 0
100
200
300
400
500
600
Temps( jours)
Figure 2.8: Free expansion from Larive’s tests;(Larive:1998)
2.2.4.2
Prediction
Units: m, sec., MN, and MPa. Repeat the previous analysis using the variable internal temperature T (week) =
� � t − 16 Tmax − Tmin Tmax − Tmin sin 2π + 2 52 2
where Tmax and Tmin are equal to 25o C and 0o C respectively, as shown in Fig. 2.9 Yearly External Temperature Variation
Temperature [oC]
30.0 25.0 20.0 15.0 10.0 5.0 0.0
0
10
20
30
40
50
Time [Weeks]
Figure 2.9: Temperature variation Results to be tabulated in the accompanying spreadsheet. RILEM TC 259-ISR Prognosis of deterioration and loss of serviceability in structures affected by alkali-silica reactions
(2.3)
CHAPTER 2. TEST PROBLEMS
2.2.5
11
P5: Free AAR Expansion; Effect of RH
Relative humidity plays a critical role in the expansion of AAR affected concrete. It is well established, (Poole, 1992) that expansion will start for a RH at least equal to 80%, and will then increase with RH (RH 8 is a widely accepted forumula). For external bridge structures and some dams this can be critical. 2.2.5.1
Constitutive Model Calibration
Using a 16 by 32 cm cylinder, and assuming a temperature of 38oC, fit the appropriate parameters for mass and vertical strain variation of reactive concrete as shown in Fig. 2.10 and 2.11 respectively.
Water
Sealed
30% RH
2.0
Mass variation (%)
1.0 0.0 -1.0 -2.0 -3.0 -4.0 -5.0 0
50
100
150
200
250
300
350
400
450
500
Time (day)
Figure 2.10: Mass variation for reactive concrete under various RH conditions; (multon03)
Water
Sealed
30% RH
0.30
% Strain
0.20
0.10
0.00
-0.10 0
50
100
150
200
250
300
350
400
450
500
Time (day)
Figure 2.11: Strain variation for reactive concrete under various RH conditions;(multon03)
2.2.5.2
Prediction
Units: m, sec., MN, and MPa. Repeat previous analysis using the RH variation shown in Fig. 2.5. RILEM TC 259-ISR Prognosis of deterioration and loss of serviceability in structures affected by alkali-silica reactions
12
2.2. MATERIALS
Results to be tabulated in the accompanying spreadsheet.
2.2.6
P6: AAR Expansion; Effect of Confinement
It has long been recognized that confinement inhibits reactive concrete expansion, (Charlwood et al., 1992), (L´eger, Cˆ ote, and Tinawi, 1996) and most recently (Multon and Toutlemonde, 2006). This test series seeks to ensure that this is properly captured by the numerical model. 2.2.6.1
Constitutive Model Calibration
For a 13 by 24 cm cylinder, and assuming a temperature of 38oC, analyze the following test cases (all of which consist of sealed specimens): P6-a. No vertical stress, no confinement (Free swelling), Fig. 2.12. Axial
Radial
0.100
0.080
% Strain
0.060
0.040
0.020
0.000
-0.020 0
50
100
150
200
250
300
350
400
450
500
Time (day)
Figure 2.12: No vertical stress, no confinement (free swelling);(multon03) P6-b. Vertical stress of 10 MPa, no confinement, Fig. 2.13. P6-c. No vertical stress, concrete cast in a 5 mm thick steel container, Fig. 2.14. P6-d. Vertical stress of 10 MPa and concrete cast in a 5 mm thick steel container, Fig. 2.15. In all cases, plot both the axial and radial strains. 2.2.6.2
Prediction
Units: m, sec., MN, and MPa. Repeat the analysis with the vertical and radial imposed stress histogram shown in Fig. 2.7. Results to be tabulated in the accompanying spreadsheet.
RILEM TC 259-ISR Prognosis of deterioration and loss of serviceability in structures affected by alkali-silica reactions
CHAPTER 2. TEST PROBLEMS
13
Axiall
Radiall
0.100 0.075 0.050
% Strain
0.025 0.000 -0.025 -0.050 -0.075 -0.100 -0.125 -0.150 0
50
100
150
200
250
300
350
400
450
500
Time (day)
Figure 2.13: 10 MPa vertical stress, no confinement; (multon03)
Strain (%)
Free Expansion with 5mm confinement 0.18 0.16 0.14 0.12 0.10 0.08 0.06 0.04 0.02 0.00 -0.02
Axial
0
50
100
Radial
150
200
250
300
350
400
450
Time (day)
Figure 2.14: Vertical stress of 10 MPa and concrete cast in a 5 mm thick steel container; (multon03) 10 MPa Axial Stress and 5mm confinement 0.06 0.04 Strain (%)
0.02 0.00 -0.02 -0.04 Axial
-0.06
Radiall
-0.08 -0.10 0
50
100
150
200
250
300
350
400
450
Time (day)
Figure 2.15: Vertical stress of 10 MPa and concrete cast in a 5 mm steel container; (multon03)
RILEM TC 259-ISR Prognosis of deterioration and loss of serviceability in structures affected by alkali-silica reactions
14
2.3. STRUCTURES
2.3
Structures
2.3.1
P7: Effect of Internal Reinforcement
2.3.1.1
Description
Internal reinforcement inhibits expansion and AAR induced cracking would then align themselves with the direction of reinforcement as opposed to the traditional “map cracking”. This test problem seeks to determine how the numerical model accounts for this, especially when cracking (thus a nonlinear analysis is needed) occurs. Analyze the cylinder of P6-a under the same condition (free expansion, 38oC, 100% RH), for the same duration with a single internal reinforcing bar of diameter 12 mm in the center, and E=200,000 MPa and fy =500 MPa.
2.3.1.2
Prediction
Units: m, sec., MN, and MPa. Determine longitudinal strain in the rebar and the longitudinal and radial strains on the surface of the concrete cylinder. In both cases values are to be determined at mid-height. rebar
240 mm 130 mm
Figure 2.16: Concrete prism with internal reinforcement Results to be tabulated in the accompanying spreadsheet.
2.3.2
P8: Reinforced Concrete Beams
2.3.2.1
Description
The mechanical behavior of two concrete beams, studied by S. Multon during his Ph.D. works at LCPC, is proposed. One beam is damaged by ASR during two years exposure in a 38o C environment and differential water supply, leading to differential ASR expansion within the structures. The other made with non-reactive aggregates was stored in similar conditions. Namely, the effects of the ASR development have been quantified in a 4-points bending test of the beams, resulting in a lot of data among which the residual stiffness and the flexural strength of both reactive and non-reactive beams. The objective is to simulate the evolution of the two beams during the two years of tests, and to finish by a simulation of beam failure in four points bending. RILEM TC 259-ISR Prognosis of deterioration and loss of serviceability in structures affected by alkali-silica reactions
CHAPTER 2. TEST PROBLEMS
15
250 mm
3m
2.8m during drying – watering cycles
Figure 2.17: Multon’s Beams
Material characteristic are the same then in tests P1 to P6, therefore, the LCPC performed tests at several dates since the fabrication (all the results are given in Table 1) insert table The whole experimental plan of LCPC involves several beams as mentioned in table 2. In the present benchmark only beams P4 and P6 have to be simulated. RILEM TC 259-ISR Prognosis of deterioration and loss of serviceability in structures affected by alkali-silica reactions
16
2.3. STRUCTURES
As AAR depends on humidity, a humidity profile must be fitted, in order to consider effect of saturation on the reaction. In order to fit the drying-humidification cycle, the mass evolutions of the beams are given bellow
Figure 2.18: Mass variation of the beams The temperature is constant and equal to 38o C. The concrete porosity is around 16% (15% at the bottom and 17% at the top of the beam). 2.3.2.2
Prediction
Units: m, sec., MN, and MPa. • The first objective is to find a realistic humidity profile compatible with the mass variation history given in figure 2.17. • The second objective is to predict the deflection of each beam, at mid span, versus time • The third objective is the evolution of stress versus time, in the bottom longitudinal reinforcement #16, at mid span. • The last stage consists to simulate, for the two beams, a four point bending test schematized in Fig. 2.18. Participants have to provide the Force-deflection curve until failure of each beam. Results to be tabulated in the accompanying spreadsheet.
2.3.3
P9: AAR Expansion; Idealized Dam
2.3.3.1
Description
This last test problem assesses the various coupling amongst various parameters as well as the finite element code and its ability to simulate closure of joint. A common remedy for AAR induced damage in dams is to cut a slot in the structure as in Mactaquac (Gilks and Curtis, 2003). This will relieve the state of stress, and allow the concrete to expand freely. However, at some point concrete swelling will result in a contact between the two sides of the slot. Hence, this problem will test the model ability to capture this important simulation aspect as well. Consider the reduced dam model shown in Fig. 2.19 with the following conditions: a) lateral and bottom faces are all fully restrained; b) front back and top faces are free; c) slot cut at time zero, total thickness 10 RILEM TC 259-ISR Prognosis of deterioration and loss of serviceability in structures affected by alkali-silica reactions
CHAPTER 2. TEST PROBLEMS
17
cm; d) concrete on the right is reactive, and concrete block on the left is not reactive; e) hydrostatic pressure is applied only on the right block.
10
m
z
h
80 m
A
10 mm R
20 m
50 m
y
x 15 m
15 m
Figure 2.19: Idealized dam
2.3.3.2
Prediction
Units: m, sec., MN, and MPa. Using the fitting data of P6, and an friction angle of 50o C for concrete against concrete, and zero cohesion, consider two cases: • Homogeneous field of internal temperature (20◦ C), relative humidity (100%), and an empty reservoir. • Transient field of external temperature Fig. 2.9, relative external humidity Fig. 2.5, and pool elevation variation Fig. 2.20 given by where ELmax and ELmin are equal to 95 and 60 respectively. For both analysis, the specified temperature and relative humidity is the one of the concrete surface. Zero flux condition between dam and foundation. Reference base temperature of the dam is 20o C. • x, y, z displacements of point A. • Fx, Fy and Fz resultant forces on the fixed lateral face versus time (25 years). Assume the typical yearly variations of external air temperature and pool elevation shown in Fig. 2.9 and 2.20 respectively. This model seeks to capture: a) general finite element program capabilities in modeling the joint response; b) ease (or difficulty in preparing the input data file for a realistic problem; and c) coupling of the various parameters. EL(week) =
� � ELmax − ELmin t ELmax − ELmin sin 2π + 2 52 2
where ELmax and ELmin are equal to 95 and 60 respectively. RILEM TC 259-ISR Prognosis of deterioration and loss of serviceability in structures affected by alkali-silica reactions
(2.4)
18
2.3. STRUCTURES
Elevation [m]
Yearly Variation of the Pool Elevation 100.0 95.0 90.0 85.0 80.0 75.0 70.0 65.0 60.0 0
10
20
30
40
50
Time [Weeks]
Figure 2.20: Yearly variation of pool elevation Results to be tabulated in the accompanying spreadsheet.
RILEM TC 259-ISR Prognosis of deterioration and loss of serviceability in structures affected by alkali-silica reactions
CHAPTER 2. TEST PROBLEMS
2.3.4
19
P10: Expansion of RC Panel With or Without Lateral Confinement
This section has been prepared with the assistance of Nolan Hayes, Ammar Abd-Elssamd and Qiang Gui from the University of Tennessee, Knoxville. The University of Tennessee, Knoxville (UTK), under U.S. Department of Energy (DOE) subcontract managed by Oak Ridge National Laboratory (ORNL), have been performing large scale laboratory testing of confined and unconfined concrete blocks (simulating a typical reinforced concrete member found in light water reactor nuclear power plants). The objective of this benchmark test case is to perform predictive numerical simulations of two large-scale reinforce concrete blocks (with different boundary conditions) and compare the simulation results with the already collected monitoring data.
2.3.4.1
Description
Geometry The laterally-confined reinforced concrete reactive specimen, referred to as CASR (’C’ for confined), is cast inside a rigid steel frame while a similar reinforced concrete reactive specimen, referred to as UASR (’U’, for unconfined) is allowed to expand without lateral restraints. A third specimen, non-reactive, referred to as CTRL, for control, is also not subjected to lateral restraints. See summary in Table 2.1 All three specimens of dimensions, 13600 × 11600 × 4000 (length, width and height; x-y-z axis), i.e., 3.453 m × 2.946 × 1.016 m, Fig. 2.21 are reinforced near the top and the bottom faces by two welded layers of orthogonal rebars: (22) #11 bars (1.41” nominal diameter, cross section area: 1006 mm2 ), (10) in one direction and (12) in the perpendicular direction, placed in horizontal planes – See Fig. 2.21(d) for layout. Rebars are made of standard carbon steel. Square plate heads (4” × 4” × 1”, i.e., 10.16 cm × 10.16 cm × 2.54 cm) are welded to the rebar extremities. The concrete cover, in the least distance to the concrete outer surface, is 3” (7.62 cm). There is no reinforcement in the third, i.e., vertical, direction, to the exception of (6) #11 debonded rebar spacers placed inside of pipes to allow free vertical expansion during the test. Steel Confinement Frame The steel plate girder frame was designed with the primary goal of maximizing stiffness in bending. In order to achieve this goal, 3” thick plates, height 3’4”, were chosen as flanges to the plate girder. These flanges are connected by three 2” thick web plates, length 2’10”. All steel was manufactured from A572 Grade 50 steel plate. Design of splice plate connection not provided here is available upon request. In order to reduce frictional effects between the steel frame and the concrete specimen, a single layer (thickness: 1.5 mm) of high-density polyethylene (HDPE) was introduced at the interface, providing a low steel-HDPE friction coefficient estimated by the vendor around 0.3 and unilateral contact conditions. Additional Post-tensioned system Four threadbar post-tension bars (2 in each direction, 2.5 inches dia.)
Table 2.1: ID 1 2 3
Characteristics of the three specimens Label Confined Reactive CASR Yes Yes UASR No Yes CTRL No No
RILEM TC 259-ISR Prognosis of deterioration and loss of serviceability in structures affected by alkali-silica reactions
20
2.3. STRUCTURES
(a) Computer rendering of the confined specimen (CASR)
(b) Form construction in UTK Civ. Env. Eng. high bay
11'-4" = 136" 10"
1'-1"
10"
5"
5"
10"
10"
10"
10"
10"
10"
10"
10"
3'-4"
1'-1"
z
1'-1"
x
1'-0"
8"
8"
1'-0"
TML KM-100B 10"
TENSIONED PIANO WIRE OR EQUIVALENT
*
1
1
1
10"
10"
EACH TRANSDUCER MUST BE TIED AT TWO LOCATIONS
5"
1
5"
1 1
1
3 *
10"
SCALE: 1" = 1'-0"
1
10"
T2.2
ILLUSTRATION OF HANGING EMBEDDED STRAIN GAGES 9'-8" = 116"
2
10"
1
10"
CUT REBAR IN HALF LENGTHWISE AND WELD BACK TOGETHER AFTER STRAIN GAGE INSTALLATION
10"
ELECTRIC STRAIN GAGE
ILLUSTRATION OF ATTACHING ELECTRIC STRAIN GAGES
1'-1"
3 T2.2
SCALE: 1" = 1'-0"
y
y
z
(c) Confined specimen layout – Top view. (Shaded area in- (d) Reinforcement layout – Top view. Bottom and top reindicating symmetries) forcement layout are identical. 11'-4" = 136"
1'-8"
N TH (Z
Y-DIRECTION EMBEDDED SG Z-DIRECTION EMBEDDED SG
3
X-DIRECTION REBAR SG
8"
TYPE
Y-DIRECTION REBAR SG
10"
10"
8"
1'-0"
1'-8"
X-DIRECTION EMBEDDED SG
3'-4"
8"
Figure 2.21: Specimens 8"
Z-DIRECTION EMBEDDED SG QUALITY CONTROL
1'-0"
AE EMBEDDED SENSOR
x
manufactured by DYWIDAG-Systems International (DSI) were installed in September 2016, in order 1'-8"
1'-8"
1
T2.2
SCALE: 1" = 1'-0"
SPECIMEN
8"
to increase the confining force, if necessary. It is initially just slightly tightened to avoid “slack”, and 8"
EMBEDDED INSTRUMENTATION QUANTIITIES
EMBEDDED STRAIN GAUGE LAYOUTS FOR SPECIMEN 3
1
has remained, as of today.
SENSOR KM-100B KM-100BT
1'-8"
ELECTRICAL STRAIN GAUGE KM-100B
3'-4"
Casting and Curing Casting took place July 23rd 2016. In an attempt to mitigate potential crack sources 1'-8"
2
NOTES; · "REBAR SG" ARE TO BE STRAIN GAGES APPROPRIATELY ATTACHED TO REINFORCING BARS BY CUTTING REBAR ALONG CENTER AND THEN WELDING BACK TOGETHER AFTER SG INSTALLATION
other than ASR, the formworks were insulated by placing rigid foam sheathing insulation with an R4
ELECTRICAL STRAIN GAUGE KM-100B
PROPOSED CUTTING LINES FOR MECHANICAL TESTING
value of three around the side and on top of the specimens, shortly after pouring. The insulation was 3
T1.3
KM-100BT
KM-100BT
SCALE: 1/2" = 1'-0"
placed with edges overlapping and secured in place with tape and plastic wrap. All formworks were removed on August 4, 2016. Each large specimen and concrete cylinder, for further materials testing, was covered with wet burlap to prevent moisture loss. The burlap was periodically moistened as required to keep the concrete surfaces wet. A few days after casting, the bottom support is removed, and the concrete block is vertically supported RILEM TC 259-ISR Prognosis of deterioration and loss of serviceability in structures affected by alkali-silica reactions
ELECTRICAL STRAIN GAUGE
CHAPTER 2. TEST PROBLEMS
21
by four 1800 × 1800 (45.7 cm × 45.7 cm) corner plates. Plates are directly supporting the specimens on the concrete surface. The estimated steel-concrete friction coefficient is ≈0.6. Operation A modular environmental chamber was designed by Norlake Scientific with the initial primary goals for temperature and humidity control being 100o F ± 2o F (38o C ± 1o C) and 95% ± 5%. The chamber was initialized for full operation early morning August 19, 2016. The chamber is periodically shutdown for inspection on a average frequency of 2 days per month. During shutdowns, the average temperature and RH are about ≈77o F (25o C) and 60% (transient of about 4 hours). After the shutdown period, the chamber is restarted and and the temperature and humidity return to the original set points within 6 hours. Target mix design The mix design has been extensively investigated at the University of Alabama, and the one retained, including a reactive and a control mix, is shown in Table 2.2 with 1” (25 mm) maximum size aggregate (MSA) composed of Green schist – muscovite, chlorite, quartz, Na-feldspar, K-feldspar, calcite, and, cristobalite. In this mix, only the coarse aggregate is reactive. A 50% sodium hydroxide solution (NaOH) is used to increase the alkali loading of the reactive mix to 5.25 kg.m−3 , and a 30% lithium nitrate solution (LiNO3) is used at 150% of the manufacturer´s recommended dosage to mitigate ASR for the control mix. Table 2.2: Target mix design . Aggregate quantities are for oven-dry material. Water quantities assume aggregates in saturated-surface dry (SSD) condition. (∗) To limit the early-age temperature below ≈ 65o C, about 70% of the water was added to the mix as ice cubes. Quantity, kg.m−3 (lb.yd−3 ) Materials Reactive Control Coarse Aggregate 1180 (1988.8) 1180 (1988.8) Fine Aggregate 728 (1226.6) 728 (1226.6) Cement 350 (590) 350 (590) (∗) Water 175 (295) 175 (295) w/c 0.5 0.5 NaOH solution 9.8 (16.6) LiNO3 solution 11.9 (20.03) Mechanical properties 28 days mechanical properties compressive and tensile strengths, and the elastic modulus are shown in Table 2.3, 2.4 and 2.5, respectively along with their mean and standard deviations. Table 2.3: Reported 28 days compressive strengths fc0 (MPa) Specimen Type AVG STD CASR 22.2 2.07 UASR 20.7 1.17 CASR: Confined Reactive Specimen UASR: Unconfined Reactive Specimen
A representative 28 days stress-strain curve is shown in Fig. 2.22. Shrinkage Shrinkage has been measured in the CTRL specimen. The datapoints for the shrinkage curve are shown in Table 2.6. info to be added. Expansion curves obtained from earlier material testing Expansion curves were obtained by Pr. E. RILEM TC 259-ISR Prognosis of deterioration and loss of serviceability in structures affected by alkali-silica reactions
22
2.3. STRUCTURES
Table 2.4: Reported 28 days Specimen Type CASR UASR
tensile strengths ft0 (MPa) AVG STD 2.70 0.215 2.13 0.044
CASR: Confined Reactive Specimen UASR: Unconfined Reactive Specimen
Table 2.5: Reported 28 days Specimen Type CASR UASR
elastic modulus Ec (GPa) AVG STD 34.5 3.03 34.4 2.22
CASR: Confined Reactive Specimen UASR: Unconfined Reactive Specimen Representative 28 days Stress-Strain
3500
3000
Stress (psi)
2500
2000
1500
1000
500
0 0
0.2
0.4
0.6
0.8
1
1.2
Strain (in/in)
1.4 × 10⁻³
Figure 2.22: Stress Strain curve (28 days) Table 2.6: Provided shrinkage curve data Measured Shrinkage Age (Days) Shrinkage 5 -0.0031% 10 -0.0104% 20 0.0162% 30 -0.0178% 40 -0.0185% 50 -0.0190% 60 -0.0194% 100 -0.0214% 200 -0.0245% 300 -0.0275%
Giannini, at the University of Alabama (UA), while testing different aggregates-forming concrete. The concrete blocks, 300 × 300 × 600 mm, are stored in UA climate chamber at 38o C and 95%RH, shown in Fig. 2.23, and their expansion was periodically monitored using DEMEC points. Data are tabulated in Table 2.7 and shown in Fig. 2.24 where the vertical expansions were taken over RILEM TC 259-ISR Prognosis of deterioration and loss of serviceability in structures affected by alkali-silica reactions
For each of five coarse aggregates, three blocks were cast: (1) a control with no admixtures, (2) a boosted/reactive specimen with NaOH added to increase the alkali loading to 5.25 kg/m3, and (3) a mitigat CHAPTER 2. TEST PROBLEMS 23 specimen with a lithium nitrate admixture used at 150% of the manufacturer’s recommended dosage. Both 3 the control and mitigated specimens had an alkali loading of 1.61 kg/m .
1. Testexpansion specimen showing DEMEC for Giannini measuring longitudinal expansion (top and long sides Figure 2.23:Figure Concrete block tested by targets Prof. E. transverse expansion (top), and vertical expansion (ends).
Later, based on expansion data (same obtaineddirection through March 2016, an additional set of cylinders were cast using a 150 mm gauge length, and longitudinal expansions as longitudinal) were taken over boosted/reactive mixtures with lower w/cm and mitigated mixtures with higher w/cm than the original a 500 mm gauge length. It should be noted that the reported mean (or average) corresponds to the mixtures. The cylinders are being tested for static elastic modulus, compressive strength, and split tensile average of all the experimental values. strength at 28 days of age.
Materials Table 2.7: Provided expansion curve data Calculated Expansions Cement: Cemex Type II from Knoxville, TN (0.46% Na2Oeq) Age (Days) Average Exp. STD Fine Aggregate: Manufactured Calera, AL: dolomite/calcite mix 6 0.000%sand from 0.0000% Coarse Aggregates (potentially reactive): See table below 40 -0.004% 0.0045% 68 0.000% 0.0031% Table 1. Coarse aggregates used in this study. 87 0.012% 0.0081% 103 0.020% 0.0091% Designation Source Classification / Mineralogy 117 0.028% 0.0103% C1 Gold Hill, NC Green schist: muscovite, chlorite, quartz, Na-feldspar, K-feldspar 138 0.045% 0.0193% calcite, cristobalite 152 Grand Junction, 0.057% CO 0.0250% C2 River gravel: feldspars, quartz, muscovite, dolomite 170 Rockville, 0.070% 0.0307% C3 VA Metavolcanic crushed stone: quartz, feldspars, calcite C4 TN Mixed tailings, primarily calcareous 190 Gordonsville, 0.088% 0.0382% C5 GA Dolostone: dolomite 220 Adairsville, 0.103% 0.0440% 304 0.146% 0.0634% 312 0.157% 0.0733% 350 0.165% 0.0729% 371 0.174% 0.0782% 459 0.192% 0.0885% 504 0.197% 0.0903%
Recorders/sensors location Recorder3 locations are shown as follows: Embedded KM strain transducer (KM-100B) , referred as strain gauges, gauge length 100 mm, in Fig. 2.25 and Table 2.8.
3 In
a finite element analysis, point from which we determine computed values are commonly referred to as “recorders”
RILEM TC 259-ISR Prognosis of deterioration and loss of serviceability in structures affected by alkali-silica reactions
24
2.3. STRUCTURES
Figure 2.24: Laboratory measured expansion. Error bars: standard deviation.
Figure 2.25: Location of internal concrete gauges Continued on next page
RILEM TC 259-ISR Prognosis of deterioration and loss of serviceability in structures affected by alkali-silica reactions
CHAPTER 2. TEST PROBLEMS
25
Coord. [inches] id
dof
x
y
Coord. [meter]
z
x
y
z
Table 2.8: Strain gauges location points. ’S’ refers to KM embedded sensors, while ’R’ refers to resistive strain gauges placed directly on the rebars. Coord. [inches]
Coord. [meter]
ID
DOF
x
y
z
x
y
z
S1
1
58
53
25
1.473
1.346
0.635
S2
2
63
48
25
1.600
1.219
0.635
S3
3
53
43
10
1.346
1.092
0.254
S4
3
53
43
20
1.346
1.092
0.508
S5
3
53
43
30
1.346
1.092
0.762
R1
1
63
53
36.375
1.600
1.346
0.924
R2
2
63
53
34.875
1.600
1.346
0.886
Resistive strain gauges General purpose resistive strain gauges (gauge length: 1.52 mm) were attached to the reinforcing bars in the specimens. These sensors are attached to the top and bottom of the rebar in the select locations to measure rebar strain. The location of resistive strain gauges of interest are shown in Fig. 2.25 and Table 2.8. Long gauges fiber-optics-based deformation sensors (SOFO, gauge length ≈ 1.0–1.5 m with location) measure (1) the vertical deformation between the bottom and top rebars layers, and, (2) horizontal deformation at the bottom surface as illustrated and tabulated in Fig. 2.26 and Table 2.9 Table 2.9: Deformation sensor location points Start Coord. [inches]
End Coord. [inches]
Start Coord. [meter]
End Coord. [meter]
ID
DOF
x
y
z
x
y
z
x
y
z
x
y
z
D1
3
91
45
4.25
91
45
35.75
2.311
1.143
0.108
2.311
1.143
0.908
D2
3
45
71
4.25
45
71
35.75
2.311
1.143
0.108
2.311
1.143
0.908
D3
1
45
26
0
104
26
0
1.143
0.660
0
2.642
0.660
0
D4
1-2
38.75
28.75
0
89.75
79.75
0
0.984
0.730
0
2.280
2.026
0
Test duration Casting occurred July 23rd 2016. Assuming testing will end April 19, 2019, it is requested to model a total duration of 1,000-days. 2.3.4.2
Predictions
Units: m, sec., MN, and MPa. Plot for both specimens, CASR and UASR, as a function of time (increments of one month) the following
RILEM TC 259-ISR Prognosis of deterioration and loss of serviceability in structures affected by alkali-silica reactions
26
2.3. STRUCTURES
Figure 2.26: Location of deformation sensors
model outputs: 1. Vertical displacements at D1 2. Concrete strain at S1, S2, S3, S4 and S5. 3. Reinforcement strains at R1 and R2 Results to be tabulated in the accompanying spreadsheet.
2.3.5
P11: AAR Expansion of Nuclear Containment Vessel Followed by Earthquake
2.3.5.1
Description
Ultimately, codes should be able to analyze nuclear containment vessel structures suffering from AAR under dynamic excitation. Accordingly, a much simplified geometry, inspired by NUREG/CR-6706 ( (2001)), is adopted. Fig. 2.27(a) shows the dimensions as well as the key material parameters. Note that the mat foundation and the walls only are subjected to AAR, the dome is not. Total reinforcement is 1% vertically, and 0.5% circumferentially. Reinforcement in each direction is to be split in two layers, each 10 cm from the wall. Ignore reinforcement of the dome, however triple the elastic modulus of the concrete. Steel elastic modulus is 200 GPa, and yield stress 250 MPa. RILEM TC 259-ISR Prognosis of deterioration and loss of serviceability in structures affected by alkali-silica reactions
CHAPTER 2. TEST PROBLEMS
27
For added clarity, the boundary conditions, and the expansion curve is shown in Fig. 2.27(b). Only gravity and AAR loads are first considered. Note that the AAR expansion is assumed to follow Larive’s curve (Larive, 1998) ε(t) = ε∞
1 − exp(− τtc )
(2.5)
l) 1 + exp (− (t−τ τc )
C.L.
E = 40 Gpa ν = 0.2 ρ = 2,400 kg/m3 f’t = 3.0 Mpa f’c = 30 Mpa GF = 120 N/m
19 m 0.76 m
A
ε∞ = 0.5% τl = 10 years τc = 5 years
Z
37 m
1.4 m
Y X
3m
(a) Geometery and Material Properties 1
0.5
0.4
Intensity [g]
AAR Volumetric Strain [%]
0.5
0.3 0.2 tlat
tlat+2tcar
0
-0.5
0.1 0
-1
0
5
10
15
20
25
30
35
40
0
5
10
15
Time [sec.]
Years
(b) Expansion Curve
(c) Expansion Curve
Figure 2.27: Characteristics of the NCVS
2.3.5.2
Prediction
Two sets of analyses are required: RILEM TC 259-ISR Prognosis of deterioration and loss of serviceability in structures affected by alkali-silica reactions
20
28
2.3. STRUCTURES
2.3.5.2.1
Static
Though an axisymmetric analysis is possible, it is highly recommended that a 3D one (using 180◦ segment) be performed. Plot 1. Horizontal displacement of point A (∆x ) versus time (increments of one month). 2. Maximum (positive) principal stress (σ(1) ) in the wall versus time. 3. Crack profiles at t = [5, 10, 20, 30] years 2.3.5.2.2
Dynamic
Perform a 3D dynamic analysis, for a harmonic intensifying dynamic excitation, shown in Fig. 2.27(c), assumed to occur at age t = 20 years. Assume a 5% Rayleigh damping. Report 1. Time of failure (may be defined when the analysis failed to converge). 2. Time displacement curves for point A starting with the AAR displacement that occurred at time 20 years, until failure (as defined by the user) occurs. 3. Maximum (positive) principal stress (σ(1) ) in the wall versus time. 4. Deformed shapes and crack profiles at 1 sec. increment (starting with t = 0) until reported failure. Results to be tabulated in the accompanying spreadsheet.
RILEM TC 259-ISR Prognosis of deterioration and loss of serviceability in structures affected by alkali-silica reactions
3— Results Submission and Workshop 3.1
Excel file for Results
All results should be entered in the accompanying spreadsheet, Fig. 3.1. Note that the spreadsheet contains all available experimental data to facilitate fits, and participants must enter their prediction within the predefined cells and for the specified time increments. All cells are protected except those which can be overwritten by participant data. This will greatly facilitate comparison of results, as a separate Matlab program could extract results from all submissions and results compared.
3.2
Workshop
A RILEM workshop will be held in conjunction with the annual 2018 RILEM TC-259 committee to discuss results.
29
30
3.2. WORKSHOP
(a) One tab for each Problem Names
Affiliation
email
Country
1 2 3 Computer Programs 1 2 Comments
(b) Identification
Test Case P10; Idealized Dam Model Time Months 0 3 6 9
Fixed T, RH, Load Displacement (mm) Resultant Foce MN x y z x y z
Transient T, RH, Load Displacement (mm) Resultant Foce MN x y z x y z
(c) Example of input cells Nuclear Containment Vessel years 0.00 0.50 1.00 1.50 2.00 2.50 3.00 3.50 4.00 4.50 5.00 5.50 6.00 6.50 7.00 7.50 8.00 8.50 9.00 9.50 10.00 10.50 11.00 11.50
Static AAR Δ Ax [mm] σ(1) Mpa
Dynamic (after AAR) time [sec.] 0.00 0.01 0.02 0.03 0.04 0.05 0.06 0.07 0.08 0.09 0.10 0.11 0.12 0.13 0.14 0.15 0.16 0.17 0.18 0.19 0.20 0.21 0.22 0.23
Δ Ax [mm] σ(1) Mpa
Failure at time:
Insert Crack profile t=1 sec.
Insert Crack profile t=5 years
(d) Data input and figures Temperature Data 25 A 0 Xi 12.5 RH Stress 61.1 -5 60.5 -5 60.1 -5 60.0 -5 60.1 -5 60.5 -5 61.1 -5 62.0 -5 63.1 -5 64.4 -5 65.9 -5 67.6 -5 69.4 -5 71.3 -5 73.3 -5 75.4 -5 77.5 -10 79.6 -10 81.7 -10 83.7 -10 85.6 -10 87.4 -10
12.5 16 EL 77.5 79.6 81.7 83.7 85.6 87.4 89.1 90.6 91.9 93.0 93.9 94.5 94.9 95.0 94.9 94.5 93.9 93.0 91.9 90.6 89.1 87.4
RH max RH min RH mean
RH Data 95 A 60 Xi 77.5
17.5 16
EL max EL min EL mean
Pool Data 95 A 60 Xi 77.5
17.5 0
Yearly External Temperature Variation 30 25 Temperature [oC]
Weeks 0 1 2 3 4 5 6 7 8 9 10 11 12 13 14 15 16 17 18 19 20 21
Tmax Tmin Tmean Temp. 0.8 0.4 0.1 0.0 0.1 0.4 0.8 1.4 2.2 3.1 4.2 5.4 6.7 8.1 9.5 11.0 12.5 14.0 15.5 16.9 18.3 19.6
20 15 10 5 0
0
10
20
30
40
50
Time [Weeks]
(e) Example of provided input data
Figure 3.1: Sample of Excel based presentation of results
RILEM TC 259-ISR Prognosis of deterioration and loss of serviceability in structures affected by alkali-silica reactions
Bibliography Capra, B. and A. Sellier (2003). “Orthotropic modeling of Alkali-Aggregate Reaction in Concrete Structures: Numerical Simulations”. In: Mechanics of Materials 35, pp. 817–830. Charlwood, R. G. et al. (1992). “A Review of Alkali Aggregate Reactions in Hydroelectric Plants and Dams”. In: Proceedings of the International Conference of Alkali-Aggregate Reactions in Hydroelectric Plants and Dams. Ed. by CEA and CANCOLD. Fredericton, Canada, pp. 1–29. Divet, L. et al. (2003). Aide ` a la gestion des ouvrages atteints de r´eactions de gonflement interne: Guide m´ethodologique. Tech. rep. Laboratoire Central des Ponts et Chaussees (LCPC). Gilks, P. and D. Curtis (2003). “Dealing with the Effects of AAR on the Water Retaining Structures at Mactaquac GS”. In: Proceedings of the 21st Congress on Large Dams. Montreal, Canada, pp. 681–703. Institution of Structural Engineers (1992). Structural effects of alkali-silica reaction. Technical guidance on the appraisal of existing structures. Tech. rep. Report of an ISE task group. Larive, C. (1998). “Apports Combin´es de l’Experimentation et de la Mod´elisation ` a la Comprehension del’Alcali-R´eaction et de ses Effets M´ecaniques”. PhD thesis. Paris: Laboratoire Central des Ponts et Chauss´ees. L´eger, P., P. Cˆ ote, and R. Tinawi (1996). “Finite Element Analysis of Concrete Swelling Due to AlkaliAggregate Reactions in Dams”. In: Computers & Structures 60(4), pp. 601–611. Multon, S. and F. Toutlemonde (2006). “Effect of Applied Stresses on Alkali-Silica Reaction Induced Expansions”. In: Cement and Concrete Research 36(5), pp. 912–920. NUREG/CR-6706 (2001). NUREG/CR-6706: Capacity of Steel and Concrete Containment Vessels With Corrosion Damage. http://pbadupws.nrc.gov/docs/ML0110/ML011070123.pdf. Poole, A.B. (1992). “Introduction to Alkali-Aggregate Reaction in Concrete”. In: The Alkali-silica Reaction in Concrete. Ed. by R.N. Swamy. Van Nostrand Reinhold, New York, pp. 1–28. Saouma, V. and L. Perotti (2006). “Constitutive Model for Alkali Aggregate Reactions”. In: ACI Materials Journal 103(3), pp. 194–202. Sellier, A. et al. (2009). “Combination of structural monitoring and laboratory tests for assessment of alkali aggregate reaction swelling: application to gate structure dam”. In: ACI Material Journal, pp. 281–290.
31