Journal of Volcanology and Geothermal Research 280 (2014) 126–130
Contents lists available at ScienceDirect
Journal of Volcanology and Geothermal Research journal homepage: www.elsevier.com/locate/jvolgeores
Short communication
Benchmarking and developing numerical Finite Element models of volcanic deformation James Hickey ⁎, Joachim Gottsmann University of Bristol, School of Earth Sciences, Wills Memorial Building, Queens Road, Bristol, BS8 1RJ, UK
a r t i c l e
i n f o
Article history: Received 20 February 2014 Accepted 11 May 2014 Available online 19 May 2014 Keywords: Volcano geodesy Volcano deformation Finite Element analysis COMSOL Multiphysics Uturuncu volcano
a b s t r a c t Volcanic deformation during an unrest episode can provide valuable insights into potential magmatic plumbing system dynamics. Paramount to this is a model linking the recorded ground movement to the causative source at depth. Most models employ analytical techniques due to their simplicity, but these are limited in their approach due to a number of necessary assumptions, and restricted to crude subsurface representations. We address this problem by providing guidelines and example model files to benchmark against a simple, analytical model with a numerical Finite Element approach using COMSOL Multiphysics. The boundary conditions should also be applicable to other Finite Element modeling packages. Then, due to the flexibility of the Finite Element method, this allows a progression of adding increasing complexities to reproduce the likely intricacies of the subsurface. We thus provide further guidelines and accompanying model files to incorporate subsurface heterogeneity, benchmarked viscoelastic rheology and temperature-dependent mechanics. In doing so, we highlight that setting up more integrated geodetic models is not particularly difficult and can alter inferred source characteristics and dynamics. The models are applied to Uturuncu volcano in southern Bolivia to demonstrate the approach. © 2014 Elsevier B.V. All rights reserved.
1. Introduction The spatial and temporal developments of volcanic deformation are very important monitoring observables during unrest episodes (Dzurisin, 2007). Deviations from background deformation velocities and footprints may signal an impending eruption (e.g. Dvorak and Dzurisin, 1997), particularly when combined with other monitoring techniques (Sparks, 2003). However, when volcanic geodetic data is used independently the objectives are often to distinguish and parameterize the driving mechanism behind the deformation (Poland et al., 2006). In the case of a solely magmatic origin, this is likely to be the pressurization of a plumbing system or reservoir, thus also leading to a more informed understanding of the physics of magma transport (e.g. Hautmann et al., 2010; Newman et al., 2012; Bonaccorso et al., 2013; Hickey et al., 2013). Mass movements and storage of magma beneath a volcano produce deformation at the Earth's surface by transferring the resulting stress and strain through the structure of the crust (e.g. Gudmundsson, 2012). Therefore, in order to extract information about the subsurface causative source, we must work backwards from measurements at the surface to the strain origin below. This inherently requires a model to link the two, incorporating the assumed mechanics of the crust inbetween. Using such models we can produce first-order estimates of ⁎ Corresponding author. E-mail addresses:
[email protected] (J. Hickey),
[email protected] (J. Gottsmann).
http://dx.doi.org/10.1016/j.jvolgeores.2014.05.011 0377-0273/© 2014 Elsevier B.V. All rights reserved.
source characteristics such as location, shape, size and pressure or volume change. The first of these was the ‘Mogi’ model, which solves for a pressurized point source in an elastic, homogeneous, isotropic half-space (Mogi, 1958) (Fig. S1). Models have since followed in a similar vein; employing analytical methods to place different-shaped, pressurized finite cavities in the same type of homogeneous model domain (e.g. McTigue, 1987; Yang et al., 1988; Fialko et al., 2001). This, however, is a crude and inaccurate representation of the Earth's crust, borne out of the necessary requirements to apply analytical techniques, thus limiting their overall applicability. Hence, they can often yield unrealistic or erroneous source characteristics. As an exception they do remain useful in providing very first-order estimates of source location, particularly when a previously un-studied volcano begins to show signs of unrest (e.g. Pritchard and Simons, 2002). Further attempts have been made to account for a different subsurface rheology, by replacing the elastic half-space with an alternative homogeneous, viscoelastic configuration (e.g. Dragoni and Magnanensi, 1989; Del Negro et al., 2009; Segall, 2010). But these still fail to capture the real complexities of the subsurface, and it is equally unlikely that the Earth's crust is viscoelastic from depth all the way to the surface with the same value of viscosity. The Finite Element (FE) method provides a flexibility that is unattainable with analytical methods, and this has permitted the development of increasingly complex models that integrate observations and inferences from other geosciences. The mathematical structure is capable of solving models that incorporate irregular geometries, volcanic topographies, heterogeneous material properties and various rheologies
J. Hickey, J. Gottsmann / Journal of Volcanology and Geothermal Research 280 (2014) 126–130
(e.g. Trasatti et al., 2003; Masterlark, 2007; Del Negro et al., 2009; Currenti et al., 2010; Geyer and Gottsmann, 2010; Gregg et al., 2012; Bonaccorso et al., 2013; Hickey et al., 2013). The former two can alter the spatial deformation pattern, which influences an inferred source's location, while the latter two result in smaller, more realistic pressure or volume changes when compared to the homogeneous elastic case, as well as also altering the spatial deformation pattern. These additional complexities do incur an extra computational cost, but this is outweighed by the benefits of using a more integrated and realistic model. Moreover, developments in computing hardware mean that most models will run on a basic desktop system. Nevertheless, analytical models dominate the volcanic geodetic literature, likely because of their noted simplicity and because the codes to run them have been written, passed on and improved for many years (e.g. Battaglia et al., 2013). Advanced FE models do require more extensive background information for application at a particular volcano (e.g. digital elevation models for topography, and seismic velocity and temperature distributions to infer structure, stiffness and rheology), but the basic model setup is not difficult to implement, and can also be passed between different volcanoes simply by altering geometries and material properties. We demonstrate this in the current paper by providing detailed guidelines (and model files) on how to benchmark against the ‘Mogi’ model with a numerical FE approach using COMSOL Multiphysics. This is an essential, quality-control first step to ensure that the FE approach is working correctly before continuing with additional complexities. We then provide further guidelines (and model files) to incorporate subsurface heterogeneity, benchmarked viscoelastic rheology and temperature-dependent mechanics. Finally, the models are applied to Uturuncu volcano in southern Bolivia to highlight the approach and demonstrate how a sequence of FE models can produce measurably different results to those obtained with analytical inversion techniques. 2. Modeling guides The instructions provided in the Supplementary materials are written for use with FE package COMSOL Multiphysics v4.3b employing a 2D-axisymmetric setup. They are equally applicable with previous v4.x releases of COMSOL Multiphysics, but require slight alterations for v4.4 (the latest release at the time of writing) owing to minor changes in the GUI and other incremental improvements. The boundary conditions specified are also applicable for other FE packages (e.g. ABAQUS) but the exact implementation will vary. In this regard, the provided tables of results with full model details (all geometries and material properties) allow for comparison between software packages to ensure correct model implementation.
127
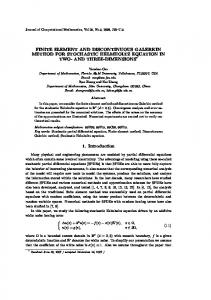
elastic ‘Mogi’ model, followed by the incorporation of a more advanced heterogeneous domain. Example COMSOL .mph files are also provided as a visual guide. 2.2. Viscoelastic models Various analytical models have been derived to account for viscoelastic rheology, employing different mechanical representations (Fig. 1 and Table 1). All allow for an instantaneous elastic deformation followed by a viscous creep, but the exact combination of elastic springs and viscous dashpots affects the time dependence of the resulting model (Fung, 1965; Christensen, 2003). Such viscous effects are important to consider as under varied time, pressure and temperature conditions materials exhibit different rheological behavior. Rocks, for example, are unlikely to be purely elastic at depth, and particularly in regions of high temperature around magmatic intrusions where thermal alteration is prevalent (Dragoni and Magnanensi, 1989). The reader is referred to Christensen (2003) for a more detailed analysis of the theory of viscoelasticity. To benchmark a FE setup against the analytical, viscoelastic ‘Del Negro’ model further instructions are provided, along with COMSOL .mph files, in the Supplementary materials. Additional information is also specified to progress to a heterogeneous viscoelastic setup. 2.3. Temperature-dependent mechanics The shortcomings of elastic models motivated the use of the homogeneous viscoelastic model above. However, it is more likely that the viscosity value is not homogeneous with depth and also varies considerably where temperature gradients are highest. For these reasons we can incorporate a spatially-varying, temperature-dependent viscosity derived from an assumed steady-state temperature distribution, and feed it into a mechanical viscoelastic model. This is carried out in two successive steps, which are explained in detailed step-by-step instructions in the Supplementary materials, and demonstrated in an accompanying COMSOL .mph file. An additional table of numerical results is also provided to enable comparison to other FE packages. The influence of the temperature-dependent viscosity will then depend on how the background geotherm interacts with the source temperature at the specified source depth. A shallow source that is substantially hotter than its surroundings will produce a significant
(a) Standard Linear Solid μ0
2.1. Elastic models The underlining theory behind linear elastic models is Hooke's Law; that stress is directly proportional to strain. Another important consideration is that any stress will produce an instantaneous strain, and thus in the case of volcanic deformation models, an immediate finite deformation at the surface. For more information on elasticity theory the reader is directed to Ranalli (1995). In the specific case of rocks, they are believed to only behave elastically at temperatures cooler than the brittle–ductile transition, and at strains of a few percent or less over short time-scales (Ranalli, 1995; Jaeger et al., 2007). It is vital to consider all of the above when selecting the most appropriate model for a chosen application. For example, an elastic model will only provide the same temporal deformation pattern as that which is used for the model forcing (i.e. chamber pressurization): an instant or increasing pressure will produce an instant or increasing temporal deformation pattern respectively. The detailed step-by-step instructions provided in the Supplementary materials explain how to benchmark against the homogeneous,
μ1
η
G
η
(b) Maxwell
Fig. 1. (a) The standard linear solid (SLS) viscoelastic model. Total rigidity (G) is split between the two elastic springs via the fractional shear moduli, where μ0 + μ1 = 1. (b) The Maxwell viscoelastic model. Both types of viscoelastic model have been used in analytical deformation models (Table 1).
128
J. Hickey, J. Gottsmann / Journal of Volcanology and Geothermal Research 280 (2014) 126–130
Table 1 Published analytical viscoelastic (VE) volcanic deformation models. Author
Year
VE representation
VE domain
Bonafede et al. Dragoni and Magnanensi Del Negro et al. Bonafede and Ferrari
1986 1989 2009 2009
Maxwell Maxwell SLS Maxwell
Segall
2010
Maxwell
Half-space Shell in elastic full-space Half-space Half-space & shell in elastic half-space Shell in elastic half-space
thermal halo with accordingly low values of viscosity. Whereas a deeper source that is more similar in temperature to its environment will have less of an influence on its host rock. 3. Application to Uturuncu volcano, Bolivia
described by a source 12–25 km below sea level (Pritchard and Simons, 2004). Comparable results were also observed when a similar technique was applied to the extended data set (Henderson and Pritchard, 2013). However, these models employ a homogeneous elastic half-space. The temperature distribution of the crust beneath Uturuncu is highly perturbed by the hot, thermal footprint of the APMB (de Silva and Gosnold, 2007), which leads to a shallow brittle–ductile transition zone (Jay et al., 2012). These observations suggest an inelastic crustal rheology, while the likely depth and long-lived nature of the source, as well as the constant temporal deformation rate, allude specifically towards viscoelasticity. Crustal heterogeneity is also observed beneath the volcano (Jay et al., 2012). Evidently, a homogeneous elastic half-space is not adequate to use in this scenario, so we apply the sequence of models described in Section 2 to examine the effect of changing crustal rheology and structure. Full details of the modeling approach and FE model setups are provided in the Supplementary materials.
3.1. Background 3.2. Results and discussion Uturuncu volcano lies within the Altiplano-Puna Volcanic Complex (APVC) of the Central Andes in Southern Bolivia (Fig. 2) (de Silva, 1989). Long-term uplift on the order of 1 cm/yr was first observed using InSAR from 1992 to 2000 across an axially symmetric, 70 km wide region (Pritchard and Simons, 2002). More recent work extends the observational period to 2011, not only documenting the same temporal and spatial uplift patterns, but also highlighting a surrounding moat of subsidence at 0.2 cm/yr with a 150 km diameter (Fialko and Pearse, 2012; Henderson and Pritchard, 2013). This unrest is associated with a large, regional zone of partial melt that underlies the volcano at around 20 km depth; the Altiplano-Puna Magma Body (APMB) (Chmielowski et al., 1999; Zandt et al., 2003; Schilling et al., 2006). Initial modeling of the uplift was based on analytical inversion techniques and found that the spatial deformation pattern was best −70˚
−69˚
−68˚
−67˚
−66˚
−65˚
−20˚
APMB −21˚
APVC −22˚
−23˚
Utur
3.2.1. Overall trends A summary of the pressure requirements to best fit the recorded uplift is shown in Table 2 for all models. Understandably, smaller pressures are required for the larger radii to fit the same uplift pattern. This highlights the fact that the choice of source size only affects the source pressure for a given depth and does not alter the spatial deformation pattern. The depth of the source is much more important as it broadly governs the width of the uplift anomaly. In this specific case, sources located at 30.4 km below the surface give a much improved fit to the observed InSAR data, regardless of crustal structure or rheology (Fig. 3). 3.2.2. Elastic vs. viscoelastic The range of values displayed in Table 2 highlight how viscoelastic models can produce the same amplitude of displacement for significantly smaller pressure changes when compared to elastic solutions. There is a ~ 40% reduction for the settings used here, but this value will depend on the choice of elastic and viscosity constants. For example, switching the viscosity to 1018 or 1019 Pa s changes the reduction to ~34% and ~8%, respectively (as well as altering the temporal development of the uplift). This is particularly beneficial, as elastic models often require unrealistic pressures that grossly exceed tensile strength estimates of crustal rocks (e.g. Gudmundsson, 2006). Therefore, a better understanding of the subsurface rheology will lead to a more informed pressure and size estimate of the causative source. 3.2.3. The role of crustal structure In the heterogeneous models a change in rheology modifies the spatial ground deformation patterns (in contrast to the homogeneous case). Moving from layered elastic, to layered viscoelastic, and then layered temperature-dependent viscoelastic, there is a gradual broadening of the uplift profile (Fig. S6). Comparing homogeneous models against their respective heterogeneous alternatives further demonstrates how
uncu
km 0 10
−24˚
LOS
Table 2 Pressure requirements from Uturuncu model simulations. Depth (km)
2.8 cm −25˚
Radius (m)
Modeled ΔP (MPa) Elastic
0
2000
4000
6000
Elevation (m) Fig. 2. The location of Uturuncu with respect to the Altiplano-Puna Magma Body (APMB) and the Altiplano-Puna Volcanic Complex (APVC), after Zandt et al. (2003) and de Silva et al. (2006). The interferogram shows the axially symmetric deformation pattern observed using InSAR between 19th May 1996 and 24th December 2000, with the average satellite line-of-sight depicted with the white arrow. The inset map shows the location of the study area (red box) within South America.
23.3
30.4
1000 2000 3000 4000 1000 2000 3000 4000
Viscoelastic
Mogi
Layered
Del Negro
Layered
Temp.-Dep.
2112 269 80 33 3072 375 115 48
1728 217 62 24 3072 375 111 47
1267 155 46 19.5 1845 225 70 29
1030 125 35 14 1750 220 65 27
1200 155 45 18 1800 225 66 28
J. Hickey, J. Gottsmann / Journal of Volcanology and Geothermal Research 280 (2014) 126–130
9
Shallow Deep
7
LOS Displacement (cm)
Despite a simplified geothermal gradient and temperaturedistribution, the models have highlighted that temperature-dependent mechanics can cause variations to both spatial and temporal deformation patterns, as well as simultaneously reduce source pressure requirements. The extent of each is highly dependent on the model setup, and in particular the specific interaction between the source (and its properties) and the rock in which it is hosted.
Elastic Homogeneous VE Heterogeneous Temp. Dep. VE
8
129
6 5 4 3 2 1 0
0
5
10
15
20
25
30
35
Radial Distance (km) Fig. 3. An example of model fits for the shallow and deep source depths. The gray bar depicts the surface displacement profile extracted from the InSAR figure and incorporates an expected InSAR uncertainty of ±1 cm. Each color reflects a different model class for a shallow (solid line) and deep (dashed line) source. In all cases the deep source provides an improvement over the shallow source and an acceptable fit to data. The model results are all for a source radius of 2 km.
a modified crustal structure can alter the spatial deformation footprint, regardless of rheology (Fig. S6). Layered models also generally have smaller pressure requirements than their homogeneous counterparts, which is broadly evident in Table 2. However, this effect is absent when comparing the elastic models with sources centered at 30.4 km. In this case, the average Young's Modulus of the overlying layers is almost identical to that used in the homogeneous model, so the amount of stress transferred via Hooke's Law is the same. In contrast, those sources at 23.3 km depth show a variable source pressure reduction dependent on the source radius. This is due to the average overlying Young's Modulus between the top of the source and the surface: larger sources penetrate further into the more compliant shallow layers so more stress can be transferred to the surface for a given pressure increment. Evidently, the mechanical make-up of the subsurface can have significant effects on both spatial deformation patterns and required source pressures. The exact amplitude of these effects is dependent on the heterogeneous configuration and how the source interacts with each mechanical layer so will vary from one volcano to the next. Therefore, inverting for source location (latitude, longitude and depth) in an analytical, homogeneous model may give inaccurate parameters due to a misrepresentation of the subsurface structure and an imprecise reproduction of ground displacement. 3.2.4. Temperature-dependency For the settings applied in these models, the temperaturedependent viscosity varies from ~1012 to 1039 Pa s. Consequently, the temperature-dependent models require a slight increase in source pressure when compared to the layered constant-viscosity models, because the average viscosity between the top of the source and the surface is higher (i.e. the rock is stiffer). This effect is exaggerated for the shallower sources, as the difference between the two average viscosities is larger. A further comparison between the deep and shallow source depths shows a difference in the temporal evolution of the uplift (Fig. S7). For the deeper sources, the uplift reaches its maximum value quicker, meaning there is a smaller proportion of viscous creep after the initial elastic inflation. Again this is due to the differences in overlying average viscosity; for the shallower sources this value is higher so the resultant relaxation time is longer.
3.2.5. Summary The incremental inclusion of a layered crustal structure, viscoelastic rheology and temperature-dependent viscosity each had a measurable effect on the spatial and temporal deformation patterns. The magnitude of which was dependent on its specific configuration. Such impacts would be unknown without the use of FE modeling. Other FE models have also shown that the simple source shapes employed with analytical models do not best replicate the driving force behind the recorded unrest. Instead a rising magmatic diapir, fed from the APMB, is the most likely cause (Fialko and Pearse, 2012; Hickey et al., 2013) and corroborates with independent gravity results (del Potro et al., 2013). 4. Conclusions We have introduced, explained and provided instructions for benchmarking against the ‘Mogi’ model, as well as its viscoelastic equivalent, the ‘Del Negro’ model. Exploiting the flexibility provided by the Finite Element (FE) method, further instructions are provided to adapt those models and integrate subsurface layering in place of the homogeneous medium. Final procedures on how to incorporate a temperaturedependent viscosity via a steady-state temperature distribution are also specified. Combined, these guidelines offer a template for conducting a FE based investigation of volcanic deformation, with many advantages over analytical methods. The detailed procedures are immediately applicable for volcanoes that are subsiding or uplifting due to a magmatic, or indeed hydrothermal cause, and can be customized to fit any number of geographic locations by simply adjusting geometry and material settings. In doing so, spatial and temporal deformation patterns can be assessed in significantly more detail than with analytical methods, to better constrain causative source parameters. This has improved knock-on effects for hazard forecasting, risk mitigation and planning of future monitoring projects. Supplementary data to this article can be found online at http://dx. doi.org/10.1016/j.jvolgeores.2014.05.011. Acknowledgments This work was supported by the European Union, Framework Program 7 (grant #282759, “VUELCO”, and grant #308665, “MEDSUV”), the Natural Environmental Research Council (NE/G01843X/1) and the Royal Society (UF090006). We thank Maurizio Battaglia, an anonymous reviewer and editor Joan Martí for their constructive reviews. References Battaglia, M., Cervelli, P.F., Murray, J.R., 2013. dMODELS: a MATLAB software package for modeling crustal deformation near active faults and volcanic centers. J. Volcanol. Geotherm. Res. 254, 1–4. Bonaccorso, A., Currenti, G., Del Negro, C., 2013. Interaction of volcano-tectonic fault with magma storage, intrusion and flank instability: a thirty years study at Mt. Etna volcano. J. Volcanol. Geotherm. Res. 251, 127–136. Bonafede, M., Ferrari, C., 2009. Analytical models of deformation and residual gravity changes due to a Mogi source in a viscoelastic medium. Tectonophysics 471 (1–2), 4–13. Bonafede, M., Dragoni, M., Quareni, F., 1986. Displacement and stress-fields produced by a center of dilation and by a pressure source in a viscoelastic half-space — application to the study of ground deformation and seismic activity at Campi-Flegrei, Italy. Geophys. J. R. Astron. Soc. 87 (2), 455–485. Chmielowski, J., Zandt, G., Haberland, C., 1999. The central Andean Altiplano-Puna magma body. Geophys. Res. Lett. 26 (6), 783–786. Christensen, R.M., 2003. Theory of Viscoelasticity: An Introduction. Dover Publications, New York.
130
J. Hickey, J. Gottsmann / Journal of Volcanology and Geothermal Research 280 (2014) 126–130
Currenti, G., Bonaccorso, A., Del Negro, C., Scandura, D., Boschi, E., 2010. Elasto-plastic modeling of volcano ground deformation. Earth Planet. Sci. Lett. 296 (3–4), 311–318. de Silva, S.L., 1989. Altiplano-Puna volcanic complex of the central Andes. Geology 17 (12), 1102–1106. de Silva, S.L., Gosnold, W.D., 2007. Episodic construction of batholiths: insights from the spatiotemporal development of an ignimbrite flare-up. J. Volcanol. Geotherm. Res. 167 (1–4), 320–335. de Silva, S.L., Zandt, G., Trumbull, R., Viramonte, J.G., Salas, G., Jimenez, N., 2006. Large ignimbrite eruptions and volcano-tectonic depressions in the Central Andes: a thermomechanical perspective. Geol. Soc. Lond., Spec. Publ. 269, 47–63. Del Negro, C., Currenti, G., Scandura, D., 2009. Temperature-dependent viscoelastic modeling of ground deformation: application to Etna volcano during the 1993–1997 inflation period. Phys. Earth Planet. Inter. 172, 299–309. del Potro, R., Diez, M., Blundy, J., Camacho, A.G., Gottsmann, J., 2013. Diapiric ascent of silicic magma beneath the Bolivian Altiplano. Geophys. Res. Lett. 40, 1–5. Dragoni, M., Magnanensi, C., 1989. Displacement and stress produced by a pressurized, spherical magma chamber, surrounded by a viscoelastic shell. Phys. Earth Planet. Inter. 56 (3–4), 316–328. Dvorak, J.J., Dzurisin, D., 1997. Volcano geodesy: the search for magma reservoirs and the formation of eruptive vents. Rev. Geophys. 35 (3), 343–384. Dzurisin, D., 2007. Volcano Deformation, Geodetic Monitoring Techniques. Praxis Publishing, Chichester. Fialko, Y., Pearse, J., 2012. Sombrero uplift above the Altiplano-Puna magma body: evidence of a ballooning mid-crustal diapir. Science 338, 250. Fialko, Y., Khazan, Y., Simons, M., 2001. Deformation due to a pressurized horizontal circular crack in an elastic half-space, with applications to volcano geodesy. Geophys. J. Int. 146 (1), 181–190. Fung, Y.C., 1965. Foundations of Solid Mechanics. Prentice-Hall, Englewood Cliffs. Geyer, A., Gottsmann, J., 2010. The influence of mechanical stiffness on caldera deformation and implications for the 1971–1984 Rabaul uplift (Papua New Guinea). Tectonophysics 483 (3–4), 399–412. Gregg, P.M., de Silva, S.L., Grosfils, E.B., Parmigiani, J.P., 2012. Catastrophic caldera-forming eruptions: thermomechanics and implications for eruption triggering and maximum caldera dimensions on Earth. J. Volcanol. Geotherm. Res. 241–242, 1–12. Gudmundsson, A., 2006. How local stresses control magma-chamber ruptures, dyke injections, and eruptions in composite volcanoes. Earth Sci. Rev. 79 (1–2), 1–31. Gudmundsson, A., 2012. Magma chambers: formation, local stresses, excess pressures, and compartments. J. Volcanol. Geotherm. Res. 237–238, 19–41. Hautmann, S., Gottsmann, J., Sparks, R.S.J., Mattioli, G.S., Sacks, I.S., Strutt, M.H., 2010. Effect of mechanical heterogeneity in arc crust on volcano deformation with application to Soufriere Hills Volcano, Montserrat, West Indies. J. Geophys. Res. Solid Earth 115, 18. Henderson, S.T., Pritchard, M.E., 2013. Decadal volcanic deformation in the Central Andes Volcanic Zone revealed by InSAR time series. Geochem. Geophys. Geosyst. 14 (5), 1358–1374.
Hickey, J., Gottsmann, J., del Potro, R., 2013. The large-scale uplift in the Altiplano-Puna region of Bolivia: a parametric study of source characteristics and crustal rheology using finite element analysis. Geochem. Geophys. Geosyst. 14 (3), 540–555. Jaeger, J.C., Cook, N.G.W., Zimmerman, R.W., 2007. Fundamentals of Rock Mechanics. Blackwell, Malden, Mass. Jay, J., Pritchard, M.E., West, M.E., Christensen, D., Haney, M., Minaya, E., Sunagua, M., McNutt, S., Zabala, M., 2012. Shallow seismicity, triggered seismicity, and ambient noise tomography at the long-dormant Uturuncu Volcano, Bolivia. Bull. Volcanol. 74 (4), 817–837. Masterlark, T., 2007. Magma intrusion and deformation predictions: sensitivities to the Mogi assumptions. J. Geophys. Res. 112 (B6), B06419. McTigue, D.F., 1987. Elastic stress and deformation near a finite spherical magma body — resolution of the point-source paradox. J. Geophys. Res. Solid Earth Planets 92 (B12), 12931–12940. Mogi, K., 1958. Relations between eruptions of various volcanoes and the deformations of the ground surfaces around them. Bull. Earthq. Res. Inst. 36, 99–134. Newman, A.V., Stiros, S., Feng, L., Psimoulis, P., Moschas, F., Saltogianni, V., Jiang, Y., Papazachos, C., Panagiotopoulos, D., Karagianna, E., Vamvakaris, D., 2012. Recent geodetic unrest at Santorini Caldera, Greece. Geophys. Res. Lett. 39 (6), L06309. Poland, M., Hamburger, M., Newman, A., 2006. The changing shapes of active volcanoes: history, evolution, and future challenges for volcano geodesy. J. Volcanol. Geotherm. Res. 150 (1–3), 1–13. Pritchard, M.E., Simons, M., 2002. A satellite geodetic survey of large-scale deformation of volcanic centers in the central Andes. Nature 418 (6894), 167–171. Pritchard, M.E., Simons, M., 2004. An InSAR-based survey of volcanic deformation in the central Andes. Geochem. Geophys. Geosyst. 5, 42. Ranalli, G., 1995. Rheology of the Earth. Chapman and Hall, London. Schilling, F.R., Trumbull, R.B., Brasse, H., Haberland, C., Asch, G., Bruhn, D., Mai, K., Haak, V., Giese, P., Muñoz, M., Ramelow, J., Rietbrock, A., Ricaldi, E., Vietor, T., 2006. Partial melting in the Central Andean Crust: a review of geophysical, petrophysical and petrologic evidence. In: Oncken, O., Chong, G., Franz, G., Giese, P., Goetze, H.-J., Ramos, V.A., Strecker, M.R., Wigger, P. (Eds.), The Andes, Active Subduction Orogeny. Springer, Berlin, pp. 459–474. Segall, P., 2010. Earthquake and Volcano Deformation. Princeton University Press, New Jersey. Sparks, R.S.J., 2003. Forecasting volcanic eruptions. Earth Planet. Sci. Lett. 210 (1–2), 1–15. Trasatti, E., Giunchi, C., Bonafede, M., 2003. Effects of topography and rheological layering on ground deformation in volcanic regions. J. Volcanol. Geotherm. Res. 122, 89–110. Yang, X.M., Davis, P.M., Dieterich, J.H., 1988. Deformation from inflation of a dipping finite prolate spheroid in an elastic half-space as a model for volcanic stressing. J. Geophys. Res. Solid Earth Planets 93 (B5), 4249–4257. Zandt, G., Leidig, M., Chmielowski, J., Baumont, D., Yuan, X.H., 2003. Seismic detection and characterization of the Altiplano-Puna magma body, central Andes. Pure Appl. Geophys. 160 (3–4), 789–807.