recurrence quantification analysis to find time series representatives. ... Please feel free to download our BestTime tool [7] to follow the stepwise operating instructions ... on the application and needs to be chosen by a domain expert. Variable ...
BestTime: Finding Representatives in Time Series Datasets Stephan Spiegel, David Schultz, Sahin Albayrak DAI-Lab, Berlin Institute of Technology, Ernst-Reuter-Platz 7, 10587 Berlin, Germany {spiegel, schultz, albayrak}@dai-lab.de http://www.dai-lab.de/~spiegel/besttime.html
Abstract. Given a set of time series, we aim at finding representatives which best comprehend the recurring temporal patterns contained in the data. We demonstrate BestTime, a Matlab application that uses recurrence quantification analysis to find time series representatives.
1
Introduction
This work presents BestTime, a platform-independent Matlab application with graphical user interface, which enables us to find representatives that best comprehend the recurring temporal patterns contained in a certain time series dataset. Although BestTime was originally designed to analyze vehicular sensor data and identify characteristic operational profiles that comprise frequent behavior patterns [6], our extended version [7] can be used to find representatives in arbitrary sets of single- or multi-dimensional time series of variable length. Our approach to find representatives in time series datasets is based on agglomerative hierarchical clustering [3]. We define a representative as the time series that is closest to the corresponding cluster center of gravity [5]. Since we want a representative to comprehend the recurring temporal patterns contained in the time series of the respective cluster, we need a distance measure that accounts for similar subsequences regardless of their position in time [6]. However, traditional time series distance measures, such as the Euclidean distance (ED) and Dynamic Time Warping (DTW), are not suitable to match similar subsequences that occur in arbitrary order [1,2]. Hence, we propose to employ Recurrence Plots (RPs) and corresponding Recurrence Quantification Analysis (RQA) [4,9] to measure the pairwise (dis)similarity of time series with similar patterns at arbitrary positions. In earlier work [8] we introduced a novel Recurrence Plot-based distance measure, which is used by our BestTime tool to cluster time series and find representatives. The following section describes the operation of our BestTime application and illustrates the identification of representatives on a small set of sample time series. We furthermore provide supplementary online material [7], including the executable Matlab code of BestTime, real-life data for testing, a video demonstration of BestTime, and a technical report with an introduction to the formal problem statement and employed recurrence plot-based distance measure.
2
2
Stephan Spiegel, David Schultz, Sahin Albayrak
BestTime
BestTime is a platform-independent Matlab application which provides an userfriendly interface. It enables a user to find representatives in arbitrary time series datasets by clustering the data sequences according to co-occurring patterns. In the following we briefly describe the operation of our BestTime application and illustrate the data processing for a small set of sample time series in Figure 1. Please feel free to download our BestTime tool [7] to follow the stepwise operating instructions given below. Input Data. BestTime is able to analyze multivariate time series with same dimensionality and of variable length. Each individual time series needs to be stored in an independent csv (comma separated values) file, where rows correspond to observations and columns correspond to variables. Optionally, the first row may specify the names of the variables. The user selects an input folder that should contain all time series in specified csv format. A small set of sample time series that we use as input is illustrated in Figure 1(a). Minimum Number of Observations. Depending on the application, the user can optionally reduce the size of the dataset by specifying the minimum length of the time series which should be consider for further processing. Data Reduction Rate. Since the cost of our pairwise distance calculations is quadratic in the length of the time series, we offer the possibility to reduce the length via piecewise aggregate approximation [2]. Given a time series of length n and a reduction rate r, the approximate time series is of length n/r. Minimum Pattern Length. The predetermined minimum pattern length directly influences the time series similarity. This parameter strongly depends on the application and needs to be chosen by a domain expert. Variable Selection. In case of time series datasets with multiple dimensions, the user interface of our tool offers the possibility to select the variables that should be considered for further analysis. Similarity Threshold. This parameter is usually very sensitive and directly influences the clustering result. Since it may be challenging to determine an appropriate similarity threshold for each variable, our tool can alternatively recommend (estimated) thresholds. Parallel Computing. Calculating the distance matrix is costly for large datasets. However, this step is fully parallelized and runs almost nCP U -times faster than serial processing. Up to twelve parallel workers are supported. Quality Control. Our tool presents a colored plot of the computed distance matrix and a histogram of the distance distribution in order to ensure appropriate parameter settings as well as clusters that preserve the time series characteristics. Since both plots are updated iteratively during distance calculations, we can abort computation anytime the preview suggests undesired results. For the distance matrix, a high variance in the distances/colors indicates an appropriate parameter setting, and a low variance in the distances/colors may result in poor clustering. In general, good clustering results can be achieved when the distances do not accumulate at either end of the interval (all close to zero or one). Figure 1(b) shows the quality control for our sample dataset.
BestTime: Finding Representatives in Time Series Datasets
3
(a)
(b)
(c)
(d) Representative: Peak01.csv (Cluster No. 2 of 3) Var 1
0.5 0
Recurrence
−0.5
10
20
30
40
50
60 Time
70
80
90
100
110
120
10
20
30
40
50
60 Time
70
80
90
100
110
120
3 2 1 0
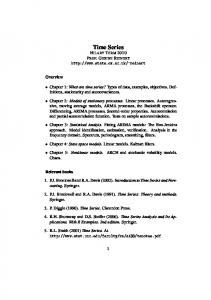
Fig. 1. BestTime operation and data processing for finding representatives in a certain time series dataset. (a) Given a set of time series with previously unknown patterns, we aim to cluster the data and find a representative (highlighted) for each group. (b) Visualization of computed distance matrix and distance distribution, which are used to ensure both appropriate parameter settings and clusters that preserve the time series characteristics. (c) Clustering results which show various validation indexes for a changing number of clusters, the list of identified representatives for a selected number of clusters, and the cardinality of the individual clusters. (d) Detailed view of a representative with corresponding pattern frequency regarding the selected cluster.
4
Stephan Spiegel, David Schultz, Sahin Albayrak
Clustering Validation. To support the user in choosing an optimal number of k clusters or representatives, our tool validates the cluster goodness for changing k according to three cluster validation indexes. Figure 1(c) shows the cluster validation for our sample dataset. Cluster Distribution. The clustering may result in groups of different size. Our tools illustrates the cluster distribution to identify outliers and emphasize prominent groups with expressive representatives. For our sample dataset all clusters have the same size, see Figure 1(c). List of Representatives. Since we aim at finding representatives, our tool does not only show a list of identified candidates as illustrated in Figure 1(c), but also allows to visualize the time intervals or patterns that co-occur in other time series of the same cluster as shown in Figure 1(d).
3
Conclusion and Future Work
We have introduced BestTime, a Matlab tool, which implements a recurrenceplot based approach to find time series representatives that best comprehend the recurring temporal patterns in a corresponding dataset. Furthermore, we provide supplementary online material [7], which includes our BestTime tool, real-life testing data, a video demonstration, and a technical report. In future work we plan to reduce the computational complexity of pairwise (dis)similarity comparisons by means of an approximate distance measure.
References 1. G. Batista, X. Wang, E. Keogh: A Complexity-Invariant Distance Measure for Time Series. In SDM, pages: 699-710, 2011. 2. H. Ding, G. Trajcevski, P. Scheuermann, X. Wang, E. Keogh: Querying and mining of time series data: experimental comparison of representations and distance measures. PVLDB, 1(2):1542-1552, 2008. 3. T. Liao: Clustering of time series data - a survey. Journal on Pattern Recognition, 38(11):1857-1874, 2005. 4. N. Marwan, M. Romano, M. Thiel, J. Kurths: Recurrence plots for the analysis of complex systems. Physics Reports, 438(5-6):237-329, 2007. 5. W. Meesrikamolkul, V. Niennattrakul, C. Ratanamahatana: Shape-Based Clustering for Time Series Data. In PAKDD, pages: 530-541, 2012. 6. S. Spiegel and S. Albayrak: An Order-invariant Time Series Distance Measure. In KDIR, pages: 264-268, 2012. 7. S. Spiegel, D. Schultz, M. Schacht, S. Albayrak: Supplementary Online Material - BestTime App, Test Data, Video Demonstration, Technical Report: http://www.dai-lab.de/~spiegel/besttime.html 8. S. Spiegel, B.J. Jain, S. Albayrak: A Recurrence Plot-based Distance Measure. Springer Proceedings in Mathematics, 2014. To appear. 9. C. Webber, N. Marwan, A. Facchini, A. Giuliani: Simpler methods do it better: Success of Recurrence Quantification Analysis as a general purpose data analysis tool. Physics Letters A, 373(41):3753-3756, 2009.