Between group comparison in ANOVA/Generalized Linear Model Let's ...
Recommend Documents
COMPARISON BETWEEN LINEAR-ADAPTIVE, LINEAR LOCAL MODEL. NETWORK AND NONLINEAR MPC CONTROLLERS. A. R. SECCHI*, L. G. S. LONGHI ...
May 10, 2017 - This study compares two models of the productionâ inventory system â optimal control and linear pro- gramming. We derived the optimality ...
Y. MASSAOUDI, D. ELLEUCH, D. MEHDI, T. DAMAK AND G. HASHIM. Recently, Sliding mode controllers (SMCs) have attracted many researchers and are.
Jan 1, 2001 - C-Regression Models towards Scale of Health in ICU. 1Mohd Saifullah ... The fuzzy c-mean (FCM) model proposed by Bezdek in 1981 ...
Mar 25, 2017 - KESAN LATIHAN PLIOMETRIKS MENGGUNAKAN METOD. KONVENSIONAL ... KERJA GURU TERHADAP PRESTASI KERJA GURU MATA.
Dec 2, 2012 - the three non-linear models had better overall prediction accuracy ... are becoming important in plant and animal breeding, personalized ... tion accuracy for several traits in wheat and maize than models ... (p) with a set of lines com
Mar 25, 2017 - SEJARAH DI SEKOLAH RENDAH: TINJAUAN DALAM. KALANGAN GURU DI .... 274-283. 28. HUBUNGAN PENGURUSAN KURIKULUM GURU BESAR ... department in Islamic University, Bengkulu, Indonesia. The results.
optimal solutions both for some well-known financial data sets used by several other authors, and for some unsolved large size portfolio problems. We also test ...
AbstractâComparative study on linear and nonlinear mixed pixel models of which pixels in remote sensing satellite images is composed with plural ground ...
Model Performance Between Linear Vector Autoregressive and Markov Switching. Vector Autoregressive Models on Modelling Structural Change in Time Series ...
energy. The discrepancy between calculation using Fermi-Eyges formula and ... Siemens Primus external radiation therapy device installed in. Radiotherapy ...
Mar 16, 2017 - Estimation of the reaction orders in Arrhenius models of quality ..... of Support Vector Classification Algorithms for the Prediction of Quality.
Mar 1, 2015 - observed and model-simulated circulation patterns across the North American domain. In general, the multi- model ensemble resembles the ...
nesonde data and Ozone Monitoring Instrument (OMI) satellite measurements. CMAQ forced with. RAQMS LBCs could reasonably reproduce the vertical ...
Jul 4, 2011 - Neural Network Models For Predicting PM10 Concentration Level Based On Gaseous And ..... Alley R. E. and Associates, Inc., (1998).
13 Nov 2006 - Abstract The modeling of tsunami generation is an essential phase in understanding .... Section 4 is devoted to the nonlinear shallow water.
Jun 7, 2018 - compounds are widely used in the chemical industry to understand the ... of both the acentric factor and the critical properties are necessary. ... estimation since they establish quantitative correlations between ... higher accuracy th
Jul 20, 2007 - but they allow additional statements about the transport coefficients and they ... In the following, the properties of more com- plex derivation schemes found in literature, the thermodynamic and the ... only by a constant, hence their
Dec 25, 2008 - numerical solutions with two different models, we found that the simple linear elastic model is ..... Suppose the distance from the contact center.
Dec 2, 2012 - (2011) and González-Camacho et al. (2012). All scripts were run in a Linux work station; for Bayesian ridge regression and Bayesian LASSO, ...
2 Figures. Fig. 1. Comparison of Exact and Numerical solution of P IA and AV IM · Fig. .... ing Eq.(4) and Eq.(2) until a result we may call satisfactory is ob-. tained.
Two experiments were simultaneously carried out to compare feed formulation models: a linear model for minimum cost with a nonlinear model for maximum ...
... Michaël Sicard, Adolfo Comerón, M. N. Md. Reba, and Adriano Camps .... MCYT is also thanked for the Ramón y Cajal position hold by Dr. M. Sicard, and ...
Jul 8, 2010 - Mexico City, Mexico (September 19th, 1985, La Villita, Guerrero Array); ... California, USA (February 9th 1971, 3838 Lankershim Blvd., L.A.);.
Between group comparison in ANOVA/Generalized Linear Model Let's ...
Between group comparison in ANOVA/Generalized Linear Model. Let's say, we have a dataset with multilevel treatment and a continuous response variables:.
Between group comparison in ANOVA/Generalized Linear Model Let's say, we have a dataset with multilevel treatment and a continuous response variables: treatment response 7
4.83
7
4.91
7
4.81
6
5.46
6
4.93
5.8
6
4.93
5.6
5
4.92
5.4
5
4.85
5
4.99
4
4.83
4.8
4
4.61
4.6
4
4.78
4.4
3
5.26
4.2
3
5.41
3
5.6
2
4.68
2
4.59
2
4.65
1
4.53
1
4.65
1
4.66
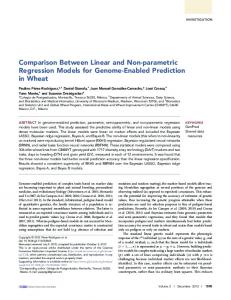
treatment Weighted Marginal Means Wald X²(7)=107.08, p=0.0000 6.2
response
6.0
5.2 5.0
4.0 1
2
3
4
5
6
7
treatment
1. We run ANOVA in GLZ module with sigma‐restricted parameterization (STATISTICA or SPSS); treatment 7 is the reference group. The results are: response - Parameter estimates (example) Distribution : NORMAL Link function: LOG Level of - Effect Estimate Standard - Error Wald - Stat.
p
Intercept
1.587607 0.005364
87599.79
0.000000
treatment 1
-0.058656 0.013772
18.14
0.000021
treatment 2
-0.052892 0.013704
14.90
0.000114
treatment 3
0.103104 0.012049
73.22
0.000000
treatment 4
-0.031570 0.013460
5.50
0.019005
treatment 5
0.005702 0.013047
0.19
0.662096
treatment 6
0.042940 0.012652
11.52
0.000689
0.119921 0.018504
42.00
0.000000
Scale
Problem: When looking in the observed means, very few of these treatment effects (the difference from the reference) makes sense.
2. When no sigma‐restricted parameterization is used, the results are more realistic, but still not quite: response - Parameter estimates (example) Distribution : NORMAL Link function: LOG Level of - Effect Estimate Standard - Error Wald - Stat.
p
Intercept
1.578979 0.014276
12234.03
0.000000
treatment 1
-0.050028 0.020713
5.83
0.015722
treatment 2
-0.044264 0.020651
4.59
0.032073
treatment 3
0.111732 0.019151
34.04
0.000000
treatment 4
-0.022942 0.020424
1.26
0.261330
treatment 5
0.014330 0.020046
0.51
0.474693
treatment 6
0.051568 0.019688
6.86
0.008811
treatment 7
0.000000 42.00
0.000000
0.119921 0.018504
Scale
3. Changing LOG link to IDENTITY does not have much effect. 4. When the same data are analyzed with ANOVA module, with Dunnett’s post hoc test and treatment 7 as a control group, the results are: Dunnett test; variable response (example) Probabilities for Post Hoc Tests (2-sided) Error: Between MS = .02157, df = 14.000 treatment
{7} 4.8500
1
1
0.254232
2
2
0.354544
3
3
0.001481
4
4
0.862988
5
5
0.978479
6
6
0.194778
7
7
My question is ‐ how the between‐group comparison is done for categorical multilevel variables in Generalized Linear Models module?