Network density is the number of edges in the network over the number of possible links (which is N(N -. 1)/2 for undirected networks). The concept of centrality.
Betweenness Centrality Dynamics in Networks of Changing Density L´aszl´o Guly´as♦♥ , G´abor Horv´ath♦♥ , Tam´as Cs´eri♥ , Zal´an Szakolczy♥ and George Kampis♦♥
Abstract— Dynamic networks are recently in the foreground of interest in various fields that deal with complex systems, such as sociology and biology (especially ecology and systems biology and epidemiology). Betweenness centrality of nodes is a particularly valued concept as a tool for characterizing large networks by way of selected nodes. In the present study, we were interested in the effects of various network changes on average betweenness (BW) centrality in networks of changing densities. We applied two different treatments in 100 trials on classic random networks models. In treatment one, we created various instances of the studied network models with different densities. We used classic network model families such as Erd˝os-R´enyi (ER), Barab´asi-Albert (BA) models, among others, and compared these with empirical network data at various densities. In treatment two, we studied the robustness of networks by simulating random node failures and planned attacks according to two scenarios.
I. INTRODUCTION Dynamic networks are recently in the foreground of interest in various fields that deal with complex systems, such as sociology and biology (especially ecology and systems biology and epidemiology). [2] [5] Betweenness centrality of nodes is a particularly valued concept since the epic paper of Granovetter [4] as a tool for characterizing large networks by way of selected nodes. [6] Nodes of high betweenness centrality have been used for determining important keystone species in food webs [8], finding clusters and communities [3] and to analyze the robustness of the network by identifying sensitive points of failures or attacks. [1] In the present study, we were interested in the effects of various network changes on average betweenness (BW) centrality as a measure of the network’s information processing capability [7]. We applied two different treatments in 100 trials on classic random networks models of 1000 nodes. In treatment one, we created various instances of the studied network models with different densities. We used classic network model families such as Erd˝os-R´enyi (ER), Barab´asiAlbert (BA) models, among others, and compared these with empirical network data at various densities. In treatment two, we studied the robustness of networks by simulating random node failures and planned attacks according to two scenarios. The first attack scenario followed the spirit of [1] by repeatedly removing nodes with the highest degree, while the second attack scenario modeled a more informed approach by targeting nodes with the highest betweenness centrality. Our results are, in part, highly counterintuitive. The paper is structured as follows. The next section overviews basic definitions. This is followed by two sections ♦
Collegium Budapest, Institute for Advanced Study, Budapest, Hungary E¨otv¨os University, Budapest, Hungary Correspondance to {lgulyas, gkampis}@colbud.hu ♥
discussing the two treatments. Section V. outlines future works and concludes the paper. II. DEFINITIONS AND DESCRIPTION OF THE EXPERIMENTS Real-world networks are commonly studied using random network models. One classic tool is the Erd˝os-R´enyi model that takes N nodes and assumes that each of the possible links is present with probability p ∈ [0, 1]. This process yields a network with a large connected component for relatively low values of p and with a Poisson-like degree distribution. [9] Another classic, yielding very different networks, is the Barab´asi-Albert (also called preferential attachment) model that starts with a small initial core network (arbitrarily connected) and adds the rest of the nodes one by one. Each new node creates E new links, such that partners are selected with a probability linearly proportional to the number of their existing links. This process generates networks whose degree distribution has a heavy tail and approximates a power law asymptotically. [10] Networks are characterized by a number of various measures. Among these, two are of paramount importance for our studies. Network density is the number of edges in the network over the number of possible links (which is N (N − 1)/2 for undirected networks). The concept of centrality expresses the structural importance of a given node. Various centrality definitions exists, of which we deal with betweenness centrality here, this expresses the ratio of shortest paths (among all possible node pairs) that go through the node in question. More formally, the betweenness centrality (BW) of node v is given by the formula BW (v) =
X s6=v6=t,s6=t
σst (v) , σst
(1)
where σst is the number of shortest paths from s to t, while σst (v) is the number of paths among these that pass through v. Since BW values are defined for each node in the network, and in our studies we deal with a high number of various networks, we focus on the average and maximum BW values, as a proxy for the distribution. In addition, the average and maximum BW values have an interesting connection with the robustness of networks. Following the seminal study of [1], robustness is understood as the resilience of networks, in terms of connectivity and average path length, subject to the repeated removal of nodes (and links connected to them). Since the BW of a node expresses the ratio of shortest paths that would be cut by the removal of that node, hence average BW is a proxy for the expected number of shortest paths
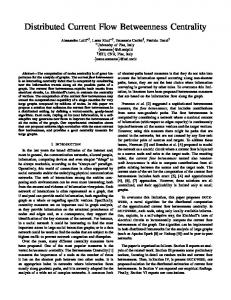
being affected by the deletion of a random node. Similarly, maximum BW points to the maximum damage that can occur by the removal of a single node. In [1] and the following studies, two node removal schemes were investigated. Uniform random node selection is termed ’random error’, while the deletion of the node with the highest degree is called ’attack’. (Note that the latter uses the heuristic of removing as many links as possible per iteration, implicitely defining node importance in terms of degree centrality.) In addition to these, we investigate another removal scheme, targeting nodes in the order of their BW rank. III. AVERAGE B ETWEENNESS C ENTRALITY AS A F UNCTION OF N ETWORK D ENSITY IN S TATIC N ETWORKS In order to understand BW for the removal experiments, in treatment one (Fig. 1.), we compared classic network models with each other and with different empirical networks. The figure shows computed values for theoretical network models and empirical data. Each point for the theoretical networks is the average of 100 different random runs. We studied ER and BA graphs of 100 and 1000 nodes, generated using the iGraph package (http://igraph.sourceforge.net/) and Network Workbench (http://nwb.slis.indiana.edu/), respectively. A different analysis (not shown here) reveals that, at the densities where our comparisons below are made, the error terms are negligibly small, indicating that the plotted points are highly typical. We analyzed the behavior of average BW centrality in the different cases that entail. In particular, our qualitative analysis shows that the classic random graphs of the Erd˝os-R´enyi (ER) type show first a rapid increase and then a steady decline of average BW centrality in the function of density. This is also to be expected a priori, based on the definition of the concept of BW centrality – to this, note that in a complete graph BW centrality must be exactly zero, because all links are shortest paths and hence no shortest route touches any other nodes, whereas node betweenness centrality is based exactly on the latter property from the point of view of the third nodes. An increase is also a priori inevitable at the low end, because the empty graph has also zero total centrality, and in the unconnected phase (i.e. below the density 1/N ) a higher density means more reachable nodes and hence (all other things being equal) a higher number of shortest pathways going through the connected nodes. (The standard practice in network analysis excludes unreachable node pairs from the treatment.) This makes the existence of a maximum also to be expected, and the exact point and the value of the maximum, as well as the shape of the function are determined by our simulation results (Fig. 1.). Also, note that – as obvious from elementary combinatorical considerations concerning the length of longest shortest routes – the position and value of the maximum must heavily depend on the number of nodes N , as is also visible on the figure. Nevertheless, the qualitative properties of the curves for different values of N are quite similar, and appear to be stretched variants of
the same basic form (indicating a possible universality, to be explored in future work). Barab´asi-Albert (BA) graphs, whereas starting on high, show a rapid drop-off in BW centrality, and then a similar behavior is experienced to that found in the ER case, up until extremely high densities. (The reason why the BA curve misses the initial increase at low densities is that, unlike ER, the preferential attachment algorithm always generates connected graphs). Surprisingly, however, the two lines (BA and ER) cross. At medium densities ER (which is completely random and hence unstructured) goes above BA (which is heavily structured as a result of preferential attachment). This counterintuitive fact indicates that BW centrality is little understood and cannot be considered a measure of ”structural importance of nodes” without further study. That the ER line goes above the BA line means that the importance (at least on the average) of the individual nodes connecting the distant parts of the network can be larger in the case where the nodes are all ”alike” (as in the ER network). By contrast, nodes in the BA network are topologically more ”specialized”, belonging to clearly different classes in their number of degrees, and most of the ”connecting work” is done by a few major nodes (”hubs”). The interesting relation we found between ER and BA lines means that ”node democracy” has a similar, and sometimes superior, effect on the studied average quantity, at least at low densities. Moreover, at densities where the average BW centrality of the BA network is higher than that of the respective ER network, the random graph is more robust against random failures, as we will see below. Despite the outlined differences and others, perhaps the most surprising result is the fact that in Fig. 1. the numeric differences between the BA and ER model are very small, and often indeed negligible at the ”interesting” densities. To localize ”interesting” densities on the density axis, first we note that small networks are, in general, denser (or ”easier get dense”) than large networks (for instance, adding merely 3 edges yields a full graph in a 3-node network, but has a negligible density effect in a network of 1000 nodes). Empirical networks in the social and biological domain are often small size networks, comprising 30-300 nodes (such as in school friendship networks, food webs, and movie plots). This is one reason why our current study of BW centrality included small (100 nodes) and lower-medium (1000 nodes) ER and BA networks, and now we want to compare them with the empirical counterparts. Fig. 1. shows two different types of empirical networks: food webs (from the collection of Robert Ulanowicz, http://www.cbl.umces.edu/ ulan/ntwk/network.html), and social as well as biological networks from the University of Michigan database maintained by Mark Newmann (http://www-personal.umich.edu/ mejn/netdata/). The networks studied are detailed in the Appendix. These networks have a density between 0.01 (with one outlier at 0.002) and 0.4, respectively, and generally the smaller networks in the two samples tend to be found at higher densities, in accordance with the above expectations.
Fig. 1.
Average of node betweenness centralities in various networks
Upon inspection, we find these empirical networks to be well aligned with the two theoretical network models (that in turn are essentially identical in the relevant range). To appreciate this, notice that the empirical data points above the 100-node BW line(s) have significantly fewer nodes (down to 20-30), and the larger empirical networks of many hundreds or thousand of nodes are at positions on the BW plot comparable with that expected for the ER and BA plots with identical node numbers (in particular, observe that networks with around 100 nodes are around the 100-node line and the larger neural network dataset (297 nodes) is far below them, and further, that the 1589-node co-authorship network is positioned far below the 1000-node line, etc.). The theoretical upper limit for average BW centrality at a given density is very large for most densities (i.e. except extreme densities). This makes the just formulated finding even more interesting. There could be many networks realizing high average BW centrality values – our result that (in the shown samples and a few others tested) all empirical networks are found far below this, in the ”low” region, and close to the (by itself strikingly similar) ER-BA lines is a highly remarkable fact that necessitates further studies. Clearly, these results merely establish a first case for average BW centrality studies and should be seen as a starting point of the latter.
IV. B ETWEENNESS C ENTRALITY IN N ETWORKS OF C HANGING D ENSITY In treatment two, we carried out experiments with changing densities. The motivation for these experiments is our interest in dynamic networks. In particular, we are interested in changing links. In the present study, we experimented with decreasing densities, in part, due to its immediate connections to existing works. [1] We first successfully replicated the results of AlbertJeong and Barab´asi regarding the random and degree-based removal of nodes. [1] We then extended these results by exploring a larger region of intial densities and by analysing the change in BW centralities. In addition, we introduced a third removal scheme (a second ’attack scenario’), i.e., the removal of high BW nodes. Our results show an initial decline in average BW in both ER and BA networks, as expected. However, after a critical loss, this is followed by a new characteristic peak. Fig. 2. shows the average BW centrality as the density lowering process progresses. The Erd˝os-R´enyi model is shown on the left, the Barab´asi-Albert is on the right. The networks in the experiments had 1000 nodes. We investigated several densities: the first row shows the density d = 0.004 (average degree is k = 4) the second row is denser d = 0.008 (average degree is k = 8). The average BW decreases almost
linearly in face of random node removal. This is because this scheme is likely to remove nodes without any significance, i.e., with a constant expected number of links. Of course, there may be occasional jumps but averaging over many runs smoothens these out. Targeted removals, on the other hand, show different behavior. In the beginning the average BW of the ER model drops about linearly just like in the random scenario (this is more visible in denser networks like ER with p = 0.008), whereas the average BW of the BA model increases significantly in the beginning. After this initial period, however, both network types show the same behavior: a sudden rise in average BW that culminates at a pointed peak and drops suddenly afterwards, reaching zero, where it is expected to be at the end of the run. Further analysis (not shown here) reveals that this secondary rise in BW centrality is due to the network approaching the critical density at which it becomes disconnected. The highest point of the peak marks the time step immediately preceding the dismantling of the network. Corresponding to a priori expectations, the BW-based scheme is the first to reach zero BW centrality. In addition, it is this scheme the quickest to result in a disconnected network, thus the secondary peak also appears first with this scheme. A further observation is that increasing initial densities result in later appearing peaks. This is a natural consequence of the more links higher densities imply. Notice, however, that BA networks produce earlier peaks, because of the higher structural dissimilarity of nodes and the success of the removal schemes to find structurally important nodes first. Turning our attention to the extreme cases, we also analysed the maximum BW centrality in the changing networks. Fig. 3. shows the of the maximum BW centrality among the nodes during the various removal schemes for the networks discussed above and shown on Fig. 2. Unlike the average BW, the maximum BW behaves differently in ER and BA networks during the random removal process. The maximum BW of ER network decreases extremely slowly during most of the experiment, even though the previously observed drop of the average BW informs us that the network changes radically. A drop finally happens, but it is at such a late stage, which is suggestive to happen at such low densities, where higher BW values are theoretically impossible. In contrast, the BA network shows an almost linear decrease of maximum BW with the random removal scheme. This is, again, due to the special structure of these networks and in particular to the high number of sparsely connected node. A random removal is likely to hit one of these, thus decreasing the maximum BW only because of the decrease in the number of connected pais. Non-random removal schemes show a different and somewhat counter-intuitive behavior. In ER networks, the maximum BW value’s initial decrease is much more moderate than in BA networks. This is due to the lower starting point. After this initial fall, the plots become similar: we observe a ‘valley of tranquility’, a period with almost no change or only a moderate increase. The length of this period
becomes longer with increasing initial density. After this valley, however, the maximum BW increases dramatically, and reaches a peak before suddenly dropping to its final value, zero. This peak corresponds to the one observed in average BW. In contrast, the initial period of targeted node removals in the BA network shows different dynamics in terms of average and maximum BW. While the maximum BW drops dramatically, the average BW slightly rises. This is, again, because of the ’hubs’, as these nodes typically have both very high betweenness and degree. Their removal obviously decreases the maximum BW value. However, in their absence the shortest paths connecting node pairs shift and become gradually longer, involving more and more vertices: thus increasing the average BW. Finally, there is an obvious difference between the degree-based and BWbased removal schemes: the latter results in consequently lower maximum BW values, except at the earlier appearing disconnection peak. One of the key observations from our analysis so far is the presence of secondary peaks in both average and maximum BW values during non-random removal schemes, due to the networks approaching the critical density. Moreover, the shape of the maximum BW curve in ER networks during random removal also appears to show a densitydependent cut-off. Therefore, it is informative to revisit our measurements and look at them from a density angle. Since the removal of nodes imply the removal of links as well, our removal schemes entail a gradual decrease of network density, too. Fig. 4. plots the average BW as a function of network density for the same experiments as before. Because density decreases as time progresses in our experiments, time advances ’from right to left’ in these charts. The random removal scheme produces a linear plot just like in Fig. 2. This is because this scheme removes about the same number of links per iteration, thus the density also decreases about linearly. In contrast, the targeted node removals appear different from Fig. 2. What seemed a fast raise on the time scale became a long, almost straight line, followed by the peak and then the drop to zero. This is because during the initial period, density is decresed at a higher rate, thus ’stretching’ the curve. More importantly, Fig. 4. confirms our expectations that the secondary peak appears around the critical density of d = 1/N , when the average number of links per node (k) drops below 1. Similarly, Fig. 5. plots maximum BW as a function of density. As above, it shows little difference for the random removal scheme, again, due to the evenly decreasing network density. We also observe that the final drop in maximum BW in ER networks indeed happens at extremely low densities (see our remark above). On the other hand, targeted removal schemes show interesting changes from Fig. 3. In the ER network the slowly increasing ’valley’ is particularly long. This means that most of the nodes (and links) can be removed without changing the maximum BW of the network. In addition, in case of BA networks, the initial sharp drop and the one following the critical point is stretched to a slower
fall. This means that not only the maximal BW centrality drops at the beginning of the removal process, but a great percentage of the links also disappear there. Finally, it is worth reflecting on the connection between Fig. 1. and Fig. 4., as both show average BW in ER and BA networks as a function of network density. Clearly, the former spans a much larger density range, but the main difference is that it plots values for independent networks, while the second deals with change in individual network instances. Yet, except for the random removal scenario, the charts exhibit a vague similarity. It is also clear, however, that the particular density changing strategy has a pronounced effect.
V. CONCLUSIONS AND FUTURE WORKS In this paper we have studied betweenness centrality in various networks under various schemes. We investigated both theoretical network models (Erd˝os-R´enyi and Barab´asiAlbert networks) and several empirical networks. In the first treatment we looked at average BW in a very large number of static networks and observed clear dependence on both network size and density. In addition, our results point to the possible existence of a universal rule for average BW in networks of given size and density. The stricter formulation of this rule is the subject of our future studies. In the second treatment, we looked at networks of decreasing densities, applying various node (and link) removal schemes. We studied the change in average and maximum BW values in changing Erd˝os-R´enyi and Barab´asi-Albert networks. We found that the BW-dynamics depends on the removal scheme applied, but in the investigated non-random schemes it generally corresponds to our findings from the first treatment, with a remarkable peak around a critical network density. To our knowledge, this is the first systematic and encompassing study on the role of BW centrality in networks of different and changing density. The results reported in this paper summarize the first phase of a longer research plan. We intend to continue studying the density dependence of BW values, as well as other centralities. An important part of our future works will be the study of dynamic networks at increasing densities.
VI. ACKNOWLEDGEMENTS This research was partially supported by the Hungarian Government (Anyos Jedlik programme managed by the National Office for Research and Technology: TexTrend project (www.textrend.org), contract no. NKFP 07 A2 (2007)TEXTREND) and the European Union’s Seventh Framework Programme: DynaNets, FET-Open project no. FET-233847 (www.dynanets.org). The supports are gratefully acknowledged.
R EFERENCES [1] Albert, R., Jeong, H., Barab´asi, A.-L.: ”Error and attack tolerance of complex networks”, Nature 406, 378-382 (27 July 2000) [2] Kampis, G., Guly´as, L., Sz´aszi, Z., Szakolczi, Z.: ”Dynamic Social Networks and the Textrend / CIShell Framework”, Applied Social Network Analysis Conference, 27-28 August 2009, University of Zurich and ETH. [3] Girvan M. and Newman M. E. J.: ”Community structure in social and biological networks”, Proc. Natl. Acad. Sci. USA 99, 78217826 (2002) [4] Granovetter, M.: ”The Strength of Weak Ties”, American Journal of Sociology 78 (6): 13601380, May 1973 [5] Guly´as, L., Kampis, G., Szakolczi, Z., Jord´an, F.: ”Finding Trendsetters in Longitudinal Networks”, COINS conference, http://www.coins2009.com/ [6] Kampis, G., Guly´as, L., Szakolczi, Z., Sz´aszi, Z., So´os, S.: ”Mapping Science: Bio-Inspired Methods for Dynamic Network Analysis”, Modeling Science Conference, Oktober 6-9, Amsterdam, http://modellingscience.simshelf.virtualknowledgestudio.nl/ [7] Sloot, P.M.A., Ivanov, S., Boukhanovsky, A., van de Vijver, D., Boucher, C.: ”Stochastic simulation of HIV population dynamics through complex network modeling”, Int. J. Comput. Math., 85, 11751187, 2008. [8] Vasas, V., Jord´an, F.: ”Topological keystone species in ecological interaction networks: considering link quality and non-trophic effects”, Ecological Modelling, 196:365-378, 2006. [9] Erd˝os, P.; R´enyi, A.: ”On Random Graphs. I.”, Publicationes Mathematicae 6: 290297, 1959. [10] Barab´asi, A.-L., Albert, R.: ”Emergence of scaling in random networks”, Science 286: 509512, 1999.
VII. A PPENDIX : D ESCRIPTION OF THE E MPIRICAL N ETWORKS A. Data used from the University of Michigan collection (Mark Newman) 1. Karate: Zachary’s karate club: social network of friendships between 34 members of a karate club at a US university in the 1970s. From W. W. Zachary, An information flow model for conflict and fission in small groups, Journal of Anthropological Research 33, 452-473 (1977). 2. Les Miserables: co-appearance network of characters in the novel Les Miserables, from D. E. Knuth, The Stanford GraphBase: A Platform for Combinatorial Computing, Addison-Wesley, Reading, MA (1993). 3. Word adjacencies: adjacency network of common adjectives and nouns in the novel David Copperfield by Charles Dickens, from M. E. J. Newman, Phys. Rev. E 74, 036104 (2006). 4. American College football: network of American football games between Division IA colleges during regular season Fall 2000. From M. Girvan and M. E. J. Newman, Proc. Natl. Acad. Sci. USA 99, 7821-7826 (2002). 5. Dolphin social network: an undirected social network of frequent associations between 62 dolphins in a community living off Doubtful Sound, New Zealand. From D. Lusseau, K. Schneider, O. J. Boisseau, P. Haase, E. Slooten, and S. M. Dawson, Behavioral Ecology and Sociobiology 54, 396-405 (2003). 6. Political blogs: A directed network of hyperlinks between weblogs on US politics, recorded in 2005 by Adamic and Glance. From L. A. Adamic and N. Glance, ”The political blogosphere and the 2004 US Election”, in Proceedings of the WWW-2005 Workshop on the Weblogging Ecosystem (2005). This network was converted to an undirected graph for the present analysis. 7. Books about US politics: A network of books about US politics published around the time of the 2004 presidential election and sold by the online bookseller Amazon.com. Edges between books represent frequent co-purchasing of books by the same buyers. The network was compiled by V. Krebs. 8. Neural network: A directed, weighted network representing the neural network of C. Elegans. Data compiled by D. Watts and S. Strogatz, Nature 393, 440-442 (1998). Original experimental data taken from J. G. White, E. Southgate, J. N. Thompson, and S. Brenner, Phil. Trans. R. Soc. London 314, 1-340 (1986). 9. Coauthorships in network science: coauthorship network of scientists working on network theory and experiment, as compiled and published by M. Newman in M. E. J. Newman, Phys. Rev. E 74, 036104 (2006).
Fig. 2. Average BW dynamics of ER and BA networks in time using various density lowering schemes. ER networks are on the left, BAs are on the right. In the first row the initial density is d = 0.004 (average degree is k = 4), in the second d = 0.008 (k = 8). (These correspond to link probabilities p = 0.004, 0.008 in the ER model and e = 2, 4 link per newly arriving node in the BA model.) Blue lines depict random node removals, reds are maximum degree-based, while greens maximum-BW based removals. (Displayed alues represent the average of 32 × 10 = 320 independent runs.)
Fig. 3. Maximum BW dynamics of ER and BA networks in time using various density lowering schemes. ER networks are on the left, BAs are on the right. In the first row the initial density is d = 0.004 (average degree is k = 4), in the second d = 0.008 (k = 8). (These correspond to link probabilities p = 0.004, 0.008 in the ER model and e = 2, 4 link per newly arriving node in the BA model.) Blue lines depict random node removals, reds are maximum degree-based, while greens maximum-BW based removals. (Displayed values represent the average of 32 × 10 = 320 independent runs.)
Fig. 4. Average BW dynamics versus density in ER and BA networks using various density lowering schemes. ER networks are on the left, BAs are on the right. In the first row the initial density is d = 0.004 (average degree is k = 4), in the second d = 0.008 (k = 8). (These correspond to link probabilities p = 0.004, 0.008 in the ER model and e = 2, 4 link per newly arriving node in the BA model.) Blue lines depict random node removals, reds are maximum degree-based, while greens maximum-BW based removals. (Displayed values represent the average of 32 × 10 = 320 independent runs.)
Fig. 5. Maximum BW dynamics versus density in ER and BA networks using various density lowering schemes. ER networks are on the left, BAs are on the right. In the first row the initial density is d = 0.004 (average degree is k = 4), in the second d = 0.008 (k = 8). (These correspond to link probabilities p = 0.004, 0.008 in the ER model and e = 2, 4 link per newly arriving node in the BA model.) Blue lines depict random node removals, reds are maximum degree-based, while greens maximum-BW based removals. (Displayed values represent the average of 32 × 10 = 320 independent runs.)
B. Data used from the Foodwebs Collection, Robert Ulanowicz 1. Chesapeake: Chesapeake Bay Mesohaline Network; D. Baird; Umcees Ref No. XXX-86; MGC/M2/SUM 1 from datall.zip from http://www.cbl.cees.edu/˜ulan/ntwk/network.html. Chesapeake Bay mesohaline ecosystem. Summer carbon flows. Baird, D. and R.E. Ulanowicz. 1989. The seasonal dynamics of the Chesapeake Bay ecosystem. Ecol. Monogr. 59: 329-364. 2. ChesLower: Lower Chesapeake Bay in Summer; Hagy 2001; mgC/m2/summer from datall.zip from http://www.cbl.cees.edu/˜ulan/ntwk/network.html. Lower Chesapeake Bay in Summer Hagy, J.D. 2002. Eutrophication, hypoxia and trophic transfer efficiency in Chesapeake Bay PhD Dissertation, University of Maryland at College Park (USA), 446 pp. 3. ChesMiddle: Middle Chesapeake Bay in Summer; Hagy 2001; mgC/m2/summer from datall.zip from http://www.cbl.cees.edu/˜ulan/ntwk/network.html. Middle Chesapeake Bay in Summer Hagy, J.D. 2002. Eutrophication, hypoxia and trophic transfer efficiency in Chesapeake Bay PhD Dissertation, University of Maryland at College Park (USA), 446 pp. 4. ChesUpper: Upper Chesapeake Bay in Summer; Hagy 2001; mgC/m2/summer from datall.zip from http://www.cbl.cees.edu/˜ulan/ntwk/network.html. Upper Chesapeake Bay in Summer Hagy, J.D. 2002. Eutrophication, hypoxia and trophic transfer efficiency in Chesapeake Bay PhD Dissertation, University of Maryland at College Park (USA), 446 pp. 5. Crystal C: Crystal River Creek (Control); Homer & Kemp Unpubl. Ms.; Mg/M2/Day from datall.zip from http://www.cbl.cees.edu/˜ulan/ntwk/network.html. Tidal Marsh Gut, Vicinity of Crystal River Nuclear Power Plant, Crystal River, Florida, USA in in Homer, M. and W.M. Kemp. Unpublished Ms. See also Ulanowicz, R.E. 1986. Growth and Development: Ecosystems Phenomenology. Springer, New York. pp 69-79. 6. Crystal D: Crystal River Creek (Delta Temp), Homer & Kemp Unpbl. Ms., Mg/M2/Day from datall.zip from http://www.cbl.cees.edu/˜ulan/ntwk/network.html. Tidal Marsh Gut with thermal effluent (6 deg. C delta T) Adjacent to Crystal River Nuclear Power Plant, Crystal River, Florida, USA in Homer, M. and W.M. Kemp. Unpublished Ms. See also Ulanowicz, R.E. 1986. Growth and Development: Ecosystems Phenomenology. Springer, New York. pp 69-79. 7. Everglades: Everglades Graminoid Marshes; Wet Season Opossum corrected - gC/m2/y - 07/25/00 3 from datall.zip from http://www.cbl.cees.edu/˜ulan/ntwk/network.html. Ulanowicz, R.E., J.J. Heymans, and M.S. Egnotovich. 2000. Network Analysis of Trophic Dynamics in South Florida Ecosystems, FY 99: The Graminoid Ecosystem. Ref. No. [UMCES] CBL 00-0176. Chesapeake Biological Laboratory, Solomons, MD 20688-0038 USA. http://cbl.umces.edu/ atlss/swgras701.html 8. Florida: Florida Bay Trophic Exchange Matrix, Wet Season from datall.zip from http://www.cbl.cees.edu/˜ulan/ntwk/network.html. Florida Bay Wet Season 125 - component trophic exchange matrix. Ulanowicz, R.E., C. Bondavalli and M.S. Egnotovich. 1998. Network Analysis of Trophic Dynamics in South Florida Ecosystem, FY 97: The Florida Bay Ecosystem. Ref. No. [UMCES]CBL 98-123. Chesapeake Biological Laboratory, Solomons, MD 20688-0038 USA. http://cbl.umces.edu/ atlss/FBay701.html 9. Maspalomas: Charca de Maspalomas from datall.zip from http://www.cbl.cees.edu/˜ulan/ntwk/network.html. Charca de Maspalomas, Gran Canaria Almunia, J., G. Basterretxea, J. Aristegui, and R.E. Ulanowicz. 1999. Benthic- Pelagic switching in a coastal subtropical lagoon. Estuarine, Coastal and Shelf Science 49:363-384. 10. Michigan: Lake Michigan Control network, A. Krause & D. Mason, Mich State Univ. 02 from datall.zip from http://www.cbl.cees.edu/˜ulan/ntwk/network.html. Lake Michigan Control network Krause, A. and D. Mason. (In preparation.) A. Krause, PhD. Dissertation, Michigan State University. Ann Arbor, MI. USA 11. Mondego: Mondego Estuary - Zostrea site. 4 from datall.zip from http://www.cbl.cees.edu/˜ulan/ntwk/network.html. Patricio, J. (In Preparation) Master’s Thesis. University of Coimbra, Coimbra, Portugal. 12. Narragan: Narragansett Bay Model, Aug 1994. (mgC/m2/year) 0 from datall.zip from http://www.cbl.cees.edu/˜ulan/ntwk/network.html. Monaco, M.E. and R.E. Ulanowicz. 1997. Comparative ecosystem trophic structure of three U.S. Mid-Atlantic estuaries. Mar. Ecol. Prog. Ser. 161:239254. 13. Rhode: Rhode River Watershed Water Budget 3/81 - 2/82; D. Correll Et Al. from datall.zip from
http://www.cbl.cees.edu/˜ulan/ntwk/network.html. Water exchanges in the Rhode River Watershed, Anne Arundel County, Maryland USA. Correll, D. (Unpublished manuscript) Smithsonian Institute, Chesapeake Bay Center for Environmental Research, Edgewater, Maryland 21037-0028 USA. 14. StMarks: St. Marks River (Florida) Flow network janfeb.dat;mgC/m2 day 6 from datall.zip from http://www.cbl.cees.edu/˜ulan/ntwk/network.html. St Marks River (Florida) Estuary Baird, D., J. Luczkovich and R. R. Christian. 1998. Assessment of spatial and temporal variability in ecosystem attributes of the St Marks National Wildlife Refuge, Apalachee Bay, Florida. Estuarine, Coastal, and Shelf Science 47: 329-349. http://drjoe.biology.ecu.edu/stmarks/stmarks.htm