Alice E. Smith, Senior Member IEEE. Department of Industrial ...... [27] Ripley, B. D. (1994) âFlexible non-linear approaches to classification,â in V. Cherkassky,.
Bias and Variance of Validation Methods for Function Approximation Neural Networks Under Conditions of Sparse Data
Janet M. Twomey Department of Industrial and Manufacturing Engineering Wichita State University Wichita, Kansas Alice E. Smith, Senior Member IEEE Department of Industrial Engineering University of Pittsburgh Pittsburgh, Pennsylvania
Accepted to IEEE Transactions on Systems, Man, and Cybernetics
January 1998
Bias and Variance of Validation Methods for Function Approximation Neural Networks Under Conditions of Sparse Data
Abstract Neural networks must be constructed and validated with strong empirical dependence, which is difficult under conditions of sparse data. This paper examines the most common methods of neural network validation along with several general validation methods from the statistical resampling literature as applied to function approximation networks with small sample sizes. It is shown that an increase in computation, necessary for the statistical resampling methods, produces networks that perform better than those constructed in the traditional manner. The statistical resampling methods also result in lower variance of validation, however some of the methods are biased in estimating network error.
1. INTRODUCTION To be beneficial, system models must be validated to assure the users that the model emulates the actual system in the desired manner. This is especially true of empirical models, such as neural network and statistical models, which rely primarily on observed data rather than analytical equations derived from first principles. Validation of these models using problemspecific information, such as theoretic relationships or experiential knowledge, should be performed where possible. This paper focuses on the empirical aspect of model validation. Substantial amounts of data must be available to both construct and validate empirical models in the traditional manner, however, for some systems data is only available at great expense. The quandary becomes how to best use the relatively sparse data to both construct the model, and then validate it, prior to use. To this end, the research in this paper focuses on the adaptation and evaluation of statistical validation methods to the field of neural networks. While the domain of neural networks originally arose from researchers trying to develop 1
computing mechanisms to emulate the biological brain, neural networks can also be viewed as a super set of statistics. Neural networks are a super set because they have been theoretically proven to serve as universal approximators when they include nonlinear activation functions [42]. The trained weights of a neural network are a vector-valued statistic, and training is the process of computing that statistic. The relationship between neural network models and statistical models has been the subject of several recent papers by well known statisticians [4, 5, 27] with the general conclusion that there are many important parallels between the development of neural network models and the computation of statistical models. Therefore, the approach of this paper is to construct and validate neural networks under conditions of sparse data1 by adapting the statistical literature on evaluating estimators of model prediction error. Judging the effectiveness of an estimator can be broken into two fundamental aspects bias and variance. Bias measures the expected value of the estimator relative to the true value and variance measures the variability of the estimator about the expected value. An ideal estimator (and an ideal model) will have no bias and low variance. To achieve low variance and no bias under conditions of small samples, the sample observations must be leveraged maximally. That is, they must all contribute to both the final model itself and to the model validation. The statistical literature contains several error estimation methods that achieve this by substituting computational effort for the unavailable larger data sample. Described below are five error estimation methods used for evaluating prediction models:
1
Under conditions of ample data, model building is less dependent on decisions concerning allocating the sample between model building and model validation.
2
resubstitution, cross-validation (CV), jackknife, bootstrap and train-and-test (also known as data splitting).
The notation and terminology in this paper are adapted from Efron’s work that
examines three resampling methods (CV, jackknife, bootstrap) used to estimate the error of statistical prediction models [6-9]. The resampling methods allow the final model to be built on the entire sample of n observations, while the error estimate is derived from repeated sampling of n to construct multiple validation models. Throughout this paper, the model that is constructed and ultimately applied to the problem is referred to as the application model. Models constructed to estimate the prediction error of the application model are referred to as validation models. This paper centers on neural network models so that network is used interchangeably with model, however the discussion may be applicable to other data-driven models as well. 2. ERROR ESTIMATION METHODS Assume that there is a population F from which a random sample, Tn, of size n is drawn, Tn={(x1, y1), (x2, y2), ... , (xn, yn)}; where ti=(xi,yi) is a realization drawn iid from F. A training pair ti=(xi,yi), consists of a predictor (feature) vector, xi , and the corresponding output (response) variable, yi. Both xi and yi may be continuous, or in cases where the prediction problem is classification, binary; furthermore yi may be a vector but, without the loss of generality, is restricted to a scalar for purposes of simplifying this discussion. F$ is the empirical distribution (the sample of n observations) putting equal mass (1/n) on each observation ti of Tn, for i = 1 to n. From Tn, a prediction model fˆ (Tn , x ) is constructed, so that for any xo, randomly but independently chosen from the same population F, yo can be predicted. Prediction error is measured according to some specified loss function L, typically the squared or absolute error. For the remainder of this paper L will be the absolute error, as it is
3
commonly used in both statistical and neural network models of continuous and classification relationships. The expected true error, Err, of the model f$ (Tn , x ) is defined as the expected error the model makes on any observation xo taken from F: 1 N (1) Err = ∑ yi - f$[Tn , x i ] N i =1 Err can only be calculated by a census of all N members of the population F; the primary
validation objective is to estimate Err from the available sample, and this estimate is denoted as $ . Err
There are several methods available to perform the validation task. The most common statistical methods are resubstitution, CV and variants, and bootstrap and variants. The most common neural network method of prediction error estimation is train-and-test, more commonly known as data splitting in the statistical literature. Resubstitution: True error is estimated using the same sample that is used to construct the model (all data is resubstituted back into the model [18, 29]): $ Err Resub =
1 n y i - f$ [Tn , x i ] ∑ n i =1
(2)
The resubstitution error is also termed apparent error in the statistical literature. Many papers of $ statistical models report Err Re sub to be a badly biased downwards estimator of Err [8, 12, 18, 19,
24, 30, 31]. Neural networks can be prone to over-parameterization, especially where data is $ sparse, therefore there is a greater likelihood for neural network Err Re sub to be more seriously
biased downwards.
The resubstitution method is computationally efficient and requires
construction of only one model, which is used for both application and validation. Furthermore, the model utilizes the entire sample of n observations so that the application network is built from 4
the entire set of available data and the validation is over all n. Cross-validation, Group Cross-validation, and Jackknife:
Lachenbruch and Mickey [18] are
$ responsible for the refinement of cross-validation (CV). Err CV is determined by constructing n
models on partitions of all data points of F$ leaving out one (size n-1), and then testing on the single omitted point. The cross-validation estimate is: $ Err CV =
[
1 n ∑ y j - f$ T( j ) , x j n j =1
]
(3)
where j is the excluded point and T (j)={(x1,y1), (x2 y2), ..., (xj-1,yj-1), (xj+1,yj+1),... , (xn,yn)} is the
[
]
data set except point j used to construct the model f$ T( j ) , x j . According to CV, n validation models plus one application model are built.
The application model is built using all n
observations. A computationally less burdensome variation of cross-validation is group crossvalidation (GCV), where (usually) equal-sized groups of data are removed for each validation model, instead of a single observation. If n = GH, then G = total number of groups and H = total number of observations per group. The GCV estimate of Err is: $ Err
GCV
1 = n
G
H
∑∑ y g =1 h =1
( g −1) H + h
[
− f$ T( g ) , x ( g −1) H + h
]
(4)
where g indexes the group left out, and T (g)={(x1,y1), (x2,y2), ..., (x(g-1)H,y(g-1)H), (x(g)H+1,y(g)H+1),... ,
[
]
(xn,yn)} is used to construct the prediction rule f$ Tg , x ( g -1) H + h . G validation networks plus one application network are built. The original work on the jackknife methodology was by Quenouille [22, 26]. It was introduced to reduce the bias of a serial correlation estimator by splitting the data
5
$ is equivalent to the CV method, for all into halves. Since the jackknife method of calculating Err
discussions in this paper the jackknife is considered equivalent to CV2. Bootstrap and Variants: Efron developed the bootstrap method of estimation and showed that it gives the nonparametric maximum likelihood estimate of the excess error of a prediction rule [6, 9]; i.e., the bootstrap corrects for the bias of the resubstitution error. The bootstrap, like CV, is a resampling technique, however it differs in the manner in which F$ is resampled. Bootstrap data sets are created by resampling F$ with replacement, whereas CV resamples F$ without replacement. Bootstrap samples are generated as follows. Let F$ be the empirical distribution function for Tn with mass 1/n on t1, t2, ... , tn; and let Tn* be a random sample of size n taken iid with replacement from F$ , where ti* is a single random observation, ti*=(xi,yi). Thus if an observation is selected twice, probability mass 2/n is assigned to that observation. True error is estimated through independent bootstrap training sets T*1, T*2, ...., T*B; where B is the total number of bootstrap samples, each generated as described above.
For each Tb, a prediction model is
[ ]
constructed, f$ T*b ,xi , built using all n observations. The first term of the bootstrap estimate of Err is the resubstitution error of the application model. The second term is the difference, summed over all bootstrap validation models, between the average error over the original sample and the average error over the bootstrap sample. In other words, this second term subtracts off
2
The jackknife differs from CV is its calculation of resubstitution error of a prediction model.
6
the mean resubstitution error from the mean error over the original sample, using the same bootstrap model. This is repeated B times. $ Err BOOT
=
1 n yi - f$ [Tn , x i ] ∑ n i=1
+
1 B 1 n ∑ ∑ y B b=1 n i =1 i
-
f$ T*b ,x*i −
1 n yi* ∑ n i =1
-
f$ T*b ,x *i (5)
There are a number of variations on the bootstrap. Three variations that are parsimonious in their required number of models were investigated in this research: E0, .632E and .632E′. The E0 [7] estimate of Err is the expected error of those observations not included in the bootstrap sample. Letting A b
=
{i | Pi*b = 0} denote the number of training vectors that do not appear in
the bth bootstrap sample, Err is estimated by averaging over B bootstrap training sets:
[
B
$ Err
∑∑ EO
=
y i - f$ T*b , x i
b=1 A b
∑|
] (6)
Ab |
B
The .632E combines the resubstitution error with the EO error in proportions derived from the expected probability of an observation being included in a given bootstrap sample. Efron [7] reported the .632E estimator to be superior in his experiments. The expected true error is estimated by: B
∧
Err .632E
n
1 = 0.368 * ∑ n i =1
yi -
f$
[T, x i ]
∑∑ + 0.632 *
[
y i - f$ T*b , x i
b=1 A b
∑
] (7)
Ab
B
Efron showed that GCV with G = 2 and E0 are asymptotically equivalent [7] for large n. $ Due to the computational efficiency of using Err GCV(2) as an estimate of E0, a third variation on
the bootstrap, .632E′, was examined.
7
1 n $ Err .632E′ = 0.368 * ∑ y i - f$ [T, x i ] n
+ 0.632 *
i =1
1 n
2
n/ 2
∑∑ g =1 h =1
[
y( g −1) n/ 2+ h − f$ T( g ) , x( g −1) n / 2+ h
]
(8)
B validation models plus one application model (using all n observations) are constructed for all versions of the bootstrap (where B has traditionally ranged upwards of 20) excepting the .632E′ which constructs two validation models plus the application model. Train-and-Test: The most commonly employed method of neural network evaluation is to obtain the estimate of Err from an independent set of data not used to train the model. This method is often referred to as “cross validating the network” and is reported as test set error. In the statistical literature it is called “data splitting.” Given a sample of size n, subdivide it into two sub-samples such that n1 + n2 = n; where one sample, of size of n1, is used for model construction
[
]
f$ Tn1 , x , and one sample, of size n2, is used for validation.3.
$ Err T/T is the error over the
validation set of size n2: $ Err
T/T
1 = n2
n
∑
j= n1 +1
[
y j - f$ Tn1 , x j
]
(9)
Unlike the resubstitution and resampling methods, train-and-test does not utilize all available data in the construction of the application network. Instead it is built on a reduced set of data, n1. Like the resubstitution method, only one model is constructed. The methods just described have been studied in the statistical literature for a number of decades. CV was shown to provide unbiased estimates of Err for linear regression and statistical
3
A variation of this uses a partition of three randomly chosen sets from n, one for training: one for testing the final trained network, and one for testing intermittently during training to prevent over-training.
8
classification problems by several authors [16, 18, 31]. Efron and Gong [6, 7, 9, 12] compared and contrasted the resampling methods on several regression problems involving dichotomous (0, 1) predicted values. According to Efron the methods can give considerably different estimates when applied to practical problems.
CV gives a nearly unbiased estimate of Err but with
unacceptably high variability, especially when n is small.
The ordinary bootstrap gives a
downwardly biased estimate of Err, especially in overfitted situations, but with low variability. Jain et al. [15] compared CV to the ordinary bootstrap and .632E bootstrap for pattern classification. They found that in most cases the bootstrap confidence intervals for the classifier error were narrower than those of CV. As an alternative to the resubstitution method, the trainand-test method has been shown in the statistical literature to provide unbiased estimates of Err for large sample sizes [13, 16, 18]. However when n is not large, the train-and-test method tends $ to give variable and overly pessimistic estimates of Err. When n is small, Err T/T depends heavily
on the partitioning of that data set [16, 31, 32, 40]. In the neural network literature, network models are primarily validated empirically [3, 19]. While many authors have compared various partitioning schemes for train-and-test, there are fewer works that attempt to use more computationally laborious forms of validation. CV and GCV have been suggested for use in evaluating neural network models [2, 4, 14, 20, 25, 38, 40, 42]. Moody [23] proposes a CV variation for nonlinear models which uses the final weights of the application networks as the initial weights of the validation networks. According to Moody, the nonlinear cross-validation (NCV) method provides a more suitable estimate since it is based on the application model. Although the bootstrap has been shown to provide very good estimates of error for statistical models, there are few instances of its use in the neural network literature. Recently Ankenbrand and Tomassini applied the bootstrap to a financial application [1], and
9
Lippman, et al. [21] and Huston et al. [14] utilized the bootstrap to evaluate networks built for medical applications. There has been some interest in the bootstrap as a method to construct network confidence intervals, and as a method to improve network generalization [17, 35, 36]. This paper provides a thorough and systematic analysis of four general methods for neural network validation. Specifically, resubstitution, various partitions for train-and-test, CV with various group sizes, the ordinary bootstrap with various B, and three bootstrap versions are compared for a simple function approximation problem under three levels of data sparseness. Several comparisons are pertinent: bias of the validation method, variance of the validation method, accuracy of the application network and computational effort.
Additionally, the
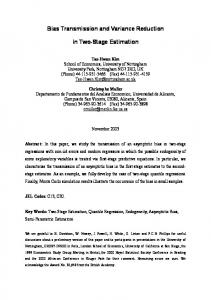
validation errors of the alternative approaches are partitioned into bias and variance components. While the results hereafter pertain to the function approximation problem, the results are consistent with those in the statistical literature and with other problems examined by the authors [14, 33, 34, 36, 37]. 3. EXPERIMENTAL METHOD A function approximation problem, also studied by Geman et al. [11], Efron [10] and Wahba and Wold [39], was used to examine and compare in detail the performance of the validation methods applied to neural network prediction models. All networks were trained to predict y given x, y = 4.26( e − x − 4e −2 x + 3e −3x )
(10)
where x ranges from 0.0 to 3.10, as shown in Figure 1. This function was chosen because it has been previously studied in the statistical validation literature, its small size enabled the many computational experiments required, and its nonlinearity makes it a typical “difficult” function.
10
3.1 Experimental Design A single experiment, or trial, proceeds as follows. One random sample, Tn, is generated, where Tn is the data set of n input/output pairs independently randomly sampled from the population F defined by the domain of the function to be approximated (equation 10).
Tn
represents the total sample available for building and evaluating the neural network. To eliminate effects of the exact sample chosen in any single trial, 100 trials were conducted and these 100 Tn were used to examine the performance of the validation methodologies. The train-and-test method included four levels of how n is partitioned for training and testing (Table 1) and GVC varied on the number of groups G (Table 2). Three levels of total sample available were used, n = 5, 10 and 20. Therefore, the single research trial just described is repeated for each level of sample size. A network trained on 5 observations may be considered excessively small; however since equation 10 is a univariate function, n = 5 is the minimal acceptable sample size. 3.2 Methods of Assessment To remove dependence on sampling for both training and testing, a single trial was replicated 100 times as stated above; Tnk is a single realization of the random sample, and k = 1 to 100. In other words, for each of the three levels of n, 100 iid samples were pulled from F. The performance of the validation methodologies was evaluated and compared on several measures using these 100 Tnk . The first performance measure is the prediction accuracy of the application network, where the true error, Err, of a single application network is approximated from N = 5000 independent randomly chosen observations, i.e., a separate set of 5000 was chosen to calculate the prediction error over the population F. The expected value of Err over the 100 samples drawn from F is given in equation 11. 11
E( Err) =
1 100 ∑ 100 k =1
1 5000 yi - f$ [Tk , x i ] ∑ 5000 i=1
(11)
The variance of Err measures the sensitivity of the prediction performance of a network to the sample used to construct it, and is calculated over the 100 samples by:
V(Err) =
1 100 ∑ 100 k =1
(Err − E(Err ))
2
k
(12)
An informative measure of a validation method’s performance is the mean squared error (MSE) of $ , which pairs each Err $ Err k with its corresponding Errk. The MSE approximates the expected $ conditional disparity between Err k and Errk. The relevant equations are:
SE k = (Eˆ rrk − Errk ) 2
MSE =
1 100 ∑ SE k 100 k =1
(13) (14)
The variance of SE over the 100 networks is given by:
V(SE) =
1 100 (SE k − MSE)2 ∑ 100 k =1
(15)
Of practical interest to the modeler is the probability that the error estimate of an individual $ network ( Err k ) will underestimate the true error of that network (Errk). This is approximated by:
$ P(Err
1 < Err) = 100
100
∑
Ik
$ [ if (Err k < Errk ) I k = 1; o.w. I k = 0 ]
k =1
(16)
3.3 Network Architecture and Training Prior to actual experimentation, network architecture, training parameters and stopping criteria were selected through experimentation and examination of networks trained on twenty independent samples Tn, at each level of n. The network architecture used was a multi-layered
12
fully connected perceptron with one input neuron (x), one hidden layer with three neurons and one output neuron (y).
The transfer function was the unipolar sigmoid, and a traditional
backpropagation learning algorithm [28, 41] was used with the learning rate = 0.1 and the momentum (smoothing) factor = 0.9. All networks were initialized to the same set of random weights between ±0.5. Network training ceased when mean weight change was below a given threshold (0.01) for 1000 generations. This termination approach was selected because it permits the evaluation of each validation method without the confounding effects of network termination by training set error or by testing set error. 4. RESULTS This section begins with an analysis of the performance of the application networks. It continues with results of each method in estimating Err, both in terms of expected value (bias) and variability (variance). 4.1 Application Network Performance Recall that the application network is the network constructed to be operational, that is, the outcome of the construction and validation effort. For the train-and-test method this network is constructed on the partition n1 of the total sample, Tn, available. Therefore, the partitioning of Tn into the training sample, n1, and the testing sample, n2, may profoundly affect the performance of the application network.
For resubstitution and the resampling methods, the application
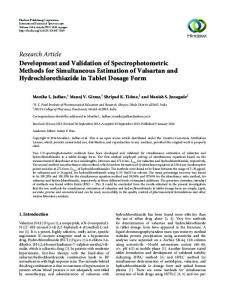
network is constructed on the entire sample, Tn, which is of size n. Therefore the application networks of all of these methods are identical. Table 3 displays the expected Err and variance of Err over the 100 samples of each sample size, n = 5, 10, and 20. These are calculated using equations 11 and 12 for the set of 5000 that represent the population F. Figure 2 plots the expected Err vs. percentage of n used to construct 13
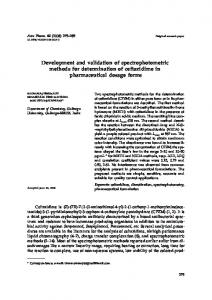
the application network. As anticipated, increasing a network’s construction set size improves performance. Also shown in Figure 2, is the variability of Err vs. percentage of total available sample used for training purposes. The plots reveal substantial increases in the variance of Err as the training set size decreases. The large variability in Err results from the network’s sensitivity to the composition of small training sets; i.e. when n is small, the Err of a network is greatly dependent upon which observations are chosen to make up the training set. Figure 3 shows the combination of Err and variance of Err for each application network. An ideal network would lie in the lower left corner (low error and low variability). It can be seen that larger sample sizes move the application networks toward the origin, while the application networks built using the entire sample (all but the train-and-test method) are the best networks for each value of n. To summarize these results, performance degrades and variability of performance increases as the size of the sample used to construct the application network decreases. These effects are seen most acutely in the sparser data sets. 4.2 Estimation of Err This section considers the performance of the validation methods in estimating Err, and the variability of that estimate across the 100 samples at each sample size. Recall that the $ ) is given by equations 2 (resubstitution), 3-4 (cross-validation estimate of true error ( Err
approaches), 5-8 (bootstrap and variations) and 9 (train-and-test). An ideal validation method $ $ ) (be insensitive would have Err equal to Err on average (be unbiased) and have minimal V( Err
to the exact sample chosen to estimate Err). $ $ Table 4 provides expected Err and variance of Err for n = 5, 10 and 20 for the most
14
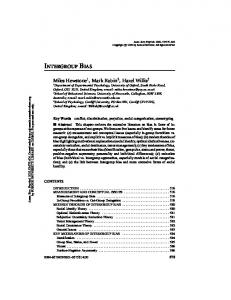
typical versions of the validation methods. These are resubstitution, CV, two fold GCV4, trainand-test with 75% for training and 25% for testing, and the ordinary bootstrap at B = 20. For comparison, the expected Err over the population set of 5000 is also provided. The last column is the probability of underestimation of true error from equation 16. An unbiased validation method would have this value equal to 0.50. Table 4 confirms the hypothesized results. As sample size, n, increases, both the error of validation and the variance of the validation estimate decrease. The resubstitution method is badly biased downwards, but has low variability. The train-and-test method is highly variable compared to all other methods and is biased upwards. CV is more precise and less variable than GCV, however this comes at a computational cost. The two fold creates only 2 validation models, while the non-group version creates 5, 10 and 20 validation models, respectively, for each sample size. Both versions of CV are relatively unbiased. The bootstrap requires 20 validation models, but results in less variance than CV. However, the bootstrap is biased downwards, though not nearly as severely as the resubstitution method. 4.3 Detailed Examination of Results for Train-and-Test and Cross-Validation Figure 4 shows the MSE (as calculated using equation 14) and 95% confidence intervals (C.I.) for MSE given by the train-and-test method under different partitions. The C.I. are formed by:
4
A “fold” for cross validation or jackknife refers to the number of groups, G, created for each sample. For example, a two fold for n = 10, would involve 2 validation models with a group size of 5 each. A five fold for n = 100, involves 5 validation models with a group size of 20 each.
15
V(SE) MSE ± z α 100 2
(17)
where MSE is from equation 14 and V(SE) is from equation 15. For 95% C.I., α = 0.05 and z1-α/2 = 1.96. Note that all figures showing MSE confidence intervals have a truncated y axis since each confidence interval is symmetric. As n increases, the estimate is better and less variable. An interesting result is that the 90%/10% split yields highly variable estimates.
This split is
commonly found in the neural network literature, however it appears that a 10% test set for small sample sizes is inadequate for model validation. Table 5 shows details of the cross-validation for different grouping strategies. Clearly the non-grouped cross-validation has superior results; however given the trade off in computational effort, the grouped versions are fairly effective. Figure 5 highlights this by examining the 95% MSE C.I. for sample sizes of 10 and 20. For n = 20, hardly anything is lost by going from nongrouped (20 validation networks) to a two fold approach (2 validation networks). This is an order of magnitude reduction in computational effort. However, for smaller sample sizes more groups are clearly better. 4.4 Comparison of Bootstrap Versions The results of the ordinary bootstrap are presented in Table 6 for levels of bootstrap samples, B = 1, 2, 5, 10, 20, 50, 60 and 100. Almost counter-intuitively, the results do not $ $ indicate improved accuracy of Err with an increase in B. The improvement in Err with an BOOT $ increase in B is shown only in the reduction in variability. Err underestimates the true Err BOOT
(shown under each sample size) at all levels of B (consistent with Efron’s findings [7]), to a greater extent for smaller sample sizes.
16
The results on bootstrap variations E0, .632E, and .632E′ are provided in Table 7, along with the ordinary bootstrap results. The ordinary bootstrap, E0 and .632E are at B = 205. For comparison, the expected true error (as calculated over the population of 5000) are 0.0874 (n = 5), 0.0551 (n = 10), and 0.0389 (n = 20). Table 7 shows that the .632E and .632E′ versions correct the downwards bias of the ordinary bootstrap. The EO actually over-corrects and results in an upwardly biased estimator. The best performing estimator, considering both variability and bias, is the .632E. The .632E′ also does well considering the order of magnitude reduction in computational effort. 4.5 Validation Methods Compared at the Same Level of Sample Size This section focuses on comparing the validation methods in terms of MSE at the same level of n as shown in Figure 6. The vehicle for comparison is the 95% C.I. of MSE as given by equation 17. Note that the scales change between graphs A, B and C because of the effect of sample size. The train-and-test method produces the most variable estimates regardless of sample size, with extremely high variability using a small testing set (90%/10% split). As indicated earlier, this is worrisome because this is a typical validation strategy in the neural network literature. The resubstitution method has low variance, but is more biased for small samples. All resampling methods have low variance and good performance, except for the two fold GCV. These results must be considered in conjunction with the performance of the application network (discussed in Section 4.1), where inferior application networks resulted from the train-and-test
5
Recall that the .632E′ method requires only two validation networks.
17
method. Turning to comparison of computational effort, both the train-and-test and the resubstitution methods require the construction of only one network.
CV requires the
construction of n+1 networks, while GCV requires G+1. The bootstrap methods (except for .632E′) require B+1 networks. Choosing the number of validation networks for the bootstrap is a decision that can be made a priori or iteratively by the analyst. In this case, B = 20 gives low variability, and it is also the lower bound recommended by Efron. The .632E′ method uses the two fold GCV to estimate the error on data not included in the construction sample, and requires two validation networks plus an application network. It is slightly more variable and more biased than the .632E, but when considering the order of magnitude computational reduction, the .632E′ appears quite promising as a practical neural network validation method. 5. DECOMPOSING THE ERROR OF THE ESTIMATE INTO BIAS AND VARIANCE Nonparametric estimators, such as neural networks, tend to be highly variable, whereas parametric estimators tend be biased. For small data sets, nonparametric estimators may be too sensitive to the chosen data sample, leading to increased variance. There is a bias-variance trade off; i.e., the decrease in one may cause an increase in the other. Research in estimation theory aims to achieve an estimator with the lowest possible MSE. The decomposition of MSE into bias and variance is useful to determine which term contributes the most. Once established, the effort to reduce MSE will focus on that particular term, or as an alternative, will seek to increase a $ , Err)). positive covariance term (cov( Err
The general expression for MSE is expanded to
$ explicitly consider the two components of the difference between Err and Err, viz. bias and
variance, by:
18
MSE = Bias 2 + Variance
(18)
where the squared bias of the estimate is given by: 100
Bias2 =
∑ (Eˆ rr
k
k =1
− Errk ) 2 (19)
100
and the variance is given by:
∑ (Eˆrr
V(Eˆrr − Err) =
) ∑ (Err 2
100
k
− E(Eˆrr )
k =1
100
2
100
+
k
k =1
− E(Err ) )
100
((
)
)
100 ˆ ∑ Errk − E(Eˆ rr ) (Errk − E(Err ) ) (20) − 2 k =1 100
where the last term is twice the covariance between the estimate of Err and Err itself for each of the k networks. $ The bias term is a measure of how well Err performs as an estimator of Err; i.e. bias is
due to an inappropriate formulation of the estimate. The variance of the estimate, V( Eˆ rr) , measures the stability of the estimate of true error over all realizations of the training set Tnk . The variance of Err, V(Err), measures the stability of the actual true error over the same Tnk . The $ ,Err)) is a measure of how the estimate and the true error vary covariance term (-2cov ( Err
together for each training sample. Figures 7 through 9 show the decomposition by terms for the validation methodologies for the sample sizes 5, 10 and 20, respectively. The two components from equation 18 are shown in bold, dashed for the bias2 term and solid for the variance term. The three terms which sum to the variance, given in equation 20, are shown, with the variance of the estimate dashed, the variance of the true error solid and the covariance term shaded. Please note that the scales on the three graphs are not identical both bias and variance decrease with an increase in sample size and
19
that zero is located at the midpoint of each axis. This is due to the negative value of the covariance term. The graphs are a succinct way to examine the relative magnitudes of the components that make up the MSE of the estimate. The train-and-test versions are the most variable, with the two fold GCV the second most variable. The covariance term is negative for the train-and-test, indicating a positive correlation between the error estimate and the true error across the 100 data samples. The variance of the true error is identical (and minimal) for all methods except the train-and-test. It can be viewed as a lower bound of total variance, as the variance of the true error depends only on the sample size used to construct the application network (where the method of model construction was held constant). For the train-and-test, true error is most variable for the 25/75 split because this version reduces the training set by 75%, resulting in a highly variable application network. As this construction sample grows larger, the dependency of the application network on the sample reduces, evidenced by reduced variability of the true error. Figures 10 through 12 show the relative contributions of the terms of equation 18 to MSE for each sample size, along with the MSE located on top of each histogram. It is clear that the resubstitution method is the only one to contain substantial bias, relative to the total MSE. $ ) is the main component of MSE for CV, GCV and the train-and-test methods. This V( Err
indicates that these methods are more dependent on the sample used for network construction and validation. The bootstrap’s main contributor to MSE is the variability of the true error itself, which cannot be avoided, as the performance of predictive models for the population will always be dependent on the sample used to construct the model, especially for small n. Only an increase in n will reduce this variability. Also note that the value of MSE for each method is at top of the histograms, and the bootstrap is clearly the smallest.
20
The train-and-test methods offset some of the variability of the estimate by a positive covariance between the true error and the estimate of true error.
Counter-intuitively, the
$ correlation between Err and Err for bootstrap and CV were generally negative. These results are
consistent with Efron’s results [7], who states there is no way to ensure a positive correlation for statistical prediction models, but the improvement exhibited by the .632E method is a consequence of driving the correlation to zero. 6. CONCLUSIONS Based on the investigations of this paper and supported by further investigations by the authors [14, 33, 34, 36, 37], Table 8 has been assembled to offer general guidance in selecting a validation method for supervised neural network models. The table gives simplified, but succinct, information concerning these methods. The analyst can trade off the desired accuracy in the estimate of Err and the predictive accuracy of the application network with the computational effort allowed. There are several standards that should be adopted by all neural network analysts when faced with constrained amounts of data. First, use the entire sample, n, to construct the final application network. Assuming a valid sample, a network constructed on more data will generally be superior to one constructed on less data. Second, the success of the traditional train-and-test validation using nearly all the sample for training (e.g. 90%) is highly dependent on the small number of observations left in the test set. This variability creates risk for the neural network builder and user. Third, the traditional resampling techniques bootstrap, jackknife and CV as enacted by the statistical community may be computationally impractical for the neural network community. The less computationally intensive versions of these GCV and .632E′ offer an attractive trade off. They lose little in the way of variability and bias, but reduce the number of 21
prediction models by order(s) of magnitude. The .632E′ appears particularly encouraging as a reasonable and effective procedure to validate neural network predictive models. Finally, validation is a crucial part to the development of a sound empirical model. Neural networks will not realize their full potential in solving real problems until users are assured that the models will operate as intended. This can only be accomplished through validation. For large samples, validation will be adequate regardless of the method used, however for small samples, the validation approach can result in drastically different application networks and estimates of performance. There are a number of extensions to the investigations reported herein. The experiments performed maintained the same architecture, initial weight set, training algorithm and parameters, and termination criterion to avoid confounding with the validation results. Research considering the effects of alterations in network construction and the validation methods would be beneficial. For example, validation might be more robust over different sets of initial random weights. Another important aspect for further research is to consider alternative data sampling methodologies, including imperfect sampling. This paper employed iid sampling (i.e., random uniform sampling over the data set available), however there are many instances when the neural network analyst will deliberately select a sample for training or validation using a design of experiments or problem-specific knowledge. There are also instances when sampling is imperfect (biased) either by choice or by happenstance.
The influence of sampling on the validation
methods is a second important area of further study.
A third extension concerns pattern
classification models, which have inherently different error metrics than function approximation models.
Investigating the use of resampling methods for validation of classification neural
networks may yield differing conclusions. 22
ACKNOWLEDGMENTS The first author acknowledges the support of an NSF EPSCoR First Award. The second author gratefully acknowledges the support of NSF CAREER grant DMI 9502134.
23
References [1] Ankenbrandm, T. and M. Tomassini (1996) “Predicting multivariate finical time series using neural networks: The Swiss bond case,” Proceedings of the IEE/IAFE 1996 Conference on Computational Intelligence for Financial Engineering, New York, NY: IEEE Press, 27-33. [2] Ben Brahim, S., A. E. Smith and B. Bidanda (1993) “Relating product specifications and performance data with a neural network model for design improvement,” Journal of Intelligent Manufacturing, 4, 367-374. [3] Burke, L. (1993) “Assessing a neural net: Validation procedures,” PC AI, March/April, 2024. [4] Cheng, B. and D. M. Titterington (1994) “Neural networks: A review from a statistical perspective,” Statistical Science, 9, 2-54. [5] Cherkassky, V., J. H. Friedman, and H. Wechsler (Eds.) (1994) From Statistics to Neural Networks: Theory and Pattern Recognition Applications. (NATO ASI Series) New York, NY: Springer-Verlag. [6] Efron, B. (1982) The Jackknife, the Bootstrap, and Other Resampling Plans. SIAM NSFCBMS Monograph, 38. [7] Efron, B. (1983) “Estimating the error rate of a prediction rule: Improvement over crossvalidation,” Journal of the American Statistical Association, 78, 316-331. [8] Efron, B. (1986) “How biased is the apparent error rate of the prediction rule?” American Statistical Association, 81, 461-470. [9] Efron, B. and R. Tibshirani (1986) “Bootstrap methods for standard errors, confidence intervals, and other measures of statistical accuracy,” Statistical Science, 1, 54-77. [10] Efron, B. (1979) “Computers and the theory of statistics: Thinking the unthinkable,” SIAM Review: Society for Industrial and Applied Mathematics, 21, 460-480. [11] Geman, S., E. Bienenstock and R. Doursat (1992) “Neural networks and the bias/variance dilemma,” Neural Computation, 4, 1-58. [12] Gong, G. (1986) “Cross-validation, the jackknife, and the bootstrap: Excess error estimation in forward logistic regression,” Journal of the American Statistical Association, 81, 108-113. [13] Highleyman, W. (1962) “The design and analysis of pattern recognition experiments,” The Bell System Technical Journal, 41, 723-744. [14] Huston, T. L., A. E. Smith and J. M. Twomey (1994) “Artificial neural networks as an aid to medical decision making: Comparing a statistical resampling technique with the train-andtest technique for validation of sparse data sets,” Artificial Intelligence in Medicine: Interpreting Clinical Data, AAAI Press Technical Report SS-94-01, 70-73. [15] Jain, A. K., R. C. Dubes and C. Chen (1987) “Bootstrap techniques for error estimation,” IEEE Transactions on Pattern Analysis and Machine Intelligence, PAMI-9, 628-633. [16] Kanal, L. and B. Chandrasekaran (1971) “On the dimensionally and sample size in statistical 24
pattern classification,” Pattern Recognition, 3, 225-234. [17] Kindermann, J., G. Paass and F. Weber (1995) “Query construction for neural networks using the bootstrap,” International Conference on Artificial Neural Networks ‘95, 2, 135140. [18] Lachenbruch, P. and M. Mickey (1968) “Estimation of error rates in discriminant analysis,” Technometrics, 10, 1-11. [19] Larsen, L. E., D. O. Walter, J. J. McNew and W. R. Adey (1970) “On the problem of bias in error rate estimation for discriminant analysis,” Pattern Recognition, 3, 217-223. [20] Lawrence, J. (1991) “Data preparation for a neural network,” AI Expert, 11, 34-41. [21] Lippmann, R. P., L. Kukolich and D. Shahian (1994) “Predicting the risk of complications in coronary artery bypass operations using neural networks,” in G. Tesauro, D. Touretzky and T. Leen (editors) Advances in Neural Information Processing Systems 7, Cambridge, MA: MIT Press. [22] Miller, R.G. (1974) “The Jackknife - a review,” Biometrika, 61, 1-15. [23] Moody, J. (1994) “Prediction risk and architecture selection for neural networks,” in V. Cherkassky, J.H. Friedman, and H. Wechser (editors) From Statistics to Neural Networks: Theory and Pattern Recognition Applications. (NATO ASI Series) New York, NY: SpringerVerlag. [24] Mosier, C. I. (1951) “Symposium: The need and the means of cross-validation. I. Problems and design of cross-validation,” Education and Psychological Measurement, 11, 511. [25] Nivelle, F., V. Rouy and P. Vergnaud (1993) “Optimal design of neural networks using resampling methods,” Proceedings of the Sixth International Conference on Neural Networks and Their Industrial and Cognitive Applications, 95-106. [26] Quenouille, M. (1949) “Approximate tests of correlation in time series,” Journal of the Royal Statistical Society Series B, 11, 18-84. [27] Ripley, B. D. (1994) “Flexible non-linear approaches to classification,” in V. Cherkassky, J.H. Friedman, and H. Wechler (Eds.) From Statistics to Neural Networks: Theory and Pattern Recognition Applications. (NATO ASI Series) New York, NY: Springer-Verlag. [28] Rumelhart, D. E., G. E. Hinton and R. J. Williams (1986). “Learning internal representations by error propagation,” in Parallel Distributed Processing: Explorations in the Microstructure of Cognition, Vol. 1: Foundations. D. E. Rumelhart and J. L. McClelland, and the PDP group, editors, MIT Press, Cambridge, MA, 318-362. [29] Smith, C. A. B. (1947) “Some examples of discrimination,” Annals of Eugenics, 18, 272278. [30] Snee, R. D. (1977) “Validation of regression models: Technometrics, 19, 415-428.
Methods and examples,”
[31] Stone, M. (1974) “Cross-validatory choice and the assessment of statistical predictions,” Journal of the Royal Statistical Society Series B, 36, 111-147. 25
[32] Toussaint, G.T, (1974) “Bibliography on estimation of misclassification,” IEEE Transactions on Information Theory, 20, 472-479. [33] Twomey, J. M. (1995) Nonparametric Error Estimation Methods For Validating Artificial Neural Networks, unpublished Ph.D. Dissertation, Department of Industrial Engineering, University of Pittsburgh. [34] Twomey, J. M. and A. E. Smith (1993) “Nonparametric error estimation methods for validating artificial neural networks,” Intelligent Engineering Systems Through Artificial Neural Networks, Volume 3, (C. H. Dagli, L. I. Burke, B. R. Fernandez, J. Ghosh, editors), ASME Press, 233-238. [35] Twomey, J. M. and A. E. Smith (1995) “Committee networks by resampling,” Intelligent Engineering Systems Through Artificial Neural Networks, Volume 5 (C. H. Dagli, M. Akay, C. L. P. Chen, B. R. Fernandez and J. Ghosh, editors), ASME Press, 153-158. [36] Twomey, J. M. and Smith, A. E. (1996) “Artificial neural network approach to the control of a wave soldering process,” Intelligent Engineering Systems Through Artificial Neural Networks, Volume 6, ASME Press, 889-894. [37] Twomey, J. M. and Smith, A. E. (1997) “Validation and Verification,” in Artificial Neural Networks for Civil Engineers: Fundamentals and Applications (N. Kartam, I. Flood and J. H. Garrett, editors), ASCE Press, New York, 44-64. [38] Twomey, J. M., A. E. Smith and M. S. Redfern (1995) “A predictive model for slip resistance using artificial neural networks,” IIE Transactions, 27, 374-381. [39] Wahba, G. and S. Wold (1975) “A completely automatic French curve: Fitting spline functions by regression by cross-validation,” Communications in Statistics Series A, 4, 1-17. [40] Weiss, S. M. and C. A. Kulikowski (1991) Computer Systems that Learn. Morgan Kaufmann Publishers, Inc., San Mateo, CA. [41] Werbos, P.J. (1974) Beyond Regression: New Tools for Prediction and Analysis in the Behavioral Sciences, unpublished Ph.D. Dissertation, Harvard University. [42] White, H. (1990) “Connectionist nonparametric regression: Multilayer feedforward networks can learn arbitrary mappings,” Neural Networks, 3, 535-549.
26
0.8 0.4 0 Y -0.4 -0.8 -1.2 -1.6 0
1
2
3
X
Figure 1. Function Approximation Problem.
27
0.01
0.18 E(Err) V(Err)
0.008
Expected Error
0.12 0.006 0.09 0.004 0.06
Variance of Expected Error
0.15
0.002 0.03
0
0 5 5 5 5 10 10 10 10 10 20 20 20 20 20 all T/T T/T T/T all T/T T/T T/T T/T all T/T T/T T/T T/T others 90/10 75/25 25/75 others 90/10 75/25 50/50 25/75 others 90/10 75/25 50/50 25/75
n /Method/%Train/Test
Figure 2. Expected Error and Its Variance of Application Networks.
28
0.01
0.008
0.006 Variance 0.004 Constructed Using Entire Sample
n=5 n=10
0.002
n=20
0 0
0.03
0.06
0.09 Expected Error
0.12
0.15
0.18
Figure 3. Variance vs. Expected Error of Application Networks.
29
0.025
n =5
n = 20
n = 10
0.020
0.015
MSE 0.010
0.005
0.000
90/10 75/25
25/75
90/10 75/25
50/50
25/75
90/10
75/25
50/50
25/75
$ Figure 4. 95% C.I. for the MSE of Err T/T.
30
0.005
n = 10
n = 20
0.004
0.003
MSE 0.002
0.001
0
2
5
10
Number of Groups
2
5
10
20
Figure 5. 95% Confidence Intervals for Different Number of Groups in GCV.
31
0.03
0.02
MSE 0.01
0.00
90/10
75/25
G=2
25/75
T/T
RESUB
G=5
ORDINARY EO
.632E
.632E’
BOOTSTRAP (B =20)
GCV
A. n = 5. 0.015
0.010
MSE 0.005
0.000
90/10 75/25 50/50 25/75
T/T
G=2
G=5
G=10
ORDINARY EO
.632E .632E’
BOOTSTRAP (B =20)
GCV
RESUB
B. n = 10. 0.006
0.004
MSE 0.002
0.000
90/10 75/25 50/50 25/75
T/T
G=2
RESUB
G=5
G=10 G=20
GCV
ORDINARY EO
.632E .632E’
BOOTSTRAP (B =20)
C. n = 20. Figure 6. 95% Confidence Intervals for the Validation Methods.
32
RESUB 0.03
BIAS2 var(est )
0.015 T/T 25/75
var(Err)
CV
-2cov
0
Tot var -0.015 -0.03 T/T 75/25
GCV(2)
T/T 90/10
BOOT(20)
$ Figure 7. Components of MSE of Err for n = 5.
33
RESUB 0.015 T/T 25/75
0.01
BIAS2 var(est ) CV
var(Err)
0.005
T/T 50/50
0
-2cov
-0.005
Tot var GCV(2)
-0.01 -0.015
T/T 75/25
GCV(5)
T/T 90/10
BOOT(20)
$ Figure 8. Components of MSE of Err for n = 10.
34
RESUB 0.008 T/T 25/75
BIAS2 var(est ) CV
var(Err)
0.004
-2cov 0 T/T 50/50
Tot var GCV(2)
-0.004 -0.008
T/T 75/25
GCV(5)
T/T 90/10
GCV(10) BOOT(20)
$ Figure 9. Components of MSE of Err for n = 20.
35
0.0140
0.0109
0.0228
0.0052
0.0240
0.0225
100%
0.0164 -2cov var(Err)
80%
Contribution to MSE
var(est ) BIAS2
60%
40%
20%
0%
Method -20%
-40% RESUB
CV
GCV(2)
BOOT(20)
T/T 90/10
T/T 75/25
T/T 25/75
Figure 10. Relative Contribution of Bias and Variance Terms to MSE for n = 5.
36
0.00153
0.00140
0.00424
0.00167
0.00067
0.01428
0.00307
0.00579
0.00634
100%
-2cov var(Err) var(est )
80%
BIAS2
Contribution to MSE
60%
40%
20%
0%
Method
-20%
-40% RESUB
CV
GCV(2)
GCV(5)
BOOT(20)
T/T 90/10
T/T 75/25
T/T 50/50
T/T 25/75
Figure 11. Relative Contribution of Bias and Variance Terms to MSE for n = 10.
37
0.0006
0.0006
0.0013
0.0007
0.0007
0.0004
0.0053
0.0013
0.0009
0.0010
100%
80%
Contribution to MSE
60%
40%
20%
0%
-20%
-2cov var(Err)
-40%
Method
var(est ) BIAS2
-60% RESUB
CV
GCV(2)
GCV(5)
GCV(10) BOOT(20) T/T 90/10
T/T 75/25 T/T 50/50
T/T 25/75
Figure 12. Relative Contribution of Bias and Variance Terms to MSE for n = 20.
38
Table 1. Variations of Train-And-Test.
Levels of Sample Size
Levels of Train/Test (% train / % test) (90/10)* n=5 (75/25)* (25/75)* (90/10) n = 10 (75/25)+ (50/50) (25/75)+ (90/10) n = 20 (75/25) (50/50) (25/75) * Actual % train/% test is (80/20) (60/40) and (40/60) + actual % train/% test is (70/30) and (30/70)
39
Table 2. Variations of the Group Cross-Validation.
Levels of Sample Size n=5 n = 10 n = 20
Levels of Groups 2 groups GCV (3 train & 2 test) 2 groups GCV (5 obs./grp) 5 groups GCV (2 obs./grp) 2 groups GCV (10 obs./grp) 5 groups GCV (4 obs./grp) 10 groups GCV (2 obs./grp)
40
Table 3. True Error of Application Networks Over 100 Samples on Population F of 5000.
Sample Size 5
10
20
Method Resubstitution, CV, GCV, Bootstrap T/T (90/10) T/T (75/25) T/T (25/75) Resubstitution, CV, GCV, Bootstrap T/T (90/10) T/T (75/25) T/T (50/50) T/T (25/75) Resubstitution, CV, GCV, Bootstrap T/T (90/10) T/T (75/25) T/T (50/50) T/T (25/75)
E(Err) 0.0874 0.1032 0.1367 0.1764 0.0551 0.0577 0.0672 0.0880 0.1348 0.0389 0.0413 0.0475 0.0589 0.0962
V(Err) 0.0033 0.0051 0.0073 0.0100 0.0002 0.0003 0.0013 0.0038 0.0061 0.0002 0.0002 0.0003 0.0003 0.0042
41
Table 4. Error of Validation for Typical Methods. Method Resubstitution
CV
GCV - 2 Fold
Train-and-Test (75%/25%)
Bootstrap - B = 20
n
E(Err)
5 10 20 5 10 20 5 10 20 5 10 20 5 10 20
0.0874 0.0551 0.0389 0.0874 0.0551 0.0389 0.0874 0.0551 0.0389 0.1367 0.0672 0.0475 0.0874 0.0551 0.0389
$ ) E( Err 0.0157 0.0200 0.0197 0.1047 0.0577 0.0415 0.1336 0.0605 0.0426 0.1423 0.0640 0.0499 0.0605 0.0420 0.0326
$ ) V( Err 0.0001 0.0001 0.0002 0.0067 0.0014 0.0003 0.0181 0.0016 0.0004 0.0325 0.0046 0.0016 0.0011 0.0004 0.0001
$