If big data appli- cations can be deployed in virtual machines throughout a data center, they can easily make use of spare CPU, memory, and IO capacity for ...
Big Data in the Background: Maximizing Productivity while Minimizing Virtual Machine Interference Wei Zhang Beihang University The George Washington University
Abstract Despite the use of virtualization to share individual servers, data centers are still often only lightly loaded, leaving large amounts of spare capacity idle. In some ways, Big Data applications are an ideal fit for using this excess capacity to perform meaningful work, yet the high level of interference between interactive and batch processing workloads currently prevents this from being a practical solution in virtualized environments. In this paper we study both the amount of spare capacity that could potentially be used for Big Data processing, and the limitations of current interference isolation techniques. Within our university data center we find that an average of 90%, 53%, and 89% of CPU, memory, and disk IO capacity are left idle; an analysis of Wikipedia’s 137 application servers shows similar results. We then evaluate the impact of colocating a Hadoop VM with an interactive website, and find that median web server response time can increase by over seven times. Finally, we propose how scheduling mechanisms in both the virtualization layer and the Hadoop job tracker could be enhanced to improve this situation.
1
Introduction
Virtualization has facilitated the growth of infrastructure cloud services by allowing a single server to be shared by multiple customers. Dividing a server into multiple virtual machines (VMs) provides both a convenient management abstraction and resource boundaries between users. However, the performance isolation provided by virtualization software is not perfect, and interference between guest VMs remains a challenge. This is particularly true for IO intensive virtual machines, since accesses to the underlying devices needs to be mediated by the hypervisor. If the hypervisor does not enforce proper priorities among guests, it is easy for one virtual machine’s performance to suffer due to another guest. Despite the danger of interference, resource sharing through virtualization has been crucial for lowering the
Sundaresan Rajasekaran and Timothy Wood The George Washington University
cost of cloud computing services. Multiplexing servers allows for higher average utilization of each machine, giving more profit for a given level of hardware expense. Yet the reality is that many data centers, even those employing virtualization, are still unable to fully utilize each server. This is due in part to fears that if a data center is kept fully utilized there will be no spare capacity if workloads rise, and part due to the risk of VM interference hurting performance even if servers are left underloaded. In this paper we investigate the level of load in current data center environments and explore how data center utilization can be safely increased, despite workload fluctuations and the danger of interfering virtual machines. Our belief is that many big data applications are an ideal fit for consuming spare data center capacity due to their resource hungry, distributed nature. If big data applications can be deployed in virtual machines throughout a data center, they can easily make use of spare CPU, memory, and IO capacity for productive work. Since many big data frameworks such as MapReduce are already designed for distributed workloads, jobs can be easily spread across the data center. Further, the fault tolerance capabilities of these frameworks can automatically handle the case where a big data VM needs to be shutdown, perhaps because it is consuming too many resources on a server that now needs that capacity to service a rising workload. Despite these potential benefits, there are several important challenges that prevent big data applications from being used today to quickly fill data center capacity. The first challenge is that deploying big data applications can cause significant interference to other data center applications such as web servers. MapReduce’s IO and CPU intensive nature can cause dramatic performance degradation for interactive applications; our measurements show that web server response times can increase by seven times due to colocated Hadoop tasks, even when scheduling parameters are used to reduce the big data application’s priority. The second key challenge, is that 1
1 75th percentile 50th percentile 25th percentile
20
0.8 CDF
% CPU Utilization
30
10
0.6 Network Disk CPU Memory
0.4 0.2
0
0 0
10
20
30 40 Time (days)
50
60
0
20
40 60 % Utilization
80
100
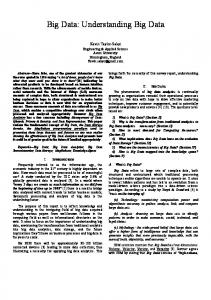
Figure 1: While resource consumption varies over time, at least 75% of the IT servers consistently use less than 20% of their total CPU capacity.
Figure 2: Servers used to host VMs for our IT department illustrate that many resources are often left idle; memory is the only resource with a median utilization level above 50%.
even if Hadoop tasks could be run without interference, the variability in resources available to them is known to cause a reduction in overall performance due to speculative job scheduling. We believe that combating these two challenges will require work at both the hypervisor layer to reduce interference and at the task scheduling level to ensure that big data applications can still receive some performance guarantees.
sources, and often is not the main bottleneck. We next plot a CDF of the utilization of CPU, Memory, Network, and Disk in Figure 2. This data confirms that CPU is lightly utilized, but also shows that network and disk see relatively low loads as well. In contrast, memory is reasonably well utilized in this cluster, with about half of the servers using 50% or more of their total RAM. We believe the low utilization across this cluster is due in part to our IT department purposely overprovisioning resources, and partly because the cluster is sized to meet future needs. However, these scenarios seem very common from anecdotal evidence, and suggests that there is a great deal of capacity of all resource types that is being wasted in many data centers, even virtualized ones.
2
Big Potential
Both private and public data centers are known to have relatively low utilization rates, yet servers are the largest cost in the data center [3]. We have studied a cluster of 55 hosts within our university and 137 hosts that run the Wikimedia Foundation’s websites, including wikipedia, to see how much capacity is left idle.
2.1
IT Department Virtualized Cluster
We start our analysis by examining a cluster of servers used by our university’s Division of IT. The university uses VMWare’s virtualization platform to run approximately 10 virtual machines on each of the cluster’s 55 hosts. The virtual machines run a range of applications such as web servers, domain controllers, databases, and business applications. We have gathered traces of the CPU, memory, network, and disk utilization for each host over a five month period. For each resource we report % utilization out of the total host capacity. We report the percent of memory on each host that VMware considers actively used, i.e., memory that is allocated to a VM and is considered part of its working set [11]. All hosts have two Xen E5-2640 CPUs (12 cores total), 96GB of RAM, and are connected to ten gigabit ethernet. Figure 1 shows the CPU utilization of all hosts over the first two months of the trace. While load fluctuates on a diurnal basis, the median utilization level is often below 10%. In fact, in only 2.5% of the measurement intervals is there even a single server with CPU usage greater than 50%. Of course CPU is only one of several important re-
2.2
Wikipedia Application Servers
Many popular websites consider their server workloads proprietary information, limiting the availability of real utilization data. Fortunately, Wikipedia, the 6th busiest website in the world, releases all of its monitoring data.1 We have analyzed a trace of data from Wikipedia’s Application Servers running in its Equiad data center starting on March 14th and ending on April 11th. This cluster is composed of 137 servers, each with either 6 or 12 processing cores. While this cluster does not use virtualization, it still gives us insight into the workload seen by a large-scale web application, and illustrates the potential for better resource multiplexing if virtualized servers could be used. Figure 3 shows the average utilization of all hosts over the full measurement period of 28 days; we average utilization by host regardless of differences in server specs. For this data set we only report CPU utilization since the application severs use minimal disk bandwidth, and since the servers are not virtualized, it is impossible to measure how much memory is actively used. Once again, we find that the hosts are very lightly loaded, reporting average CPU utilization of only 25% over the month long trace. The average utilization 1
http://ganglia.wikimedia.org/
2
1
80
0.8
60
0.6
CDF
% CPU Utilization
100
40 20
TPCW Alone w/PI Min Weight w/PI Def. Weight w/WC Min Weight
0.4 0.2
0
0 0
50 100 150 200 Measurement Interval (3 hours each)
250
Figure 3: Wikipedia’s Application servers have a utilization range of 18 to 33%, leaving a large amount of capacity idle.
0
100 200 300 400 TPC-W Response Time (msec)
500
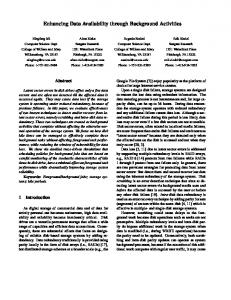
Figure 4: Colocated Hadoop jobs significantly hurt web application performance, even when Xen’s scheduler priority mechanisms are used.
throughout the trace is quite stable, with only minor fluctuations due to diurnal access patterns. We speculate that this may be because wikipedia has a global audience, so there is less night time dip. Wikipedia is composed of multiple service tiers (e.g., memcached nodes, databases, load balancers, etc), all of which appear to have a similar light load as the application servers. Despite this, wikipedia has a reputation for running a massive web application at as low cost as possible, so we believe that it is very likely that these load levels are not unique to Wikipedia, but are likely representative of a much wider range of web applications.
tions to load a full web page. To evaluate the interference caused by a big data application, we use two different types of Hadoop jobs: PI and Wordcount. The first is primarily CPU intensive while the second is IO intensive. We configure a simple Hadoop cluster composed of only two virtual machines—a master running on a separate host and a slave virtual machine that is colocated with the TPC-W VM. Hadoop data files are spread across the Master and Slave, but the slave does all processing. All results are the average of at least three fifteen minute trials.
3
3.1
Big Problems
We next consider what happens if a system administrator decides to make use of the ubiquitous spare capacity found in the previous section by deploying virtual machines running Hadoop. Experimental Setup: For our tests we use Xen 4.1.2 with Linux 3.2, running on Dell servers with Intel E52420 CPUs and 16GB of RAM. The CPU has six physical cores at 1.90GHz with 64KB of L1 cache and 256KB of L2 cache per core, and a shared 15MB L3 cache. Depending on the experiment, the web and Hadoop virtual machines are pinned to either two dedicated or shared CPU cores. Xen’s Domain-0, which hosts drivers used by all VMs, is given the server’s remaining cores. We use the TPC-W web benchmark—an online book store—as our interactive application, and measure the response time seen by client workload generators running on an identical host connected by gigabit ethernet. TPC-W runs in a single VM hosting both Tomcat and MySQL servers; client interactions involve database and file system accesses to process page requests and load images. It has been shown that many modern web applications are significantly more complicated than TPCW, e.g., accessing amazon.com’s home page involves approximately 141 HTTP requests compared to TPC-W’s 6 [1]. While our results show a high degree of interference on TPC-W, we expect that this will be even larger on more complex applications that involve many interac-
Hadoop Interference
We begin by studying how colocating a Hadoop PI calculation job with a TPC-W virtual machine affects the response time of the interactive website. Motivated by the data in the previous sections, we use a relatively light workload for TPC-W: we emulate 700 active client browsers, which consumes an average of 48% of the two CPU cores given to the TPC-W virtual machine. Figure 4 shows a CDF of web response times under several different scenarios. When TPC-W runs by itself, we find an average response time of 36ms. When it is run sharing the CPUs with Hadoop (the “w/PI Def. Weight” line), the response time rises to 209ms. To try to mitigate this performance loss, we use the Xen Credit scheduler’s support for relative weights to give TPC-W the maximum weight and Hadoop the minimum (65,535 to 1). Unfortunately, this has only a minor performance improvement: the average response time is 153ms, and the 95th percentile of response times still rises from 130ms in the base case to 560ms when using the CPU scheduler’s weighted priority mechanism (the “w/PI Min Weight” line). Note that the minimal difference between the default CPU weights and these extreme weights is partially due to the fact that even in the default case, Xen would attempt to give an equal 50% share of the two CPU cores to TPC-W, which is slightly more than it needs to service its workload. Xen’s scheduler gives TPC-W the same overall CPU utilization whether 3
1
0.8
0.8
0.6
0.6
CDF
CDF
1
0.4
TPCW Alone w/PI Separate CPU w/WC Separate CPU
0.2
0.2
0
0 0
100 200 300 400 TPC-W Response Time (msec)
500
Figure 5: Surprisingly, dedicating CPUs to each VM eliminates nearly all interference.
0
We next consider the interference when running a Word Count Hadoop job (the “w/WC Min. Weight” line in Figure 4). This task involves significant CPU usage and disk IO. Not surprisingly, this causes even worse performance for the TPC-W application. The average response time rises from 36ms to 291ms, and there are many failed requests that in some trials cause TPC-W to crash (which happened occasionally with PI as well). The 95th percentile of response times rises to 1040ms, an eight-fold increase over running TPC-W alone.
Separate CPU Cores
The interference demonstrated in the previous section is not unexpected. Prior work has particularly shown that IO virtualization can incur high overheads and interference [2, 6]. As a result, we were quite surprised by our experiments shown in Figure 5, which measured the interference when the Hadoop VM is given two separate CPU cores from TPC-W (thus Dom-0, TPC-W, and Hadoop are each pinned to a pair of distinct physical cores). We find that when given separate CPUs, the performance interference is dramatically lowered: the 95th response time percentile with Word Count is only 190ms when it is given a separate CPU (compared to 1040ms when sharing with TPC-W). While dedicating CPUs to the Hadoop VM violates the goals of this work (trying to maximize the utilization of shared resources), this does illustrate that at least for some applications, the interference is almost entirely based on CPU behavior, not IO activities as has traditionally been believed. As discussed later, this result guides our future work to not only investigate interference prevention in the IO path, but also within the CPU scheduler and caching systems.
100 200 300 400 TPC-W Response Time (msec)
500
Figure 6: CPU benchmarks also interfere with TPC-W when sharing CPU cores.
3.3 a Hadoop task is running or not (48.4% with Hadoop vs 48.6% alone), but clearly this type of weighted share is insufficient for ensuring the performance of latency sensitive applications.
3.2
TPCW Alone w/SysCPU Separate CPU w/CacheBench Separate CPU w/SysCPU Min Weight w/CacheBench Min Weight
0.4
CPU Benchmark Interference
Given that the interference observed for Hadoop can be almost entirely eliminated by manipulating CPU resources, we next analyze the amount of interference that can be caused by two processor intensive benchmarks. Figure 6 shows the impact on response time from running either the SysBench1 prime calculating benchmark or CacheBench2 , a cache intensive workload. We select these benchmarks because the previous section makes it difficult to determine if the interference is caused by poor CPU scheduling choices or simply due to cache interference. The CPU’s 15MB L3 cache is shared even in the separate CPU case described above that had minimal interference, hinting that the scheduler is more likely to blame than the cache. Our results in Figure 6 show that these CPU benchmarks can cause just as much interference as the Hadoop jobs. The CacheBench VM causes the highest degree of interference, with a 95th response time percentile of 1140ms, versus 770ms with SysBench. Despite this high potential for interference, we again find that placing the benchmarks on separate CPU cores solves the problem. Since these benchmarks perform no disk or network IO, this makes sense, although it is important to note that separate cores resolves even the cache intensive benchmark’s interference, despite still using the same shared last level cache. This means that if cache interference is to blame, it is only due to L1 and L2 cache interference problems. In our future work we intend to examine this phenomenon more closely using data from hardware performance counters.
3.4
Impact on Hadoop Performance
Running a Hadoop task has a clear impact on TPCW’s performance, but it is also important to consider how variable resource availability affects Hadoop’s performance. This is particularly important because the Hadoop task tracker may consider slow tasks to be failures, causing speculative execution. There is no point 1 2
http://sysbench.sourceforge.net http://icl.cs.utk.edu/projects/llcbench
4
50th 18 64 140 110 140
Share 75th 43 180 320 250 330
95th 120 560 1040 770 1140
50th 18 20 23 18 20
Sep 75th 43 58 71 37 51
Dom-0
Second VM None PI WC SysCPU CacheB
95th 120 160 190 130 190
3.5
Result Summary
Our results, summarized in Table 1, illustrate that Xen is able to provide good performance isolation for TPC-W if virtual machines are given dedicated CPUs, but that its priority mechanism is insufficient if CPUs must be shared. Importantly, our results are currently limited to the TPC-W benchmark, which has a relatively simple processing path and performs a limited amount of network and disk IO. Our ongoing work will study a wider range of interactive application types to see how they are impacted by different types of interference.
4
The Sources of Interference
The Xen architecture, illustrated in Figure 7, has multiple subsystems that can cause interference. Device drivers are managed by Xen’s Domain-0, which can both cause interference and makes it difficult to account how processing time should be attributed to each VM. Our results indicate that the sharing of CPUs can cause a significant amount of interference for latency sensitive applications, most likely because of poor choices made by Xen’s scheduler. The shared CPU caches may also be a culprit, although the globally shared L3 cache does not appear to have any significant contention. Xen’s Credit scheduler is a non-preemptive weighted fair-share scheduler. As a VM runs, its VCPUs are dynamically assigned one of three priorities - over, under, or boost, ordered from lowest to highest. Each physical CPU has a local run queue for runnable VCPUs, and
Web VM
Block Device Driver
Hadoop VM
Event Channels Interrupt Handlers
NIC NIC(s)
Table 1: The 50th , 75th , and 95th percentiles of TPC-W response time in ms when a second VM has either a shared or separate pair of cores.
using spare capacity to run Hadoop if all tasks started there are simply aborted or ignored by the task tracker. When we run the Hadoop PI task alongside the TPCW VM, the total job completion time is 1729 seconds, compared to 1228 seconds if Hadoop is run alone on the two CPU cores. When run together, TPC-W consumes 48% of the CPU time, so Hadoop performance is actually better than expected, given that it is receiving half as much CPU time as when running alone. However, the main problem is that when Hadoop runs using only resources that otherwise would be left idle, it will have higher variation in task completion time.
Network Driver
Disk Disk(s)
Xen
CPU Scheduler Dom-0
Web
Hadoop
CPU 1 CPU 2 CPU 3 CPU 4 Shared Cache
Figure 7: The Xen virtualization architecture allows resources to be shared, but this can potentially cause interference in each of the highlighted areas.
VMs are selected by their priority class. Every 30ms, a system-wide accounting thread updates the credits for each VCPU according to its weight share and resorts the queue if needed. If the credits for a VCPU are negative, Xen assigns “over” priority to this VCPU since it has consumed more than its share. If the credits are positive, it is assigned “under” priority. Every 10ms, Xen updates the currently running VCPUs credits based on the VCPU running time. In order to improve a virtual machine’s I/O performance, if a VCPU is woken up (e.g., because an IO request completes) and it has credits left, it will be given “boost” priority and immediately scheduled. After the boosted VCPU consumes a non-negligible amount of CPU resources, then Xen resets the priority to “under”. We had originally believed that Hadoop was causing interference due to being scheduled as “boost” priority, allowing it to interrupt TPC-W. However, since we see a high degree of interference even when running CPU benchmarks that perform negligible IO, this cannot be the only problem. One possibility is to reduce the scheduling time quantum, although our preliminary tests with a 1ms quantum indicate this alone is not sufficient.
5
Related Work
Several projects have sought to improve virtual I/O performance at the network [4] or disk [10] layers. However, the goal of these projects is typically to maximize IO throughput, rather than provide low latency to high priority VMs. Several previous works propose to improve the efficiency of the Xen credit scheduler. Xi et. al., use techniques from Real-Time scheduling to give stricter deadline guarantees to each virtual machine [12]. Our previous work automatically detected VM workloads and assigned dynamic CPU priorities, but it was not designed for IO intensive applications [5]. [8] improves application performance in NUMA multicore systems by designing a NUMA aware scheduler. Cheng proposes a proportional share CPU scheduler with soft real-time support to reduce scheduling delay for network 5
packets [2]. Kang et. al., specifically looks at MapReduce, and designs two scheduling policies to achieve proportional fair sharing across MapReduce clusters [6]. The key difference between previous studies and our work is that we focus on reducing the interference between latency-sensitive applications like TPC-W and data and computational intensive applications like Hadoop. Other work has looked at avoiding interference between these tasks by careful VM placement [13] or dedicating resources [7], but our goal of maximizing data center utilization dictates that we must find a way to safely and efficiently combine these types of VMs on hosts throughout a data center. Work has been done on managing Map Reduce in heterogeneous environments to meet performance goals [14, 9]. Running Map Reduce using spare resources will require advances at both the virtualization layer and within these job schedulers and performance models.
6
Conclusions & Future Work
Several studies have shown that data centers often leave a large fraction of their resources idle, and we have confirmed this with studies of 55 hosts in our university’s data center and 137 hosts running Wikipedia’s application servers. Since well over half of the CPU, memory, and disk bandwidth on these machines is often left unused, it would be highly desirable to run low priority Big Data analysis applications in the background on these servers. However, we have shown that the performance isolation provided by the Xen hypervisor is not currently strong enough to support a mix of latency sensitive web applications and Big Data processing tasks. Surprisingly, we find that interference caused by the CPU scheduling algorithm or the CPU cache (not IO interference) are the key causes of performance degradation in our tests. In our ongoing work, we are using hardware performance counters to better understand cache performance and the details of scheduler behavior. Towards the goal of being able to run big data applications with minimal interference, we will investigate how Xen’s CPU scheduler can be improved by adjusting the scheduling quantum and priority calculations. We are also testing more complicated web applications to see at what point IO interference within Domain-0 becomes the key bottleneck, and whether existing Linux IO scheduling mechanisms are sufficient—our initial tests suggest they are not and that further work will need to be done at that level as well. Finally, we are considering how the Hadoop task scheduler can be improved to better handle running on a wide range of nodes with different amounts of spare capacity. Ideally, system administrators should be able to run big data applications in the background without impacting interactive applications, while still achieving the deadlines set for the processing tasks.
References [1] E. Cecchet, V. Udayabhanu, T. Wood, and P. Shenoy. BenchLab: an open testbed for realistic benchmarking of web applications. In Proceedings of the 2nd USENIX conference on Web application development, WebApps’11, 2011. [2] L. Cheng and C.-L. Wang. Network performance isolation for latency-sensitive cloud applications. Future Generation Computer Systems, 2012. [3] A. Greenberg, J. Hamilton, D. A. Maltz, and P. Patel. The cost of a cloud: research problems in data center networks. SIGCOMM Comput. Commun. Rev., 39(1), Dec. 2008. [4] H. Guan, Y. Dong, R. Ma, D. Xu, Y. Zhang, and J. Li. Performance Enhancement for Network I/O Virtualization with Efficient Interrupt Coalescing and Virtual ReceiveSide Scaling. IEEE Transactions on Parallel and Distributed Systems, 24(6), 2013. [5] J. Hwang and T. Wood. Adaptive dynamic priority scheduling for virtual desktop infrastructures. In Proceedings of the 2012 IEEE 20th International Workshop on Quality of Service, page 16. IEEE Press, 2012. [6] H. Kang, Y. Chen, J. L. Wong, R. Sion, and J. Wu. Enhancement of Xen’s scheduler for MapReduce workloads. In Proc. of the 20th International Symposium on High Performance Distributed Computing, 2011. [7] E. Keller, J. Szefer, J. Rexford, and R. B. Lee. NoHype: virtualized cloud infrastructure without the virtualization. In Proceedings of the 37th annual International Symposium on Computer Architecture, ISCA ’10, 2010. [8] J. Rao, K. Wang, X. Zhou, and C.-Z. Xu. Optimizing Virtual Machine Scheduling in NUMA Multicore Systems. In Proceedings of 19th IEEE International Symposium on High Performance Computer Architecture, HPCA ’13. IEEE, 2013. [9] B. Sharma, T. Wood, and C. R. Das. HybridMR: A Hierarchical MapReduce Scheduler for Hybrid Data Centers. In to appear in IEEE International Conference on Distributed Computing Systems (ICDCS 2013), 2013. [10] O. Sukwong and H. S. Kim. DPack: Disk Scheduler for Highly Consolidated Cloud. In Proceedings of the INFOCOM Miniconference, 2013. [11] C. A. Waldspurger. Memory resource management in VMware ESX server. SIGOPS Oper. Syst. Rev., 36(SI), Dec. 2002. [12] S. Xi, J. Wilson, C. Lu, and C. Gill. RT-Xen: Towards Real-time Hypervisor Scheduling in Xen. In Embedded Software (EMSOFT), 2011 Proceedings of the International Conference on, 2011. [13] Y. Xu, Z. Musgrave, B. Noble, and M. Bailey. Bobtail: Avoiding Long Tails in the Cloud. In Proc. USENIX Symposium on Networked Systems Design and Implementation, 2013. [14] Z. Zhang, L. Cherkasova, A. Verma, and B. T. Loo. Automated profiling and resource management of pig programs for meeting service level objectives. In Proceedings of the 9th International Conference on Autonomic Computing, ICAC ’12, 2012.
6