BigDebug: Debugging Primitives for Interactive Big Data Processing in Spark Muhammad Ali Gulzar, Matteo Interlandi, Seunghyun Yoo, Sai Deep Tetali Tyson Condie, Todd Millstein, Miryung Kim University of California, Los Angeles
ABSTRACT Developers use cloud computing platforms to process a large quantity of data in parallel when developing big data analytics. Debugging the massive parallel computations that run in today’s datacenters is time consuming and error-prone. To address this challenge, we design a set of interactive, real-time debugging primitives for big data processing in Apache Spark, the next generation data-intensive scalable cloud computing platform. This requires rethinking the notion of step-through debugging in a traditional debugger such as gdb, because pausing the entire computation across distributed worker nodes causes significant delay and naively inspecting millions of records using a watchpoint is too time consuming for an end user. First, B IG D EBUG’s simulated breakpoints and on-demand watchpoints allow users to selectively examine distributed, intermediate data on the cloud with little overhead. Second, a user can also pinpoint a crash-inducing record and selectively resume relevant sub-computations after a quick fix. Third, a user can determine the root causes of errors (or delays) at the level of individual records through a fine-grained data provenance capability. Our evaluation shows that B IG D EBUG scales to terabytes and its record-level tracing incurs less than 25% overhead on average. It determines crash culprits orders of magnitude more accurately and provides up to 100% time saving compared to the baseline replay debugger. The results show that B IG D EBUG supports debugging at interactive speeds with minimal performance impact.
Categories and Subject Descriptors D.2.5 [Software Engineering]: Testing and Debugging—debugging aids, distributed debugging, error handling and recovery
Keywords Debugging, big data analytics, interactive tools, data-intensive scalable computing (DISC), fault localization and recovery
1.
INTRODUCTION
An abundance of data in many disciplines of science, engineering, national security, health care, and business has led to the Permission to make digital or hard copies of all or part of this work for personal or classroom use is granted without fee provided that copies are not made or distributed for profit or commercial advantage and that copies bear this notice and the full citation on the first page. Copyrights for components of this work owned by others than the author(s) must be honored. Abstracting with credit is permitted. To copy otherwise, or republish, to post on servers or to redistribute to lists, requires prior specific permission and/or a fee. Request permissions from
[email protected].
ICSE ’16, May 14 - 22, 2016, Austin, TX, USA c 2016 Copyright held by the owner/author(s). Publication rights licensed to ACM.
ISBN 978-1-4503-3900-1/16/05. . . $15.00 DOI: http://dx.doi.org/10.1145/2884781.2884813
emerging field of Big Data Analytics that run in a cloud computing environment. To process massive quantities of data in the cloud, developers leverage Data-Intensive Scalable Computing (DISC) systems such as Google’s MapReduce [14], Hadoop [3], and Spark [38]. These DISC systems expose a programming model for authoring data processing logic, which is compiled into a Directed Acyclic Graph (DAG) of data-parallel operators. The root DAG operators consume data from some input source (e.g., GFS [18] or HDFS [33]), while downstream operators process the intermediate outputs from DAG predecessors. Scaling to large datasets is handled by partitioning the data and assigning tasks that execute the operator on each partition. Currently, developers do not have easy means to debug DISC applications. The use of cloud computing makes application development feel more like batch jobs and the nature of debugging is therefore post-mortem. Developers are notified of runtime failures or incorrect outputs after many hours of wasted computing cycles on the cloud. DISC systems such as Spark do provide execution logs of submitted jobs. However, these logs present only the physical view of Big Data processing, as they report the number of worker nodes, the job status at individual nodes, the overall job progress rate, the messages passed between nodes, etc. These logs do not provide the logical view of program execution e.g., system logs do not convey which intermediate outputs are produced from which inputs, nor do they indicate what inputs are causing incorrect results or delays, etc. Alternatively, a developer may test their program by downloading a small subset of Big Data from the cloud onto their local disk, and then run the DISC application in a local mode. However, using a local mode, she may not encounter the same failure, because the faulty data may not be included in the given data sample. The vision of B IG D EBUG is to provide interactive, real-time debugging primitives for Big Data processing. Designing B IG D EBUG requires re-thinking the traditional step-through debugging primitives as provided by tools such as gdb. Pausing the entire computation across distributed worker nodes causes significant delay and reduces overall throughput. Naively inspecting millions of records flowing through a data-parallel pipeline is too time-consuming and infeasible for an end user. B IG D EBUG must tag how individual records are flowing through individual worker nodes and transfer the requested debug information from the distributed worker nodes to the driver in an efficient manner. In other words, B IG D EBUG must meet the requirements of low overhead, scalability, and finegranularity, while providing expressive debugging primitives. To solve these technical challenges, B IG D EBUG provides simulated breakpoints, which create the illusion of a breakpoint with the ability to inspect program state in distributed worker nodes and to resume relevant sub-computations, even though the pro-
TextFile
FlatMap
Map
ReduceByKey
Stage 1
Stage 2
After all is said and
After all is said and
(After,1) (all,1) (is,1) (said,1) (and,1)
(After,1) (all,1) (is,2) (and,1)
Task 2
done more is said
done more is said
(done,1) (more,1) (is,1) (said,1)
(more,1) (said,2)
Task 2
Task 3
than done
than done
(than,1) (done,1)
(than,1) (done,2)
Task 3
Task 1
After all is said and done more is said than done
Collect
Task 1 After,1 all, 1 is, 2 and, 1 more, 1 said, 2 done, 2 than, 1
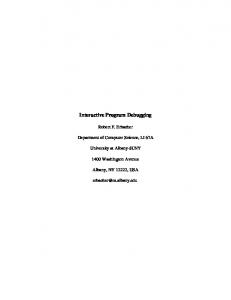
Figure 1: Data transformations in word count with 3 tasks gram is still running in the cloud. To help a user inspect millions of records passing through a data-parallel pipeline, B IG D EBUG provides guarded watchpoints, which dynamically retrieve only those records that match a user-defined guard predicate. B IG D E BUG supports fine-grained forward and backward tracing at the level of individual records by leveraging prior work on data provenance within Spark [22]. To avoid restarting a job from scratch in case of a crash, B IG D EBUG provides a real-time quick fix and resume feature where a user can modify code or data at runtime. It also provides fine-grained latency monitoring to notify a user which records are taking much longer than other records. We evaluate B IG D EBUG in terms of performance overhead, scalability, time saving, and crash localizability improvement on three Spark benchmark programs with up to one terabyte of data. With the maximum instrumentation setting where B IG D EBUG is enabled with record-level tracing, crash culprit determination, and latency profiling, and every operation at every step is instrumented with breakpoints and watchpoints, it takes 2.5 times longer than the baseline Spark. 2.5X is a very conservative upper bound, as a developer typically would not need to monitor the latency of each record at every transformation and would not need to set breakpoints on every operator. If we disable the most expensive record-level latency profiling, B IG D EBUG introduces an overhead less than 34% on average. We also measure the time saving achieved, since its quick fix and resume feature enables a user to recover appropriately from a crash and resume the rest of computation. We also compare B IG D EBUG’s capability to determine crash-inducing records against baseline Spark, which reports failures at the level of tasks, each of which handles millions of records. B IG D EBUG offers the following contributions: • B IG D EBUG provides breakpoints and watchpoints with minimal performance impact. • B IG D EBUG exhibits less than 24% overhead for record-level tracing, 19% overhead for crash monitoring, and 9% for ondemand watchpoint on average. • B IG D EBUG’s quick fix and resume feature allows a user to avoid re-running a program from scratch, resulting in up to 100% time saving. • B IG D EBUG narrows down the scope of failure-inducing data by orders of magnitude through fine-grained tracing of individual records within the distributed, data processing pipeline. Several frameworks [30, 23, 13] have been proposed to debug DISC applications but none provides a comprehensive set of realtime inspection features for DISC systems. Existing debuggers are either a post-mortem replay debugger [13] or data provenance solutions that keep track of which intermediate outputs are produced
from which inputs by storing metadata in external storage [27, 21]. Our recent study finds that these solutions are limited in terms of scalability and performance [22]. NEWT [27] can scale up to only 100GB and this takes 85X of baseline Spark, in comparison to B IG D EBUG handling up to 1TB with only 2.5X . B IG D EBUG is available for download at http://web.cs.ucla.edu/ ~miryung/software.html. The website also includes B IG D EBUG’s manual and API description. The rest of the paper is organized as follows. Section 2 discusses the background on large data-parallel processing in Apache Spark and why we chose Spark. Section 3 introduces a set of interactive debugging primitives with a running example. Section 4 describes the design and implementation of individual features. Section 5 describes evaluation settings and the results. Section 6 describes related work. Section 7 concludes with future work.
2.
BACKGROUND: APACHE SPARK
Apache Spark [5] is a large scale data processing platform that achieves orders-of-magnitude better performance than Hadoop MapReduce [3] for iterative workloads. B IG D EBUG targets Spark because of its wide adoption—with over 800 developers and 200 companies leveraging its capabilities—and support for interactive ad-hoc analytics, allowing programmers to explore the data as they refine their data-processing logic. Spark’s high-level programming model provides over 80 types of data manipulating operations and supports language bindings for Scala, Java, Python, and R. Furthermore, a variety of domain specific extensions have been built on Spark, including MLLib [28] for machine learning, GraphX [19] for graph processing, SparkSQL [9] for relational queries, and statistical analysis in R. Spark can consume data from a variety of data sources, including distributed file systems (like HDFS [33]), object stores (like Amazon S3 [1]), key-value stores (like Cassandra and HBase), and traditional RDBMS (like MySQL and Postgres). The Spark programming model can be viewed as an extension to the MapReduce programming model that includes direct support for traditional relational algebra operators (e.g., group-by, join, filter), and iterative computations through a “for” loop language construct. These extensions offer orders-of-magnitude better performance over previous Big Data processing frameworks like Apache Hadoop [3] for iterative workloads like machine learning. Spark also comes with a relaxed fault tolerance model—based on workflow lineage [10]—that is built into its primary abstraction: Resilient Distributed Datasets (RDDs) [38], which exposes a set of data processing operations called transformations (e.g., map, reduce, filter, group-by, join) and actions (e.g., count, collect). Spark programmers leverage RDDs to apply a series of transformations to a collection of data records (or tuples) stored in a
distributed fashion e.g., in HDFS [33]. Calling a transformation on an RDD produces a new RDD that represents the result of applying the given transformation to the input RDD. Transformations are lazily evaluated. The actual evaluation of an RDD occurs when an action is called. At that point the Spark runtime executes all transformations leading up to the RDD, on which it then evaluates the action e.g., the count action counts the number of records in the RDD. A complete list of transformations and actions can be found in the Spark documentation [6]. 1 2 3 4 5
: Communication Channel
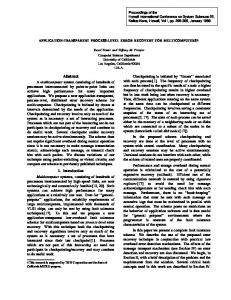
Figure 2 shows a word count program written in Spark using Scala. The frequency of each unique word in the input text file is calculated. It splits each word using a space as a separator, and maps each word to a tuple containing the word text and 1 (the initial count). The reduceByKey transformation groups the tuples based on the word (i.e., the key) and sums up the word counts in the group. Finally, the collect action triggers the evaluation of the RDD referencing the output of the reduceByKey transformation. The collect action returns a list of tuples to the driver program—containing each unique word and its frequency. The Spark platform consists of three modules: a driver, a master, and a worker. A master node controls distributed job execution and provides a rendezvous point between a driver and the workers. The master node monitors the liveliness of all worker nodes and tracks the available resources (i.e., CPU, RAM, SSD, etc.). Worker nodes are initiated as a process running in a JVM. Figure 3 shows an example Spark cluster containing three worker nodes, a master node, and a driver. A Spark job consists of a series of transformations that end with an action. Clients submit such jobs to the driver, which forwards the job to the master node. Internally, the Spark master translates a series of RDD transformations into a DAG of stages, where each stage contains some sub-series of transformations until a shuffle step is required (i.e., data must be re-partitioned). The Spark scheduler is responsible for executing each stage in topological order, with tasks that perform the work of a stage on input partitions. Each stage is fully executed before downstream dependent stages are scheduled. The final output stage evaluates the action. The action result values are collected from each task and returned (via the master) to the driver program, which can initiate another series of transformations ending with an action. Figure 1 represents the execution plan (stage DAG) for our word count example in Figure 2. The input text is divided into three partitions. The driver compiles the program into two stages. Stage 1 applies the flatmap and map transformations to each input partition. A shuffle step is then required to group the tuples by the word. Stage 2 processes the output of that shuffle step by summing up the counts for each word. The final result is then collected and returned to the driver. In this example, both stages are executed by three tasks. It is also worth noting that each task runs on a separate thread, so each worker may run multiple tasks concurrently using multiple executors based on resource availability such as the number of cores.
MOTIVATING SCENARIO This section overviews B IG D EBUG’s features using a motivating
Master Worker
2- Get workers
4
Driver
User Program
1- Run Program
BigDebug Controls
3
Worker 5- Show output to the user
val textFile = spark.textFile("hdfs://...") val counts = textFile .flatMap(line => line.split(" ")) .map(word => (word, 1)) .reduceByKey(_ + _).collect()
Figure 2: Scala word count application in Apache Spark
3.
: Debugger Instance
3 4
3
3- Connect to workers and assign tasks
4
Worker
4- Send the result to the driver
Figure 3: Architecture of Spark with B IG D EBUG example. Suppose that Alice writes a Spark program to parse and analyze election poll logs. The log consists of billions of log entries and is stored in Amazon S3. The size of the data makes it difficult to analyze the logs using a local machine only. Each log entry contains the phone number, the candidate preferred by the callee, the state where the callee lives, and a UNIX timestamp, for example: 249-904-9999 Clinton Texas 1440023983 1 2 3 4 5
6 7
val log = "s3n://xcr:wJY@ws/logs/poll.log" val text_file = spark.textFile(log) val count = text_file .filter( line => line.contains("Texas")) .filter( line => line.split(" ")[3].toInt > 1440012701) .map(line = > (line.split(" ")[1] , 1)) .reduceByKey(_ + _).collect()
Figure 4: Election poll log analysis program in Scala Figure 4 shows the program written by Alice, which totals the number of “votes” in Texas for each candidate, across all phone calls that occurred after a particular date. Line 2 loads the log entry data stored in Amazon S3 and converts it to an RDD object. Line 4 selects lines containing the term ‘Texas.’ Line 5 selects lines whose timestamps are recent enough. Line 6 extracts the candidate name of each entry and emits a key-value pair of that vote and the number 1. Line 7 counts the votes for each candidate by summing by key. Alice already tested this program by downloading the first million log entries from the Amazon S3 onto a local disk and running the Spark program in a local mode. When she tests her program with the subset of the data using a local mode, there is no failure. However, when she runs the same program on a much bigger data stored in S3 using a cluster mode, she encounters a crash. Spark reports to Alice the physical view of the crash only—the type of crash, in this case NumberFormatException, with a stack trace, the id of a failed task, the id of an executor node encountering the crash, the number of re-trials before reporting the crash, etc. However, such physical-layer information does not help Alice to debug which specific input log entry is causing the crash. Though Spark reports the task ID of a crash, it is impossible for Alice to know which records were assigned to the crashed executor and which specific entry is causing the crash. Even if she identifies a subset of input records assigned to the task, it is not feasible for her to manually inspect millions of records assigned to the failed task. She tries to rerun the program several times but the crash is persistent, making it less probable to occur due to a hardware failure in the cluster. Crash Culprit Determination. With B IG D EBUG, Alice is provided with a specific record causing the crash, in this case a record, "312-222-904 Trump Illinois 2015-10-11.” B IG D E -
BUG first reports a specific transformation responsible for the crash as well—line 5 in Figure 4 at time.toInt, which tries to change the timestamp from String to Integer, causing a NumberFormatException. Using B IG D EBUG’s backward tracing feature, Alice then locates the specific log entry in the S3 input causing the crash. She then sees that this log entry uses a timestamp in Date format rather than UNIX format. RealTime Code Fix and Resume. Without B IG D EBUG, Alice can only modify the input data and restart the job from scratch, incurring wasted computation in running Amazon EC2 services. Using B IG D EBUG, Alice can fix the code on the fly by replacing the original filter at line number 5 with the following one and resuming the failed computation. 1 2 3 4 5 6
filter{ line => var time = line.split(" ")[3] val date = new Date("YYYY-MM-DD") if( date.checkFormat( time ) ) time = date.getTimeInUnix( time ) time.toInt > 1440012701 }
Guarded Watchpoint. Even after fixing the crash, Alice sees that the total number of votes found by the program is greater than what she expected to find. Using B IG D EBUG’s breakpoint, Alice investigates the intermediate result right after the second transformation at line number 5 in Figure 4. Without B IG D EBUG, investigating such intermediate result is not possible, because Spark combines all transformations within a single stage and evaluates them all at once. B IG D EBUG allows a user to set a breakpoint at any transformation step and investigate the intercepted intermediate results. She suspects that some UNIX timestamps may be in the 13digit millisecond format, while the code assumes timestamps are in the 10-digit second format. She therefore installs a watchpoint guarded by the following predicate (an ordinary function): (line => line.split(" ")[3].length > 10. B IG D EBUG dynamically retrieves the data matching this guard, and she can continue to modify the guard iteratively in order to investigate further.
4.
DEBUGGING PRIMITIVES
To provide interactive step-wise debugging primitives in Spark, B IG D EBUG must address three technical challenges. First, it must be scalable to handle large data sets on the order of terabytes. Second, since the debugger process on the driver must monitor and communicate with a large number of worker nodes performing tasks on the cloud, B IG D EBUG must have a low overhead, minimizing unnecessary communication and data transfer. Third, to help localize the cause of errors, B IG D EBUG must support finegrained data inspection and monitoring capabilities at the level of individual records rather than tasks. Currently, Spark reports failures at the level of tasks only. Since a single task processes millions of records, locating a failed task is inadequate, as it is impossible for a user to manually inspect millions of records. B IG D EBUG tackles these challenges by adopting a tight integration approach with Spark’s runtime. Instead of creating a wrapper of existing Spark modules to track the input and output of each stage, B IG D EBUG directly extends Spark to monitor pipelined, intra-stage transformations. To maximize the throughput of big data processing, B IG D EBUG provides simulated breakpoints that enable a user to inspect a program state in a remote executor node without actually pausing the entire computation. To reduce developers’ burden in inspecting a large amount of data, on-demand watchpoints retrieve intermediate data using a guard and transfer the selected data on demand. These primitives are motivated by prior user studies in Inspector Gadget [30], where they interviewed
abstract class RDD[T: ClassTag]( .... def watchpoint(f: T => Boolean): RDD[T] def breakpoint def breakpoint(f:T => Boolean) def enableLatencyAlert(set : Boolean) def setCrashConfiguration(set : CrashConfiguration) def setFunction(f : T => U) def goBackAll: LineageRDD def goNextAll: LineageRDD def goBack: LineageRDD def goNext: LineageRDD ....
1 2 3 4 5 6
7 8 9 10 11 12
Figure 5: B IG D EBUG’s API DISC developers in Yahoo and found that DISC developers want step-through debugging, crash culprit determination, and tracing features. Inspector Gadget proposes desired primitives but does not implement them.
Enable Latency Alert Enable Watchpoint $> a=>a.contains(“12”)
11 .... 12 val textFile =spark 13 .textFile("hdfs://...") 14 val counts = textFile 15 .flatMap(l => l.split(" ")) 16 .map(word => (word, 1)) 17 .reduceByKey(_ + _) 18 counts.collect 19 ....
Instrument .... val counts = textFile .flatMap(l => l.split(" ")) .map(word => (word, 1)) .reduceByKey(_ + _) ....
.... val word = textFile .flatMap(l => l.split(" ")) word.enableLatencyAlert() + val counts = word .watchpoint(a=>a.contains(“12”)) + .map(word => (word, 1)) .reduceByKey(_ + _) ....
Figure 6: B IG D EBUG instruments a program automatically based on debugger control commands entered by a user. The API for B IG D EBUG is shown in Figure 5 and targets Scala. A user may also use a web-based debugger UI to automatically insert corresponding API calls in the code. For example, the instrumented code on the bottom-right of Figure 6 is automatically generated from the debugger commands at the top of the figure.
4.1
Simulated Breakpoint
Doing a step by step execution to inspect intermediate outputs is a common debugging strategy. There are two technical challenges in implementing breakpoints in Spark. First, traditional breakpoints will pause the entire execution at the breakpoint, while a user investigates an intermediate program state. If we naively implement a normal breakpoint, a driver will communicate with all executor nodes so that each executor will process data until the breakpoint in the DAG and pause its computation until further debug commands are provided. This naive approach causes all the computing resources on the cloud to be temporarily wasted, decreasing throughput. Second, Spark optimizes its performance through pipelining transformations in a single stage. Therefore there is a mismatch between the logical view of data transformation and the physical view of data processing during debugging. For example, when two transformations t1 and t2 are applied to x, these are combined to t2(t1(x)) in a single stage and the intermediate result of t1(x) is not viewable, as it is not materialized or stored. Simulated Breakpoint. A simulated breakpoint enables a user to inspect intermediate results at a given breakpoint and resume the execution to create an illusion of a breakpoint, even though the program is still running on the cloud in the background. When
Breakpoint Stage 2
Stage 1
ReduceByKey
Stage 3
Map
FlatMap S1
S2
Collect
ReduceByKey S3
fore, a user cannot provide a code fix that breaks the integrity of the used data type. When a user replaces function f with a new function g, B IG D EBUG applies g to all records from the last materialization point to ensure consistency.
S4
Figure 7: Illustration of Simulated Breakpoint a simulated breakpoint is hit, B IG D EBUG spawns a new process to record the transformation lineage of the breakpoint, while letting the executors continue processing the task. For example, in Figure 7, when a user sets a breakpoint after flatmap, program state S2 is captured from the original workflow without affecting its execution. Therefore, setting a simulated breakpoint has almost zero overhead, as it only retains information to re-generate the program state from the latest materialization point, i.e., the last stage boundary before the simulated breakpoint, in this case S1. When a user requests intermediate results from the simulated breakpoint, B IG D EBUG then recomputes the intermediate results and caches the results. If a user queries data between transformations such as flatmap and map in Figure 7 within the same stage, B IG D EBUG forces materialization of intermediate results by inserting a breakpoint and watchpoint (described in Section 4.2) API call on the RDD object to collect the intermediate results. Resume and Step Over. When a user enters a resume command using B IG D EBUG’s user interface, B IG D EBUG will automatically jump to the original workflow running in the background. This procedure improves the overall throughput of the distributed processing. When a user enters a step over command to investigate the state after the next transformation in the UI, B IG D EBUG replays the execution to the next instruction only from the latest materialization point. This feature differentiates B IG D EBUG from an existing replay debugger such as Arthur [13], which restarts a job from the beginning. In Figure 7, when a user selects step over, a new workflow will start from the nearest possible materialization point, in this case, S1. B IG D EBUG uses the materialized state S1 and executes later operations while capturing S3 on the go. Realtime Code Fix. When a user finds anomalies in intermediate data, currently the only option is to terminate the job and rewrite the program to handle the outliers. Terminating a job at a later stage will waste all computations before. Because running tasks on cloud costs lots of money and even days to process billions of records, we hypothesize that developers are less likely to terminate the program after inspecting it at the breakpoint. To save the cost of re-run, B IG D EBUG allows a user to replace any code in the succeeding RDDs after the breakpoint. If a user wants to modify code, B IG D EBUG applies the fix from the last materialization point rather than the beginning of the program to reuse previously computed results. Assuming that a breakpoint is in place, a user submits a new function (i.e., a data transformation operator) at the driver. The function is then compiled using Scala’s NSC [4] library and shipped to each worker to override the call to the original function, when the respective RDD is executed. Suppose a user sets a breakpoint after flatmap and the program is paused in Figure 7. A user can replace the function in the map transformation from ((word => (word,1)) to {word => if (word!=null) (word,1); else (word,0);}. When a user resumes after the fix at S2, a new workflow will start from S1 and later RDDs including modified ones will be computed until the end of the workflow is reached and the background job of the original workflow is terminated. B IG D EBUG checks whether the supplied function has the same type as the original function through static type checking. There-
4.2
On-Demand Watchpoint with Guard
Similar to watching a variable in a traditional debugger like gdb, B IG D EBUG provides a watchpoint to inspect intermediate data. Because millions of records are passing through a dataparallel pipeline, it is infeasible for a user to inspect all intermediate records. Such data transfer would also incur high communication overhead, as all worker nodes must transfer the intermediate results back to the driver node. To overcome these challenges, B IG D EBUG provides an on-demand watchpoint with a guard closure function. A user can provide a guard to query a subset of data matching the guard. For example, (r=>r>4) is an anonymous function that takes r as input and returns true, if r is greater than 4, and rdd.watchpoint(r=>r>4) sets a watchpoint to retrieve all records greater than 4. B IG D EBUG automatically compiles such user-provided guard and distributes it to worker nodes to retrieve the matching data. On-Demand Batch Transfer. To reduce communication overhead, B IG D EBUG batches intermediate data and sends them to the driver when needed. If no request is made for the watchpointed data from the user, it will be kept at the workers until the end of the stage or the next breakpoint in the same stage, if there is any. When the computation passes the end of the stage, the remaining filtered data are flushed, so that there are enough memory available for other Spark operations. Dynamic Guard Modification. A user can modify a guard function to narrow down the scope of captured data. This feature is called a dynamic guard, as the function can be refined iteratively while the Spark job is executing. A watchpoint guard is built on top of Scala and Java and is written like a normal Spark program. For example, an expression (value._1.length > 50 && value._2 == 1) filters values where the length of first element in tuple is greater than 50 and the value of second element in tuple is 1. When a user updates a guard during a Spark job, B IG D EBUG uses Scala’s NSC library [4] to compile the guard at the driver node and ships it to all workers. Individual workers then load the new guard at each executor. Using a dynamic guard, a user can tune the amount of data being transferred and presented.
4.3
Crash Culprit and Remediation
DISC systems are limited in their ability to handle failures at runtime. In Spark, crashes cause the correctly computed stages to simply be thrown away. Remediating a crash at runtime can save time and resources by avoiding a program re-run from scratch. B IG D E BUG leverages fine-grained tracing to be discussed in Section 4.4 to identify a crash-inducing input, not just a crash culprit record in the intermediate stage. While waiting for a user intervention, B IG D E BUG runs pending tasks continuously to utilize idle resources and to achieve high throughput. Crash Culprit Determination. When a crash occurs at an executor, B IG D EBUG sends all the required information to the driver, so that the user can examine crash culprits and take actions as depicted in Figure 8. When a crash occurs, B IG D EBUG reports (1) a crash culprit—an intermediate record causing a crash (2) a stack trace, (3) a crashed RDD, and (4) the original input record inducing a crash by leveraging backward tracing in Section 4.4. Remediation. B IG D EBUG avoids the re-generation of prior stages by allowing a user to either correct the crashed record, skip the crash culprit, or supply a code fix to repair the crash culprit. A
map(r => r.toInt) Record
Map
“12”
12 Crash Report to Driver
“23s” “78”
“23s”
“6”
offset, text
Record 78 6 23
“23” Driver
Figure 8: An intermediate record “23s” at the map transformation causes a crash. B IG D EBUG reports the crash culprit, “23s” to the user and a user supplies the corrected record, “23”. naive resolution approach is to pause the execution, report the crash culprit to the driver and wait until a resolution is provided from the user. This method has the disadvantage of putting the workers in the idle mode, reducing throughput. Therefore, B IG D EBUG provides the following two methods. • Lazy Repair of Records. In case of a crash, the executor reports a crash culprit to the driver but continues processing the remaining pending records. Once the executor reaches the end of the task, it then waits for a corrected record from the user. This approach parallelizes the crash resolution without holding back the executor. If there are multiple crash culprits, B IG D EBUG accumulates the crashed records at the driver and lets all executors terminate, except the very last executor. The last executor on hold then processes the group of corrected records provided from the user, before the end of the stage. This method applies to the pre-shuffle stage only, because the record distribution must be consistent with existing record-to-worker mappings. This optimization of replacing crash-inducing records in batch improves performance. • Lazy Code Fix. B IG D EBUG accumulates crash culprits at the driver and lets all executors continue processing the pending records. It then asks a user to supply a code fix to repair the crash culprits, i.e., a new repair function to apply to the crash-culprits. Our assumption is that the new function extends the original function to clean the crash-inducing records and a user would like to see some results rather than nothing, because the current Spark does not provide any output to the user when a task crashes, even for successful inputs. If a user wants to apply a completely different function g to all records, she can use our Realtime Code Fix at simulated breakpoint instead. Similar to the above lazy repair of records, the last executor on hold applies the supplied function to the crash culprits in batch before the end of the stage.
4.4
Forward and Backward Tracing
B IG D EBUG supports fine-grained tracing of individual records by invoking a data provenance query on the fly. The data provenance problem in the database community refers to identifying the origin of final (or intermediate) output. Data provenance support for DISC systems is challenging, because operators such as aggregation, join, and group-by create many-to-one or many-to-many mappings for inputs and outputs and these mappings are physically distributed across different worker nodes. B IG D EBUG uses data provenance capability implemented through an extension of Spark’s RDD abstraction (called LineageRDD) that leverages Spark’s built-in fault tolerance and data management infrastructure [22]. The LineageRDD abstraction provides programmers with data provenance query capabilities. Provenance data is captured at the record level granularity, by tagging records with identifiers and associating output record identifiers with the relevant input record identifier, for a given transformation. From any given RDD, a Spark programmer can obtain a Lin-
(key, partial count)
(key, total count)
(After, 1) (is, 1) ... (is, 1) ... (done, 2)
(After, 1) (is, 2) ... (done, 2)
0, After is said 14, and 18, done more is said than done ...
Agent1 input 0 14 18 ...
input 0 18
output a b c ...
output a c
Agent2 input a a ... c ... c
output x y ... w ... z
Agent3 input x y w ... z
input a c
output 0 1 1 ... 100
output y w
Step 1
Step 2
Figure 9: A logical trace plan that recursively joins data lineage tables, back to the input lines eageRDD reference and use it to perform data tracing—i.e., the ability to transition backward (or forward) in the Spark program dataflow, at the record level. B IG D EBUG instruments submitted Spark programs with tracing agents that wrap transformations at stage boundaries. These agents implement the LineageRDD abstraction and have two responsibilities: (1) tag input and output records with unique identifiers for a given transformation and (2) store the associations between input and output record identifiers as a data provenance table in Spark’s native storage system. For example, Figure 9 shows intermediate results and a corresponding data provenance table for each agent. For example, the first line at offset 0 “After is said” is assigned with a unique output identifier, a. As this line is split into multiple records such as (After, 1) and (is, 1), unique output identifiers such as x and y are assigned to the corresponding key and partial count pairs. B IG D EBUG utilizes specific tracing agents based on the type of transformation e.g., data ingested from Hadoop Distributed File System (HDFS) and Amazon S3, and all native Spark transformations; agents are pluggable, making it easy to support other input data storage environments e.g., Cassandra, HBase, and RDBMS. Once the provenance data is recorded, tracing queries can be issued using the lineage-related methods of the API in Figure 5. The goBackAll and goNextAll methods are used to compute the full trace backward and forward respectively. That is, given some result record(s), goBackAll returns all initial input records (e.g., in HDFS) that contributed in the generation of the result record(s); goNextAll returns all the final result records that a starting input record(s) contributed to in a transformation series. A single step backward or forward is supported by the goBack and goNext respectively. At any given point in the trace, the user can interactively issue a native Spark collect action to view the raw data referenced by the LineageRDD. When a tracing query is issued, B IG D EBUG logically reconstructs the path connecting input to output records by recursively joining the provenance tables generated by the tracing agents, as shown in Figure 9 using the word count example. After executing a word count job, a user may want to perform a full backward tracing from the output value (is, 2). B IG D EBUG does this by first retrieving the identifier for output (is, 2) from the output provenance table. Figure 9 shows that identifier to be equal to 1, and the corresponding mappings have two input identifiers y and w. Tracing proceeds by (recursively) joining the provenance tables, at neighboring capture agents, along the output and input values. 1 represents a join operation of provenance tables. For instance, the join of Agent 3
Record
Record Time (ms) 5
r1
RDD
r 1`
r2
Report to debugger
r 2`
200
r3
r 3`
8
r4
r 4`
6
Figure 10: When latency monitoring is enabled, straggler records are reported to the user. and Agent 2 produces the Step 1 trace result. Subsequently, joining Step 1 with Agent 1 produces the Step 2 trace result, which is the final trace result referencing HDFS input records at offsets 0 and 18, both containing the word “is”. Supporting data provenance, while logically simple, is difficult to achieve in a DISC environment such as Spark because the size of input-output identifier mappings is as large as all intermediate results, and data provenance tables are physically distributed across worker nodes. For these reasons, Spark’s internal storage service is used for storing provenance data, and a distributed join implementation uses partition information embedded into the record identifiers to optimize the shuffle step. Implementing an optimized distributed join of data provenance tables in Spark is the subject of another paper [22], which details the advantage of an optimized distributed join in Spark over storing data provenance tables in external storage services (e.g., HDFS, MySQL).
4.5
Fine-Grained Latency Alert
In big data processing, it is important to identify which records are causing delay. Spark reports a running time only at the level of tasks, making it difficult to identify individual straggler records—records responsible for slow processing. To localize performance anomalies at the record level, B IG D EBUG wraps each operator with a latency monitor. For each record at each transformation, B IG D EBUG computes the time taken to process each record, keeps track of a moving average, and sends to the monitor, if the time is greater than k standard deviations above the moving average where default k is 2. Figure 10 shows an example of how straggler records are tagged and reported to the debugger. As we show in Section 5, record-level latency alert poses the highest overhead among B IG D EBUG’s primitives due to the cost of taking a timestamp for processing each record and computing the moving average among millions of records per executor.
5.
EVALUATION
We evaluate B IG D EBUG’s (1) scalability, (2) performance overhead, (3) localizability improvement in determining crash-inducing records, and (4) time saving w.r.t to an existing replay debugger. The main purpose of our evaluation is to investigate whether B IG D EBUG keeps performance similar to the original Spark and retains its scalability, while supporting interactive debugging. • How does B IG D EBUG scale to massive data? • What is the performance overhead of instrumentation and additional communication for debugging primitives? • How much localizability improvement does B IG D EBUG achieve by leveraging fine-grained, record level tracing? • How much time saving does B IG D EBUG provide through its runtime crash remediation, in comparison to an existing replay debugger? We use a cluster consisting of sixteen i7-4770 machines, each running at 3.40GHz and equipped with 4 cores (2 hyper-threads per core), 32GB of RAM, and 1TB of disk capacity. The operating system is a 64bit Ubuntu 12.04. The datasets are all stored on HDFS version 1.0.4 with a replication factor of 1—one copy of each dataset across the cluster. We compare B IG D EBUG’s per-
formance against the baseline Spark, version 1.2.1. The level of parallelism was set at two tasks per core. This configuration allows us to run up to 120 tasks simultaneously. We use three Spark programs for our performance experiments: WordCount, Grep, and PigMix query L1. WordCount computes the number of word occurrences grouped by unique words. WordCount comprises of 4 transformations, which are divided into 2 stages: the first stage loads the input file (textfile), splits each line into a bag of words (flatmap), creates a tuple of (word, 1) (map), and the second stage reduces the key-value pairs using each word as the key (reduceByKey). Grep finds the lines in the input datasets that contain a queried string. Grep comprises of only 1 stage with 2 transformations : textfile reads the input file line by line and filter applies a predicate to see if the line contains a substring. PigMix’s latency query L1 is a performance benchmark for DISC systems in which an unstructured data is transformed and analyzed. L1 comprises of 2 stages: the first stage contains textfile, 2 maps, flatmap followed by 2 maps and the second stage has reduceByKey followed by a map. For our performance experiment, we vary input size from 500MB to 1TB by using an unstructured data made up of Zipf distribution over a vocabulary of 8000 terms. All runs are repeated 10 times. We compute a trimmed mean by removing the shortest 2 runs and the longest 2 runs, because the running time of DISC programs depends on various factors such as a warm up of HDFS cache, garbage collection, and network I/O. In big data systems, a variation of 5% is considered noise, because of these factors.
5.1
Scalability
We perform experiments to show that B IG D EBUG scales to massive data, similar to Spark. More specifically, we assess the scale up property—B IG D EBUG can ingest and process massive data and its running time increases in proportion to the increase in data size. We assess the scale out property—as the number of worker nodes (the degree of parallelization) increases, the running time decreases. Scaling Up. Figure 11(a) shows the scale-up experiment while varying the data size from a few gigabytes to one terabyte. In this experiment, B IG D EBUG is used with the maximum instrumentation where breakpoints and watchpoints are set in every line and latency monitoring, crash remediation, and data provenance are enabled for every record at every transformation. The running time of B IG D EBUG grows steadily in proportion to the running time of Spark. As the data size increases, B IG D EBUG’s running time also increases, because large input data requires the scheduler to create more tasks, assign the tasks to workers, and coordinate distributed execution to improve data locality, throughput, and HDFS caching. With such maximum instrumentation, B IG D EBUG scales well to massive data (1TB). Figure 11(b) shows the overhead in WordCount. B IG D EBUG takes 2.5X longer on average in comparison to the baseline Spark. This 2.5X overhead is a very conservative upper bound, as a developer may not need to monitor the latency of each record at every transformation and may not need to set breakpoints on every operator. When disabling the most expensive feature, record-level latency monitoring, B IG D EBUG poses an average overhead of 34% only. In Grep and L1, the overheads are 1.76X and 1.38X with the maximum instrumentation and 7% and 29% respectively when latency monitoring is disabled (see Table 1). Benchmark
Dataset(GB)
PigMix L1 Grep Word Count
1, 10, 50, 100, 150, 200 20, 30, 40, . . . 90 0.5 to 1000 (increment with a log scale)
Max 1.38X 1.76X 2.5X
Overhead w/o Latency 1.29X 1.07X 1.34X
Table 1: Performance Evaluation on Subject Programs
5.5 B IG D EBUG − M aximum ApacheSpark
400
B IG D EBUG’s Maximum Overhead
5 4.5
1,000
100
4
300
3.5 3 2.5 2
100
50
0
1,000
200
100
0.5 10
250
150
1.5 1
1
1
10
100
1,000
2
(b) Maximum Instrumentation 50
Watchpoint Overhead on 40GB Dataset
40
900
Traditional Breakpoint Simulated Breakpoint
500 400
Overhead(%)
T ime(s)
700
Overhead(%)
50
800
5 6 W orkers
7
8
70 60
1,000
4
(c) Scale Out
1,100
600
3
Dataset(GB)
Dataset(GB)
(a) Scale Up
10GB 30GB 50GB
Baseline Spark 10GB Baseline Spark 30GB Baseline Spark 50GB
350
T ime(s)
Times of Apache Spark
T ime(s)
10,000
30
20
Tracing+Crash Monitoring+Watchpoint Tracing Crash Monitoring Watchpoint
40 30 20
300
10
200
10
100 0
1 2 3 4 Instructions with breakpoint (out of 5)
5
0
0
500
1,000
1,500
2,000
2,500
Data captured with watchpoint (MB)
0 20
40
60 Dataset(GB)
80
(d) Traditional vs. Simulated Breakpoint (e) Watchpoint (f) Overhead Per Feature Figure 11: B IG D EBUG’s Scalability and Overhead Scaling Out. The property of scaling out is essential for any DISC system. We change the number of worker nodes (essentially the total number of cores) on a fixed size dataset and record a running time for both B IG D EBUG and the baseline Spark. As the number of cores increases, the running time should decrease. Figure 11(c) shows that B IG D EBUG does not affect the scale-out property of the baseline Spark. When there are too many workers, it makes it hard for the Spark scheduler to retain locality, and B IG D EBUG also ends up moving data around at stage boundaries between workers.
5.2
Overhead
We measure the overhead as the increase in the running time of B IG D EBUG w.r.t the baseline Spark. The performance overhead comes from instrumentation and communication between the driver and the workers and data transfer to carry the requested debug information to the user. B IG D EBUG works at the record level. Therefore, the overhead increases in proportion to the number of records in each stage. For example, when the WordCount program splits input lines into a bag of words at the flatmap transformation, the overhead increases. Simulated Breakpoint. B IG D EBUG offers almost 0% overhead to pause and instantly resume. This overhead is the same across all subject programs because instantly resuming simulated breakpoint does not involve any additional instrumentation. On the other hand, a traditional breakpoint adds overhead because it must pause and cache the intermediate state entirely. Figure 11(d) shows the comparison results between simulated breakpoints and traditional breakpoints, while setting a breakpoint at different transformations. Traditional breakpoints incur orders of magnitude higher overhead, since they materialize all intermediate results regardless of whether a user requests them or not. For example, a traditional breakpoint’s overhead rises sharply after a flatmap transformation that emits a large number of unaggregated records. On-Demand Watchpoint. We place a watchpoint between two instructions such that a custom guard reports only a certain percent-
age of intermediate results, e.g., 2%, 5% , 10% etc. Once captured, the intermediate data is sent to the driver for a user to inspect. In Figure 11(e), the x-axis shows the amount of captured data ranging from 500MB to 3GB, when the total intermediate data size is 40GB. When 500MB of data is transferred to the user at the watchpoint, it incurs only 18% overhead. This is a very conservative set up, since the user is unlikely to read 500MB records at once. To isolate the overhead of setting watchpoints from the overhead of data transfer, we set a watchpoint at every transformation with a guard that always evaluates to false. Among all subject program, WordCount poses the maximum overhead of 9% on average, whereas the overhead for Grep and L1 is 5% and 3% respectively. Crash Monitoring. We enable crash monitoring for every transformation and vary the data size from 20GB to 90 GB to measure overhead. See Figure 11(f). Crash monitoring imposes 19% overhead in L1. WordCount and Grep incur a lower overhead of 18% and 4% respectively. This overhead comes from monitoring every record transformation for any kind of a failure, and checking if there are any pending crashed records to be repaired at the end of local execution in a task. Backward and Forward Tracing. We enable record-level data provenance capturing for every transformation and vary the data size from 20GB to 90GB. See Figure 11(f). The tracing primitive poses, on average, 24% overhead over the baseline Spark in L1. WordCount and Grep pose, on average, 22% and 5% overhead respectively. The majority of the overhead comes from the generation of the data provenance tables maintaining the associations between input and output record identifiers. The cost of storing each data provenance table into Spark’s storage layer is small, because it is performed asynchronously. Fine-Grained Latency Alert. We enable record-level latency monitoring on every transformation. Record-level latency monitoring incurs the highest overhead among B IG D EBUG’s features. Latency monitoring alone takes 2.4X longer than baseline Spark on data size varying from 500MB to 1TB (see Figure 12(a)) in Word-
5.5
8
Latency Alert
4 3.5 3 2.5 2 1.5 1 0.5 0
7
Records Per Task Execution Time
240
200
200
150
5 4
160
10
100
1,000
2
2,000
Datasize(GB)
(a) Latency Alert Overhead
100
3 120
50
80
0
1 1
B IG D EBUG Arthur
6 T ime(s)
T imesof ApacheSpark
4.5
T ime(s)
Average Records Per Task (M illions)
5
4,000
6,000
8,000
10,000
S1
Number of Tasks in Job
(b) Localizability vs. Performance
S2 S3 Location of crash (Stage)
S4
(c) Time Saving
Figure 12: Latency monitoring overhead, time saving through crash remediation, and localizability improvement Count. In Grep and L1, the overhead is 1.74X and 1.24X. The significant overhead comes from performing a statistical analysis for each record transformation. A timestamp is recorded before and after the transformation of each record to see if its latency lies within 2 standard deviations from the average. The overhead is also incurred by updating a moving average and a standard deviation. If we disable record-level latency monitoring from the maximum instrumentation setting, the overhead decreases from 150% (i.e., 2.5X of baseline Spark) to 34% (i.e., 1.34X of baseline Spark) in the case of the WordCount program.
5.3
Crash Localizability Improvement
Spark reports failures at the level of tasks, while B IG D EBUG reports specific failure-inducing inputs. B IG D EBUG also detects specific straggling records, while Spark only reports a straggler task causing delay. By construction, our record-level tracing approach has 100% accuracy with zero false positive because it leverages data provenance to identify all inputs contributing to a failure. Delta Debugging [39] can further isolate this combination of multiple failure-inducing inputs, but will require a larger number of runs, as opposed to B IG D EBUG that requires only a single run. Therefore, we measure the improvement in localizing failed (or delayed) records in comparison to the baseline Spark. When debugging a program using Spark, a developer may want to increase the number of tasks to improve fault localizability at the cost of running time. Note that the running time increases as you increase the number of tasks, since more resources are used for communication and coordination among distributed worker nodes. To quantify this, we vary the number of tasks and measure the average number of records per task and the total running time. See Figure 12(b). When configuring Spark with 1000 tasks and 60GB dataset, each task handles 7.52 million records on average. If a single record among 7.52 million records crashes the task, it is impossible for a human being to identify a crash culprit. To improve fault localizability, if a developer increases the number of tasks from 1000 to 10,000 to reduce the number of records assigned to each task, each task still handles 0.72 million records, and additional communication and coordination increases the total running time by 2.5 times. As Figure 11(f) shows, B IG D EBUG incurs less than 19% overhead for reporting crash culprits and takes only 2.4X time for latency alert, while improving fault localizability by orders of millions.
5.4
Time Saving through Crash Remediation
When a task crashes, the current Spark does not provide any output to the user, even for successful inputs and terminates the task immediately. On the other hand, B IG D EBUG allows a user to remove or modify a crash culprit at runtime to avoid termination. Therefore, B IG D EBUG avoids additional runs when a user tries to
remove crash-inducing records from the original input. For the same scenario, using a post-hoc instrumentation replay debugger Arthur [13] requires at least three runs. In the first run, a program crashes and Spark reports failed task IDs. In the second run, a user must write a custom post-hoc instrumentation query (a new data flow graph) with those failed task IDs and run the query to recompute the intermediate results for the failed tasks. In the third run, a user removes the crash-inducing records and re-runs the job again. Crashes in later stages result in more redundant work in the second and third runs and hence more time for completion. When a crash occurs at the 9th stage of a 10 stage job, Arthur must recompute the first 9 stages twice, while B IG D EBUG avoids such re-computation completely by allowing a user to resolve crashes in the first run. Figure 12(c) shows our experiment result on time saving. We compare B IG D EBUG’s time saving with a post-hoc instrumentation replay debugger like Arthur. We conservatively estimate Arthur’s performance by running the original Spark for its first and third runs. We measure time saving by dividing the additional time required by Arthur by B IG D EBUG’s completion time. We seed crashes in different transformation locations by updating an original program to throw an exception at a given stage, because the magnitude of time saving depends on which stage a crash occurs. For example, we replace the map function {word => (word,1)} with {word=> if(word == "Crash") crash(); (word,1)} where crash() always throw a NullPointerException. S1 is a program where crashes are seeded in the first stage, S2 is a program where crashes are seeded in the second stage, etc. B IG D EBUG saves the execution time by 80% on average and reaches up to 100% after S2. In the experiment, the most time consuming stage is S2 and a crash in S2 or later saves a large amount of time.
6.
RELATED WORK
Debugging Needs for DISC. Fisher et al. [15] interviewed 16 data analysts at Microsoft and studied the painpoints of big data analytics tools. Their study finds that a cloud-based computing solution makes it far more difficult to debug. Data analysts often find themselves digging through trace files distributed across multiple VMs. Zhou et al. [40] manually categorize 210 randomly sampled escalation of a big data platform at Microsoft. The study finds that 36.2% of in-field failures (i.e., escalations) are caused by system-side defects, which include logical and design errors of DISC applications. Job failures and slowdowns are common in DISC applications, accounting for 45% and 27% of the escalations. These findings motivate B IG D EBUG. Execution Log Analysis of DISC applications. Several approaches help developers debug DISC applications by collecting
and analyzing execution logs. Boulon et al. [11] monitor Hadoop clusters at runtime and store the log data. Their system collects logs for understanding a runtime failure, but does not provide realtime debug primitives. Developers typically develop DISC applications using a small sample of data in a local mode or a pseudo cloud environment first and deploy the application on a larger cloud with a considerably larger data set and processing power. Shang et al. [34] compare the execution log captured on the cloud with the log captured using a local mode. Their system abstracts the execution logs, recovers the execution sequences and compares the sequences between the pseudo and cloud deployments. Tan et al. [35] analyze Hadoop logs to construct state-machine views of the program execution to help a developer understand a Hadoop execution log. Their approach computes the histogram of the duration of each state and detects anomalies in the program execution. Xu et al. [37] parse console logs and combine source code analysis to detect abnormal behavior. Fu et al. [16] map free-form text messages in log files to logging statements in source code. None of these post-mortem log analysis approaches help developers debug DISC applications realtime. Debuggers for DISC applications. Inspector Gadget [30] is a framework proposal for monitoring and debugging data flow programs in Apache Pig [31]. The proposal is based on informal interviews with ten Yahoo employees who write DISC applications. While Inspector Gadget proposes features such as step-through debugging, crash culprit determination, tracing, etc., it simply lists desired debug APIs, but leaves it to others to implement the proposed APIs. The tracing API proposed by Inspector Gadget targets coarse-grained off-line tracing using a centralized server, falling behind B IG D EBUG’s ability to trace individual records at runtime. Arthur [13] is a post-hoc instrumentation debugger that targets Spark and enables a user to selectively replay a part of the original execution. However, a user can only perform post-mortem analysis and cannot inspect intermediate results at runtime. It also requires a user to write a custom query for post-hoc instrumentation. To localize faults, Arthur requires more than one run. For example, to remove crash-inducing records from the original input, in the first run, a program crashes and Spark reports failed tasks IDs. In the second run, a user must write a custom post-hoc instrumentation query (a new data flow graph) with those failed task IDs and run the query to recompute the intermediate results for the failed tasks. In the third run, a user removes the crash-inducing records and reruns the job again. Such post-hoc instrumentation incurs significant debugging time, as demonstrated by Section 5.4. Recon [25] opts for a post-hoc instrumentation strategy like Arthur. Graft [32] is a debugger for a graph-based DISC computing framework, Apache Giraph [2]. Graft requires a user to select vertices—similar to executors in Spark—to capture events and replay the execution later. Graft assumes that a user has adequate prior knowledge to know buggy vertices. Similar to Arthur, Graft is a post-hoc instrumentation debugger. Moreover, Graft is built for processing graphs only and is not applicable to a data flow framework, like Spark. Daphne [23] lets users visualize and debug DryadLINQ programs. It provides a job object model for viewing the running tasks and enables a user to attach a debugger to a remote process on the cluster. This approach works in DryadLINQ because all communications between tasks is through disk. Such approach could work for Hadoop or MapReduce that persist intermediate results in the file system, but does not work for an in-memory processing framework such as Spark that achieves orders-of-magnitude better performance through in-memory processing and lazy evaluation. Data Provenance for DISC applications. There is a large body of
work that studies techniques for capturing and querying data provenance in data-oriented workflows [10]. RAMP [21] instruments Apache Hadoop with agents that wrap the user-provided map and reduce functions. RAMP agents store data provenance tables in HDFS, and enable a user to query data provenance data using Apache Hive [36] and Pig [31]. NEWT [27] captures data provenance tables and stores in MySQL clusters. A user must submit SQL queries to join data provenance tables in an iterative loop. Because both RAMP and NEWT do not store the referenced raw data, a user can see record identifiers only and cannot view intermediate results on the fly. B IG D EBUG supports fine-grained tracing by leveraging prior work on data provenance within Spark [22]. The data provenance capability used by B IG D EBUG is orders-of-magnitude faster, because it stores data provenance tables in-memory within Spark’s runtime and performs an optimized distributed join of the provenance tables. The design of an optimized, distributed join algorithm in Spark is a subject of another paper and is described elsewhere [22]. Data provenance alone cannot support realtime debugging, since a user needs primitives such as simulated breakpoints and guarded watchpoints to interact with a data parallel pipeline at runtime, and data provenance queries must be invoked in the context of crashes, failures, or a breakpoint. Replay Debugger. Replay debugging for distributed systems has been extensively studied [29, 24] through systems such as liblog [17], R2 [20], and DCR [8]. These systems are designed to replay general distributed programs, and thus recording all sources of non-determinism, including message passing order across nodes, system calls, and accesses to memory shared across threads. Their goal is to reproduce errors using the captured events. These replay debuggers incur significant overhead at runtime and even larger slowdown at replay time. In contrast, B IG D EBUG leverages the structure of a data flow graph to replay sub computations, and a partial replay is to support step-through debugging, while a program is still running. Frameworks like D3S [26], MaceODB [12] and Aguilera et al. [7] are distributed debuggers for finding framework bugs, not application bugs.
7.
CONCLUSION
Big data debugging is currently a painstakingly long and expensive process. B IG D EBUG offers interactive debugging primitives for an in-memory data-intensive scalable computing (DISC) framework. To emulate traditional step-wise debugging in the context of in-memory big data processing, B IG D EBUG offers simulated breakpoints and guarded watchpoints with little performance overhead. B IG D EBUG enables a user to determine crash culprits and resolve them at runtime, avoiding a program re-run from scratch. By leveraging fine-grained data provenance, B IG D EBUG reports the origin of a crash culprit and supports tracing intermediate results forward and backward at the record level. It scales to massive data in the order of terabytes, improves fault localizability by orders of millions than baseline Spark, and provides up to 100% time saving with respect to a posthoc instrumentation replay debugger. In terms of future work, we plan to construct Spark program benchmarks and conduct user studies with professional software engineers. Instead of having a user specify a guard for an ondemand watchpoint, extracting data invariants from intercepted intermediate results may be useful for helping the user debug a DISC program. Another area for future work is tool-assisted automated fault localization in B IG D EBUG. For example, with the help of automated fault localization, we envision that a user can isolate the trace of a failure-inducing workflow, diagnose the root cause of an error, and resume the workflow for only affected data and code.
Acknowledgements We thank the anonymous reviewers for their comments. Participants in this project are in part supported through NSF CCF1527923, CCF-1460325, IIS-1302698, CNS-1351047, and NIH U54EB020404. We would also like to thank our industry partners at IBM and Intel for their gifts.
8. [1] [2] [3] [4] [5] [6] [7]
[8]
[9]
[10]
[11]
[12]
[13]
[14]
[15]
[16]
[17]
[18]
[19]
REFERENCES Amazon s3. https://aws.amazon.com/s3/. Apache giraph. http://giraph.apache.org/. Hadoop. http://hadoop.apache.org/. Scala.tool.nsc. http://www.scala-lang.org/api/2.11.0/ scala-compiler/index.html#scala.tools.nsc.package. Spark. https://spark.apache.org/. Spark documentation. http://spark.apache.org/docs/1.2.1/. M. K. Aguilera, J. C. Mogul, J. L. Wiener, P. Reynolds, and A. Muthitacharoen. Performance debugging for distributed systems of black boxes. In ACM SIGOPS Operating Systems Review, volume 37, pages 74–89. ACM, 2003. G. Altekar and I. Stoica. Dcr: Replay debugging for the datacenter. Technical Report UCB/EECS-2010-74, EECS Department, University of California, Berkeley, May 2010. M. Armbrust, R. S. Xin, C. Lian, Y. Huai, D. Liu, J. K. Bradley, X. Meng, T. Kaftan, M. J. Franklin, A. Ghodsi, and M. Zaharia. Spark sql: Relational data processing in spark. In Proceedings of the 2015 ACM SIGMOD International Conference on Management of Data, pages 1383–1394. ACM, 2015. O. Biton, S. Cohen-Boulakia, S. B. Davidson, and C. S. Hara. Querying and managing provenance through user views in scientific workflows. In Proceedings of the 2008 IEEE 24th International Conference on Data Engineering, ICDE ’08, pages 1072–1081, Washington, DC, USA, 2008. IEEE Computer Society. J. Boulon, A. Konwinski, R. Qi, A. Rabkin, E. Yang, and M. Yang. Chukwa, a large-scale monitoring system. In Cloud Computing and its Applications (CCA ’08), pages 1–5, 10 2008. D. Dao, J. Albrecht, C. Killian, and A. Vahdat. Live debugging of distributed systems. In Compiler Construction, pages 94–108. Springer, 2009. A. Dave, M. Zaharia, and I. Stoica. Arthur: Rich post-facto debugging for production analytics applications. Technical report, University of California, Berkeley, 2013. J. Dean and S. Ghemawat. Mapreduce: Simplified data processing on large clusters. In Proceedings of the 6th Conference on Symposium on Opearting Systems Design & Implementation - Volume 6, OSDI’04, pages 10–10, Berkeley, CA, USA, 2004. USENIX Association. D. Fisher, R. DeLine, M. Czerwinski, and S. Drucker. Interactions with big data analytics. interactions, 19(3):50–59, May 2012. Q. Fu, J.-G. Lou, Y. Wang, and J. Li. Execution anomaly detection in distributed systems through unstructured log analysis. In Proceedings of the 2009 Ninth IEEE International Conference on Data Mining, ICDM ’09, pages 149–158, Washington, DC, USA, 2009. IEEE Computer Society. D. Geels, G. Altekar, P. Maniatis, T. Roscoe, and I. Stoica. Friday: Global comprehension for distributed replay. In Proceedings of the 4th USENIX Conference on Networked
[20]
[21]
[22]
[23]
[24]
[25]
[26]
[27]
[28]
[29]
[30]
[31]
[32]
Systems Design & Implementation, NSDI’07, pages 21–21, Berkeley, CA, USA, 2007. USENIX Association. S. Ghemawat, H. Gobioff, and S.-T. Leung. The google file system. In ACM SIGOPS operating systems review, volume 37, pages 29–43. ACM, 2003. J. E. Gonzalez, R. S. Xin, A. Dave, D. Crankshaw, M. J. Franklin, and I. Stoica. Graphx: Graph processing in a distributed dataflow framework. Proceedings of OSDI, pages 599–613, 2014. Z. Guo, X. Wang, J. Tang, X. Liu, Z. Xu, M. Wu, M. F. Kaashoek, and Z. Zhang. R2: An application-level kernel for record and replay. In Proceedings of the 8th USENIX conference on Operating systems design and implementation, pages 193–208. USENIX Association, 2008. R. Ikeda, H. Park, and J. Widom. Provenance for generalized map and reduce workflows. In In Proc. Conference on Innovative Data Systems Research (CIDR), 2011. M. Interlandi, K. Shah, S. D. Tetali, M. A. Gulzar, S. Yoo, M. Kim, T. Millstein, and T. Condie. Titian: Data provenance support in spark. Proc. VLDB Endow., 9(3):216–227, Nov. 2015. V. Jagannath, Z. Yin, and M. Budiu. Monitoring and debugging dryadlinq applications with daphne. In Parallel and Distributed Processing Workshops and Phd Forum (IPDPSW), 2011 IEEE International Symposium on, pages 1266–1273. IEEE, 2011. T. J. LeBlanc and J. M. Mellor-Crummey. Debugging parallel programs with instant replay. Computers, IEEE Transactions on, 100(4):471–482, 1987. K. H. Lee, N. Sumner, X. Zhang, and P. Eugster. Unified debugging of distributed systems with recon. In Dependable Systems & Networks (DSN), 2011 IEEE/IFIP 41st International Conference on, pages 85–96. IEEE, 2011. X. Liu, Z. Guo, X. Wang, F. Chen, X. Lian, J. Tang, M. Wu, M. F. Kaashoek, and Z. Zhang. D3s: Debugging deployed distributed systems. In Proceedings of the 5th USENIX Symposium on Networked Systems Design and Implementation, NSDI’08, pages 423–437, Berkeley, CA, USA, 2008. USENIX Association. D. Logothetis, S. De, and K. Yocum. Scalable lineage capture for debugging disc analytics. In Proceedings of the 4th annual Symposium on Cloud Computing, page 17. ACM, 2013. X. Meng, J. K. Bradley, B. Yavuz, E. R. Sparks, S. Venkataraman, D. Liu, J. Freeman, D. B. Tsai, M. Amde, S. Owen, D. Xin, R. Xin, M. J. Franklin, R. Zadeh, M. Zaharia, and A. Talwalkar. Mllib: Machine learning in apache spark. CoRR, abs/1505.06807, 2015. R. H. Netzer and B. P. Miller. Optimal tracing and replay for debugging message-passing parallel programs. The Journal of Supercomputing, 8(4):371–388, 1995. C. Olston and B. Reed. Inspector gadget: A framework for custom monitoring and debugging of distributed dataflows. In Proceedings of the 2011 ACM SIGMOD International Conference on Management of data, pages 1221–1224. ACM, 2011. C. Olston, B. Reed, U. Srivastava, R. Kumar, and A. Tomkins. Pig latin: a not-so-foreign language for data processing. In Proceedings of the 2008 ACM SIGMOD international conference on Management of data, pages 1099–1110. ACM, 2008. S. Salihoglu, J. Shin, V. Khanna, B. Q. Truong, and
[33]
[34]
[35]
[36]
[37]
[38]
[39]
[40]
J. Widom. Graft: A debugging tool for apache giraph. In Proceedings of the 2015 ACM SIGMOD International Conference on Management of Data, pages 1403–1408. ACM, 2015. J. Shafer, S. Rixner, and A. L. Cox. The hadoop distributed filesystem: Balancing portability and performance. In Performance Analysis of Systems & Software (ISPASS), 2010 IEEE International Symposium on, pages 122–133. IEEE, 2010. W. Shang, Z. M. Jiang, H. Hemmati, B. Adams, A. E. Hassan, and P. Martin. Assisting developers of big data analytics applications when deploying on hadoop clouds. In Proceedings of the 2013 International Conference on Software Engineering, ICSE ’13, pages 402–411, Piscataway, NJ, USA, 2013. IEEE Press. J. Tan, X. Pan, S. Kavulya, R. Gandhi, and P. Narasimhan. Salsa: Analyzing logs as state machines. In Proceedings of the First USENIX Conference on Analysis of System Logs, WASL’08, pages 6–6, Berkeley, CA, USA, 2008. USENIX Association. A. Thusoo, J. S. Sarma, N. Jain, Z. Shao, P. Chakka, N. Zhang, S. Antony, H. Liu, and R. Murthy. Hive-a petabyte scale data warehouse using hadoop. In Data Engineering (ICDE), 2010 IEEE 26th International Conference on, pages 996–1005. IEEE, 2010. W. Xu, L. Huang, A. Fox, D. Patterson, and M. I. Jordan. Detecting large-scale system problems by mining console logs. In Proceedings of the ACM SIGOPS 22nd symposium on Operating systems principles, pages 117–132. ACM, 2009. M. Zaharia, M. Chowdhury, T. Das, A. Dave, J. Ma, M. McCauley, M. J. Franklin, S. Shenker, and I. Stoica. Resilient distributed datasets: A fault-tolerant abstraction for in-memory cluster computing. In Proceedings of the 9th USENIX conference on Networked Systems Design and Implementation, pages 2–2. USENIX Association, 2012. A. Zeller and R. Hildebrandt. Simplifying and isolating failure-inducing input. Software Engineering, IEEE Transactions on, 28(2):183–200, 2002. H. Zhou, J.-G. Lou, H. Zhang, H. Lin, H. Lin, and T. Qin. An empirical study on quality issues of production big data platform. In International Conference on Software Engineering, Software Engineering In Practice (ICSE SEIP). IEEE, May 2015.