Interactive Program Debugging Robert F. Erbacher Department of Computer Science, LI 67A University at Albany-SUNY 1400 Washington Avenue Albany, NY 12222, USA
[email protected]
Interactive Program Debugging
Abstract The computer software industry is in a period of massive growth that shows no signs of diminishing as new markets are continuously identified and approached. Currently, the tools and techniques to aid in the development and debugging of software is extremely limited and has not kept pace with the needs of the software industry. Improvements have been made in the software design processes (through formal object oriented analysis and design techniques), performance tuning, and debugging of communication patterns. The basic debugging techniques and process, however, have remained largely the same with little advancement. What few tools and techniques are available to aid in the debugging process are rarely used by programmers due to high learning curves, slow generation of results, lack of perceived benefits, and the inability of the tool to grab the programmer’s focus and maintain it. We are investigating debugging techniques based on interactive computational steering and visual representation geared towards improving the debugging cycle in cognitively based ways such that users will be attracted to the tools sufficiently to avail themselves of the new capabilities they provide.
1. Introduction The computer software industry is in a period of massive growth that shows no signs of diminishing as new markets are continuously identified and approached. Naturally, these software environments are continuing to increase in complexity over time. As software systems become more complex and must handle ever increasing amounts of data, programmers are left with the burden of developing and maintaining these source code bases. In contrast, consumers are becoming frustrated with bug laden software.
This has the effect of putting great strains on the ability of programmer’s to identify errors and correct them. Currently, the tools and techniques to aid in the development and debugging of software is extremely limited and has not kept pace with the needs of the software industry. Valuable programmer resources are being wasted in debugging cycles that could more effectively be placed elsewhere if the debugging tasks could be simplified. Correcting this trend requires innovative approaches to assisting programmers during the debugging cycle to make them more productive both time wise and with respect to how thoroughly the application is tested and debugged.
Interestingly, while attention in recent years has focused more on serial systems than on concurrent systems, concurrent systems may be seeing a rebirth, albeit on a smaller scale in the form of SMP systems. With better support for SMP systems by both hardware and software manufacturers, these systems are providing an impressive price/performance ratio on high end systems. This trend is becoming particularly popular in the high end PC/NT market. With the trend for high end PC’s to eventually become mainstream, the use of SMP systems may eventually become ubiquitous. These factors indicate that new developments in debugging technology should support both serial and concurrent systems programming as newer applications will likely need to support both.
Our goal is to address these limitations in the development of innovative tools and techniques to aid users in the development and debugging process. There are four areas that we must address:
1. The ability of programmers to explore and test an application to ensure no errors result during its execution, even when given unexpected or exceptional input. 2. The ability of programmers to identify the cause of an error and to correct it.
3. The ability of programmers to use the environment effectively to accomplish the tasks at hand. 4. The ability of the environment to attract the attention of the programmer and maintain their focus on the debugging task and not on the interface or the environment 5. The applicability of the developed techniques across a range of hardware architectures. We are investigating debugging techniques based on interactive computational steering and visual representation geared towards improving the debugging cycle in cognitively based ways such that users will be attracted to the tools sufficiently to avail themselves of the new capabilities they provide. Through these novel mechanisms, programmer’s can identify and locate problems visually without the need for revisiting the code (as is done in a typical debugging cycle). Through steering the programmer can change the application environment to more thoroughly understand and test the algorithm.
The visual steering techniques we describe were originally developed for concurrent systems but were modified to support serial system. More specifically, our techniques provide interactive computational steering and direct manipulation of visual representations of the application. Our goal is to increase the interaction and thus the analysis and exploration of computation.
2. Previous Work Improvements have been made in the software design processes (through formal object oriented analysis and design techniques), performance tuning, and debugging of communication patterns. The basic debugging techniques and processes, however, have remained largely the same with little advancement. What few tools and techniques are available to aid in the debugging process are rarely used by programmers due to high learning curves, slow generation of results, lack of perceived benefits, and the inability of the tool to grab the programmer’s focus and maintain it.
The visual representation of data on both serial (Balsa [1]) and concurrent systems (Maritxu [2], IVE [3], Prism [4], VisCon [5]) has been given substantial attention. Visual representation of data in debugging, performance tuning, and application comprehension tasks has become common. However, the usefulness of the techniques has been greatly hindered by the limited application of interaction techniques and the limited scope of the data that is
represented. Almost no interaction techniques have historically been applied to these environments, particularly any type of interactive steering. The data representations have only been applied to the classical data types of linked lists, array data, and scalar data.
Interactive computational steering is a technique through which the user can change parameters on the fly to help direct the program execution to more interesting results and to gain greater understanding of the data [6]. Steering has been applied to many areas, both serial and parallel. Falcon provides steering of large-scale parallel programs to improve application performance and affect the applications execution behavior [7]. Progress is a toolkit for providing steering in any application through instrumentation, primarily geared towards steering long running parallel programs [8]. SCIRun is design to aid comprehension of cause-effect relationships in large scale computations [9, 10]. CUMULVS provides a general interactive steering environment through the implementation of a check pointing mechanism which provides fault tolerance and speeds error identification and correction [11, 12].
These environments have found that allowing the user to steer the environment aids understanding of the data and the effect of various parameters, improves application performance by directing execution around branches identifiable as not leading towards a viable solutions, aids detection of errors, aids comprehension of the algorithm and the theoretical basis of the algorithm, and improves performance through manual load balancing. All of these environments require that the user manually instrument the program, identifying code or data elements which the programmer believes will be desirable to be modified during execution. This limited use of instrumentation is due primarily to concerns of possible performance degradation and the need to maintain high rates of execution.
Unfortunately, interactive steering has seen little application to program visualization where it could prove quite beneficial in reducing debugging time. The importance of interactive program steering to researchers, especially of concurrent systems, is shown by Gu et al. [13]. Dynamic interaction with program parameters to tune the analysis process has likewise been shown [14]. These two tasks underlie the program development and debugging cycle and are intrinsic to improving the process.
These interaction philosophies can be very important to the development of effective and useful tools. The ability to examine data values and change those values during program execution to aid in understanding and in testing has
been widely used. Most serial debugging systems provide this ability as does the Poker environment [15] for concurrent systems. However, this modification is text based. If this capability is to be used it must be more accessible, especially for large quantities of data.
Changing data values during execution could prove to be very valuable. By allowing the user to specify not only a variable’s value explicitly but also the color that the value should generate, the programmer could easily watch the flow of data through the processors and observe where and how the value is modified. By this we mean that since we interactively steer a data elements value we will want to specify the color that specific values take on through control of the color map. This can be used to highlight unexpected values, tag values of interest, etc.
3. The VisCon Environment The VisCon environment is designed to provide an interactive computational steering environment for program comprehension and debugging. The goal of this environment places burdens on different issues than has been seen with previous steering environments. VisCon provides a fine grain instrumentation environment suitable for automatic instrumentation. The environment consequently incurs a greater performance hit than seen in the previously discussed steering environments. However, this fine grain instrumentation provides instant access to all variables in the application, a necessity for true debugging when it is not known where an error may occur within the application code or which variables will contribute to the error. The environment is not geared towards performance tuning and thus the performance is not an issue. The environment also does not currently provide mechanisms for identifying synchronization issues that are a major concern in concurrent programs.
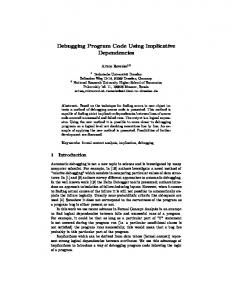
The environment is shown in Fig. 1. and consists of several main components. The application environment consists of the application code itself as well as the instrumentation instructions, which communicate with the VisCon environment. We use a fine grain instrumentation approach wherein each instruction in the application under investigation has an associated instrumentation instruction. The instrumentation instructions pass information about the operation just executed as well as pointers to any variables modified. These pointers can be used to retrieve data elements to be visualized or to modify data elements through steering. Note that any type of data element may be
Fig. 1: VisCon Environment architectural overview.
visualized or modified. However, the system currently does not directly support modifications of linked lists but this is a direct extension that can be added relatively simply.
The visualization component can be replaced with any visualization technique with no loss of generality. We currently only provide simple techniques for the visual representation of the data as data representation techniques have been explored extensively and was not the focus of this research.
The ability to provide multiple views of the visualization has also been shown to be an important component in visualization systems [16]. This allows users to examine the application under investigation from multiple varying perspectives. In our environment, each window maintains its own set of parameters and modifications independent from any other window. Any parameter that does not directly modify the applications data or execution can be viewed differently from each window. Parameters that do modify the applications data or execution are maintained in the window in which those modifications were made and will only be saved in conjunction with that window.
The next main component is the instrumentation instruction parser which retrieves the information passed by the instrumentation instructions and parses it, determining the meaning of the passed information and updating any visual representations dependent on the passed information. The environment interface will also be updated to
represent the variables currently available for visualization or modification. As variables are allocated and de-allocated this interface must be modified. Variable names are associated with the function in which they are initialized both internally and within the interface such that no confusion or loss of functionality results from the instantiation of multiple variables with the same name.
This component interfaces with the data modification component which is responsible for handling user steering instructions and modifying the data elements in the application data space, using data pointers provided by the instrumentation instructions. The data modification component is also related to the visualization component as the display must be updated to reflect the changing data components. It is imperative that the data modifications and their associated modifications to the visual display occur quickly and smoothly to give the user a comfortable experience while modifying data elements.
4. Application Steering An important goal for our work is to provide techniques that will allow the user to interact directly with the executing program and make changes without having to restart the program. Our desire was to provide capabilities to aid the user in gaining an in-depth understanding of the program in a timely fashion without having to waste time editing, compiling, and rerunning the program. To this end, we explored the applicability of interactive computational steering to the debugging of concurrent programs. We explored the use of steering on different levels of the executing program.
4.1.
Program Level Steering
At the highest level, the user can slow down or speed up the execution rate of the program. A VCR like control panel is used to control the execution rate (Fig. 2). The VCR controls provide the ability to increase or decrease the execution rate by factors of 1/100 or 1/10, to pause the program, and to restart the program. While the program can be slowed, even to a complete stop, we currently do not allow the program to run in reverse. Allowing reverse execution is a possibility since we are fully instrumenting the program but would require enormous data storage that we are unable to provide. Providing reverse execution would aid usability and should be available in a complete environment. This is not novel [17] and should not be difficult to incorporate given the storage caveat.
Fig. 2: Main interaction window with VCR controls
The modifications to the execution rate are handled by controlling the rate at which we return from an instrumentation instruction call. Each instrumentation instruction will call a common function which adds a precomputed delay, dependent on the execution rate selected by the user, before returning to the application under investigation. Reverse execution can be handled similarly by saving modified state information at each instrumentation instruction such that restoring the state of the environment at any particular point in time is a deterministic operation.
It is very often the case that important events greatly affecting the execution of a program and the resultant data occur so quickly and briefly that the user will miss the occurrence, especially when the user is focused on the execution as a whole. By providing the ability to speed up and slow down the execution rate the user can focus more attention on the period of execution where an error is believed to occur. In this fashion, the user can examine regions of interest in minute detail in order to understand exactly how the application generates a sequence of results. This is information that would be missed without this ability and greatly improves the usability of the environment by the user.
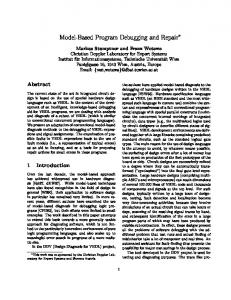
In association with this task, we provide the ability to display text representative of the instruction currently being executed, Fig 3. The figure shows the unique identifier associated with the instrumentation instruction followed by
Fig. 3: The image on the left shows the “Display Operation Text” option which enables the textual representation of application instructions as they execute. The image on the right shows the actual text displayed by the environment, at the bottom of the main window.
text describing the operation or library function being executed. This in association with our fine grain instrumentation allows the environment to identify the currently executing instruction within the application under investigation at any point in time. Thus, when the user does identify an error, the user can enable the textual representation and backtrack to the point at which data was first computed incorrectly and observe which instructions first cause the error. Context is aided by providing a unique identifier associated with each instrumentation instruction.
4.2.
Instrumentation Level Steering
At the next level, the user can interactively control the instrumentation. By default, the instrumentation instructions force a display update whenever a variable upon which the display is dependent is modified. The default display updates can lead to awkward animation of the display as temporary results also force the display to be updated with the corresponding data. Updating the display during these temporary computations often is not what is desired.
To reduce or even remove these artifacts the user can remove display updates from their default locations and force display updates at other locations. An example of this is shown in Fig. 4 in which an even-odd exchange sort is shown. The default instrumentation instructions cause updates to occur for intermediate results which generate unexpected displays.
Fig. 4: Example showing an even-odd exchange sort. The left image is unmodified and the intermediate result is shown. The duplication of pixel values is evident, a result of intermediate calculations. The middle image shows the expected visual without the duplication of pixel values. The right image shows the instrumentation control window and the available commands, accessed from the right mouse button.
Our ability to interactively modify instrumentation instructions while the program is running extends most work to date that has either incorporated full instrumentation of the program, without providing the user the ability to change
the instrumentation, or forced the user to adjust the instrumentation, recompile, and re-execute the program. Having to manually change the instrumentation instructions can be a very time consuming approach.
Internally, the program maintains a list of modified instrumentation instructions. Here again, we are dependent on the fine grain nature of our instrumentation paradigm. Each instrumentation instruction has a unique identifier associated with it, which is passed as a constant by the instrumentation instruction to the instrumentation instruction parser. This unique identifier helps individualize each instrumentation instruction. The internally maintained lists reference this unique identifier. When the user modifies an instrumentation instruction, a new element is added to the internal list and associated with this identifier. If the user modifies an instrumentation instruction more than once then only the first modification encountered in the list is executed.
As the modifications to the instrumentation are window dependent, the user can have multiple windows examining the same executing program. One window may be set to display an optimal animation through the removal of display updates based on intermediate computation and the addition of updates at the end of an iteration or other appropriate location. A second window can be geared towards only displaying intermediary computation, making it readily apparent when that intermediary computation is occurring. A third window can be used to show the unmodified display. Using such a multiple window approach gives the user unparalleled ability to select views of the application that are pertinent to the current task. The instrumentation modifications may also be removed on a window by window basis.
The user may save or restore the state of the environment (i.e., window settings, parameters, execution state, etc.) at any time, permitting the appropriate instrumentation modification to be reloaded to test a new program version under the same characteristics.
5. Dynamic Data Manipulation Our work concentrates on the steering of data elements within a concurrent program rather than the processors or communication network of the architecture. Typically, it is the data resulting from a computation that the scientist is interested in and it is the data from which the scientist will first be able to determine how the computation is
progressing. Did it execute correctly? Is incorrect data being generated? Is there some undesired, unexpected, or incorrect trend?
5.1.
Data Representation
Since our principal focus was on interactive computational steering we only provide very basic data representation techniques. Our interactive steering, however, will apply directly to any visual representation. The techniques we provide include a simple scatter plot technique and a representation of the data elements as greyscale intensities (Fig. 5). For the latter, if the data does not naturally take the form of a matrix then it is forced into matrix form, using row major order and organizing the data sequentially. Other types of data, i.e., linked lists, have been discussed in the literature [18]. Visualization techniques to handle these data types can be incorporated without any loss of generality. The user can interact with an executing algorithm in several windows. Each window can display the same or different variables. Several algorithms may be running at the same time.
5.2.
Technique
Direct data modification is a more conventional steering technique except we can apply it to all types of data (concurrent data, serial data, scalar values, array values, etc.) and allow entire regions of data to be modified simultaneously. The user can directly manipulate the data values of selected elements. By clicking the middle mouse button the user enacts the data modification operation. All values within the selected region have their values increased or decreased an amount corresponding to the distance the mouse is moved to the right or left.
Fig. 5: The left image shows a sample of the scatter plot representation. The right image shows a sample of the greyscale intensity representation
When data modification is enacted, a small window showing the values of the data elements surrounding the location where the user first clicked the middle mouse button is displayed. The actual numeric values of the data elements are shown. The background of the text boxes is set to be the greyscale intensity of the corresponding value (Fig. 6). The greyscale backgrounds provide for a more perceptually based representation. Since the background of the text box is much larger than the individual pixels in the visual display, the specific values of the elements are much more easily Fig. 6: Example display with data manipulation being performed
grasped. As values are changed, the display is updated to correspond with
the new values of the elements. If the user has a region of elements selected then all elements in that region will be modified. If, on the other hand, the user only wishes to modify a single element, then not having a region selected will modify only the element under the cursor.
To reduce the range of values the user is forced to deal with, we provide the ability to select the minimum and maximum range for all data interactions. The values of the data elements will be constrained to these boundary conditions. Setting multiple data elements to the same value is done by forcing all the elements to the minimum or maximum value in the preset range and then selecting the desired value.
Data manipulation is not strictly limited to concurrent or array data. Any variable ultimately may be modified. By modifying selective variables it is possible to control the flow of execution and to direct this flow to regions of code that need testing. For example, it is possible to change variables used in the test conditions of “if” statements to force execution down specific branches. It is also possible to modify variables used in the control expressions of loops, functions calls, etc. We place no limitation on what data values may be changed.
It is important to note that changing data values doesn’t always make sense. For example, consider a large application with many components. A common component of most applications is some form of sorting routine. It would make sense to modify data values before the sorting routine is called but doing so in the middle of the sorting
routine would generate unusual results. However, if one wanted to explore the impact of a hardware fault on the sort routine, one could force a data element to be fixed and watch its effect (see Sect. 5.3).
Providing for the modification of data elements makes it easier to test specific values. These values can be test conditions, boundary values, or any form of preconceived data to test the operation of the program. By combining data modification with data tagging [5], forcing a data element to be displayed in an alternative color so that its flow or impact can be followed, it is possible to modify data elements to specific values and then highlight those elements so they can be easily traced.
5.3.
Persistent Vs. Instantaneous Interaction
The data level steering capability can be applied in one of two ways. The method used in the description of the previous section deals with the more conventional approach that we term instantaneous interaction. We propose a modification to the conventional interaction technique that we term persistent interaction.
5.3.1. Instantaneous (Conventional) Interaction Techniques Typically, when a user interacts with the environment the modifications take place immediately and when the user discontinues interaction the modifications terminate. In our environment, when the user is modifying data elements, the modification stops when the user no longer holds down the middle mouse button. There is a one to one correspondence between the user’s action and the modification to the data elements.
This is the technique exemplified by the example in Fig. 6. This technique can be thought of as inserting particles into a field and allows the user to test the environment under unusual or unexpected conditions. If the user loads a data set that contains errors, how will the application behave? What about different combinations of even valid data, can the application handle all situations. Generating test data sets for all possibilities is a time consuming task. By providing the ability to create these test data sets interactively we are greatly increasing the efficiency of the user and maintains the users focus on the task at hand ensuring the testing and debugging process is completed more fully.
5.3.2. Persistent Interaction Techniques There are occasions when the instantaneous technique is insufficient. For example, a user may wish to have a region of values forced to a specific value continuously to change the characteristics of an algorithm or to change the
environment that the algorithm is attempting to simulate. For such cases we use the term “persistent interaction.” When a user switches to persistent interaction mode the data modification process remains identical to what has been described previously. Internally however, instead of merely making the noted changes to the data elements, we maintain a list of all the persistent interactions made. Whenever an instrumentation instruction is executed which indicates a persistently modified variable has changed, the values of the elements are reset to the values initiated by the persistent modification. Note that only data elements that were specifically modified are reset; all other elements of the variable remain unchanged. When restarting an algorithm, the environment maintains the persistent interactions in effect. Thus, after a set of desirable interactions is designed, the user can restart the algorithm from the beginning to examine the execution of the algorithm with these new characteristics from start to finish.
The method we use to incorporate persistent interaction into our environment is fundamental. We applied a common metaphor often used to continuously rotate 3D models. If the cursor is moving when the user releases the middle mouse button then the persistent mode of interaction will be selected. Otherwise, the instantaneous mode is selected. This interaction metaphor maintains the direct manipulation philosophy of the environment without losing the ability to choose between the instantaneous or persistent modes. To make the environment easier to use for all users we do support a toggle that will force the persistent interaction mode.
Fig. 7: Example of the applicability of the persistent interaction technique to a heat dissipation algorithm.
Fig. 7 shows an example of the applicability of the persistent interaction technique. This example shows a heat dissipation algorithm. The images on the left shows the initial configuration. There is a slotted barrier in the middle of the configuration, a source at the top, and a sink at the bottom. The sources and sinks are merely data elements that have their values fixed to maxima or minima. The images on the right show an example in which we have dynamically added a new source by selecting a region of elements and fixing them to a maxima using the persistent interaction technique. This technique is beneficial in aiding users to quickly and efficiently test their environment under a variety of different configurations during the testing and evaluation stage of the development cycle. We can then test the environment with sources, sinks, and barriers in any configuration to ensure the environment does not fail.
6. Dynamic Instruction Modification The interaction paradigm described below allows the modification of any and all operations during the execution of an application. It may be performed both at the instruction level and at the equation level; i.e., modifying an assignment operation. In locations where user changes to an instruction occurs, the environment must provide some form of visual feedback to indicate when those modified instructions are being executed. This can be as simple as a flash of the display or a led indicator in the status bar of the display window.
When the user wants to modify an instruction, the user stops the executing program and brings up the instruction editor. The user types in the new operation or equation that then gets stored in a list in association with the original instruction (Fig. 8 and Fig. 9). An interpreter and parser then execute on the newly entered equation to evaluate it whenever necessary. It can also be pre-parsed to make execution quicker.
The user should be able to change any instruction within the program and at any level. Namely, the user should be able to change not only a single operation within an equation but also the entire equation with a single replacement equation, i.e., the user should be able to modify the assignment operation rather than having to modify each operation originally in the equation individually. If the user modifies an instruction more than once then the last modification is the only one that actually executes, otherwise confusion will occur. This technique can be quite useful in some algorithms, such as selecting the partition element in quicksort. For a particular data set, the user may
Fig. 8: Example of instruction modification in action. The image on the left shows random values being generated. The image on the right shows that the generation of values has been modified to be equal to a variable called “counter”, which is in fact the loop counter. Since the loop counter generates values outside of our expected range of 0..255 the elements are highlighted in red.
wish to try out different partition element determiners, since the partition element greatly affects the rate of execution of the algorithm. This technique allows modification to the routine dynamically without recompiling or even leaving the executing environment. The partition element is modifiable during execution to improve performance of a subset of the execution trial. This can be thought of as dynamic load balancing except we are modifying actual instructions or lines of code rather than merely reassigning data elements.
Fig. 9: This example shows the refinement process involved in modifying instructions. In Fig. 8 we found that we were generating values outside of our expected range. In the image on the left we modify our instruction to modulos the variable by 256. This gives us values back in our expected range of 0..255. The image on the right shows the removal of the modified instructions.
The following code segment shows how instrumentation instructions within a program can allow the modification of the algorithm. The equation to solve for a variable, res, is res=a*b+c+1. We add instrumentation instructions for each operation (*, +, +, and =). The user can modify a single operation; i.e., the user can change the multiplication to be division or the multiplication to be a whole equation in and of itself. Alternatively, the user can modify the assignment operation to change the entire equation as a whole in a single swoop. If you look at the sample code for the instrumentation instruction itself you can see that all the instrumentation instruction need do is check a database to see if the user has applied a modification to the instruction currently under investigation. If the user has applied a modification then the application uses the results of the modified instruction for the remainder of the computation rather than the original results. Otherwise, the application uses the original results. The way in which the environment adds instrumentation instructions ensures that the remainder of the equation will use the value returned by the instrumentation instructions correctly. This allows the instrumentation instruction to control completely the value used by the remainder of the equation.
#include #include int internal, opres; main() { int a, b, c, res; a=5; b=10; c=15; res=(opres=a*b, opres=instr(ID, MULT, a, b, opres) +c, opres=instr(ID, ADD, internal, c, opres)+1, opres=instr(ID, ADD, internal, 1, opres)), opres=instr(ID, ASSIGN, internal, internal, opres); printf("%d\n", res); } int instr(int ID, int type, int a, int b, int opres) { if (checkModified(ID)) internal=modifiedResults(ID); else internal=opres; return internal; }
7. Conclusions The visual, interactive techniques we have developed are a big step in program debugging research. The techniques are attractive and hands on, keeping user attention on the task at hand and keeping the user’s interest piqued during the testing and debugging process which tends not to be of interest to most programmers but is a necessity.
Use of the visualization and data steering techniques aid users in identifying where errors are being generated or provide a verification mechanism for showing that the application does in fact work as specified under various configurations and exceptional conditions. The instruction level steering allows users to modify the behavior of the algorithm from within the debugging environment. This eliminates the need to recompile the code for every little change, particularly when the user is unsure of whether the modification will completely correct the application. This greatly speeds the debugging process as the user no longer must exit the debugging environment, modify the code, recompile, and re-execute the program from the beginning, only to find that the program still does not act as expected. Removing so much of the unnecessary menial tasks from the debugging cycle will keep programmers more interested and less frustrated in the project, greatly increasing their efficiency. In the case of long running programs this technique has an even greater effect as the user has not left the locality of the error. In typical debuggers, once a modification is made the user is forced to continue examination of the program from the beginning. This is not the case with our environment.
Using fine grain instrumentation techniques provides data about the application and correspondingly capabilities in the debugging environment not otherwise available. With the instrumentation level steering we are providing capabilities that are generally not provided in even the best debugger. The goal is to ultimately provide a visual environment which can provide all the debugging capabilities typically provided by a standard debugger with the addition of steering capabilities that they do not provide, greatly improving the debugging and testing experience. This will hopefully improve the quality of code generated by these programmers and result in happier customers due to the reduction in the number of errors in the code and a reduction in the amount of maintenance that is required by the customers to upgrade and maintain the software, both personnel wise and cost wise.
Ultimately, our goal is to allow the user to very quickly identify points of interest within a program at which errors, faults, or trends are being generated by showing values of interest immediately rather than at the end of the program run and providing the user the tools needed to identify that the values are of interest. These techniques are geared towards aiding the analysis and debugging process and not merely for program learning. Our techniques move away from program animation techniques that required specialized animations be developed for each application or algorithm.
8. Future Work The environment as described is primarily a research tool and examines the ability to provide steering and visualization of a program for testing and debugging purposes. The environment must be extended to handle additional programmer needs. In addition, the techniques currently provided must be extended to be more robust and provide even greater functionality for the power programmer who wishes to test the environment under more stringent protocols. Some of the features that are needed include:
1. Methods for representing inter-process communication both for single processor and multiprocessor systems. 2. Methods for debugging synchronization issues which are inherent in most concurrent systems but are very dependent on timing issues and can be hidden with the use of instrumentation. 3. Extending region selection beyond merely rectangular grids. 4. Provide better context between the visualization environment and the currently executing instruction. 5. Provide breakpoint capabilities such that the user can visually identify where to insert a breakpoint. We are attempting to reduce the dependency of the programmer on the actual textual representation of the code and it is not clear how some capabilities can be implemented without this dependency. Additional work needs to be done to enable interaction with all types of data. The maintenance of consistent interaction metaphors with linked lists, data inconsistencies in concurrent environments, etc. Development of strategies and metaphors for identifying errors and the corresponding error likely the cause of a given visual artifact. In the typical debugging cycle in which programmers use simple print statements programmers build up an internal association between errors and the corresponding error messages and resultant effect on the program execution. This knowledge base is part of the cause for programmers not desiring to use more advanced debugging environments, the lack of experience and the need to learn a new knowledge base of cause and effect classes. If we can develop this knowledge base for them then we will have gone a long way to improving the debugging technology and getting programmers to actually use the debugging environment.
References [1]
M. H. Brown and R. Sedgewick, “Techniques for Algorithm Animation,” IEEE Software, Vol. 2, No. 1, 1985, pp. 28-39.
[2]
Eugenio Zabala and Richard Taylor, “Maritxu: Generic Visualisation of Highly Parallel Processing,” Programming Environments for Parallel Computing; Proceedings of the IFIP WG 10.3 Workshop on Programming Environments for Parallel Computing, Elsevier Science Publishers B.V., 1992, pp. 171-180.
[3]
Mark Friedell, Sandeep Kochhar, Mark LaPolla, and Joe Marks, “Integrated Software, Process, Algorithm and Application Visualization,” Journal of Visualization and Computer Animation, 1992.
[4]
Steve Sistare, Don Allen, Rich Bowker, Karen Jourdenais, Josh Simons, and Rich Title, “Data Visualization and Performance Analysis in the Prism Programming Environment,” Proceedings of the IFIP WG 10.3 Workshop on Programming Environments for Parallel Computing, Elsevier Science Publishers B.V., 1992, pp. 37-52.
[5]
Robert F. Erbacher, “Visual debugging of data and operations for concurrent programs”, Proceedings of the
SPIE ‘97 Conference on Visual Data Ecploration and Analysis IV, San Jose, CA, February, 1997, pp. 120-127. [6]
Robert van Liere, Jurriaan Mulder and Jack van Wijk., “Computational Steering,” Future Generation Computer Systems, Vol. 12, nr. 5, 1997.
[7]
Weiming Gu, Greg Eisenhauer, Eileen Kraemer, Karsten Schwan, John Stasko, Jeffrey Vetter, “Falcon: On-line Monitoring and Steering of Large-Scale Parallel Programs,” Frontiers 95, McLean, Virginia, February, 1995.
[8]
Jeffrey Vetter and Karsten Schwan, “Progress: a Toolkit for Interactive Program Steering,” Proceedings of the International Conference on Parallel Processing 1995, Oconomowoc, Wisconsin. August, 1995.
[9]
Jeffrey Vetter and Karsten Schwan, “Techniques for High-Performance Computational Steering,” IEEE Concurrency, pp. 63-74, Vol7. No. 4, 1999.
[10]
S.G. Parker, M. Miller, C.D. Hansen, and C.R. Johnson, “An integrated problem solving environment: The SCIRun computational steering system,” Proceedings of the 31st Hawaii International Conference on System Sciences (HICSS-31), volume VII, pp. 147-156, Jan. 1998.
[11]
J. A. Kohl, “Interacting with High-Performance Scientific Simulations Using CUMULVS: Visualization, Computational Steering, and Fault Tolerance,” Graduate Colloquium, Department of Electrical and Computer Engineering / CSE, University of Louisville, Louisville, KY, October 7, 1999.
[12]
J. A. Kohl, P. M. Papadopoulos, “Efficient and Flexible Fault Tolerance and Migration of Scientific Simulations Using CUMULVS,” Proceedings of the 2nd SIGMETRICS Symposium on Parallel and Distributed Tools, Welches, OR, August 1998.
[13]
Weiming Gu, Jeffrey Vetter, and Karsten Schwan, “An Annotated Bibliography of Interactive Program Steering,” Georgia Institute of Technology College of Computing Technical Report GIT-CC-94-15, 1994.
[14]
Richard Becker, Stephen Eick, and Allan Wilks, “Network Visualization,” AT&T Bell Laboratories, August 1994.
[15]
L. Snyder, “Parallel Programming and the POKER Programming Environment,” IEEE Computer, Vol. 17, No. 7, 1984, pp. 27-37.
[16]
Jonathon C. Roberts, “On Encouraging Multiple Views for Visualization,” Proceedings of the International Conference on Information Visualization ‘98, IEEE Computer Soceity Press, July, 1998, pp. 8-14.
[17]
Sue Utter-Honig and Cherri Pancake, “Graphical Animation of Parallel Fortran Programs,” Proceedings of Supercomputing ‘91, IEEE Press, 1991, pp. 491-500.
[18]
Takao Shimomura and Sadahiro Isoda, “VIPS: A Visual Debugger for List Structures,” in Proceedings of the 14th Annual International Computer Software and Applications Conference, IEEE Press, 1990, pp. 530-537.