this paper we present VIDA, a visual interactive debugging tool, which has been ... software development and maintenance budget. Therefore, the academic and ...
VIDA: Visual Interactive Debugging Dan Hao, Lingming Zhang, Lu Zhang, Jiasu Sun, Hong Mei Key Laboratory of High Confidence Software Technologies, Ministry of Education Institute of Software, School of Electronics Engineering and Computer Science, Peking University Beijing, 100871, P. R. China {haod, zhanglm07, zhanglu, sjs, meih}@sei.pku.edu.cn Abstract
The characteristics of these approaches are that these approaches use the execution information of test cases to calculate statements’ suspicions, which are to what extent statements are likely to contain faults, and then rank statements based on their suspicions. TBFL approaches are promising because these approaches reduce the scope of statements to be examined by a programmer and determine the examining order of statements for a programmer. Moreover, TBFL approaches have been evaluated to be effective [1] in fault localization. However, these TBFL approaches require a programmer to examine the statements along the ranked list during the debugging process. This debugging process supported by these TBFL approaches are far from the programmer’s conventional debugging process. That is one of the reasons why few TBFL approaches have been applied to programmer’s practice. In conventional debugging, a programmer finds the location of the faulty statement by setting breakpoints and examining the variables’ values at breakpoints. Although the choice of breakpoints affects the debugging effectiveness of a programmer, to our knowledge few researchers have studied how to help programmers choose breakpoints. Moreover, although the history information (such as the programmer’s estimation at previous breakpoints) may be helpful for the programmer in selecting the next breakpoint and making estimation at the next breakpoint, the programmer can hardly remember this history information. To address these two problems and help programmers debug in their conventional way, we have developed a Visual Interactive Debugging Aids (called VIDA), which is to recommend breakpoint candidates to a programmer continuously based on the analysis of the execution information of test cases and the programmer’s feedback on the existing breakpoints. VIDA has been implemented as an Eclipse Integrated Development Environment (abbreviated as IDE) plug-in, which deals with Java programs with Junit Test Cases. For a Java program with test cases, VIDA analyzes the execution information of test cases and then
Software debugging is time-consuming and effortconsuming. Although software debugging, especially faultlocalization, has been studied for long, few practical debugging tools have been developed and used by the industry. In this paper we present VIDA, a visual interactive debugging tool, which has been integrated with the Eclipse Integrated Development Environment to support a programmer’s debugging process. During the programmer’s conventional debugging process, VIDA continuously recommends breakpoints for the programmer based on the analysis of execution information and the gathered feedback from the programmer. Moreover, VIDA provides a program outline to help the programmer choose breakpoints and visualizes the static dependency relation to help the programmer make estimation at breakpoints.
1. Introduction Software debugging is inevitable as programmers cannot guarantee to write faultless source code. Moreover, software debugging is costly as it costs more than 50% [3] of software development and maintenance budget. Therefore, the academic and industry communities have paid much attention to software debugging. Software debugging consists of fault localization and correction. The former is to find the location of a fault, whereas the latter is to correct a fault by replacing the faulty statements with the correct ones. As the former is much more time-consuming than the latter [11], and the latter is human-intensive, most of the existing debugging research focuses on the former (fault localization), which is also the problem of this paper. Among various fault-localization approaches, testingbased fault-localization approaches (abbreviated as TBFL) [6, 9], also called spectrum-based fault-localization approaches [1], have attracted researchers’ attention.
ICSE’09, May 16-24, 2009, Vancouver, Canada 978-1-4244-3452-7/09/$25.00 © 2009 IEEE
583
recommends some breakpoint candidates to a programmer. Based on these breakpoint candidates, the programmer sets a breakpoint in the debugging mode of the Eclipse IDE. At each breakpoint, the programmer makes estimation on whether any of the examined variables’ values at the breakpoint is wrong. Then VIDA recommends another group of breakpoint candidates after analyzing the programmers’ estimation and the execution information of test cases. Besides recommending breakpoint candidates, VIDA has the another two features. First, VIDA provides a global view of the target program showing which statements are more likely to contain a fault by lines in different color, the positions of breakpoint candidates and the existing breakpoints that have been set previously. VIDA provides this global view because this view records the debugging history and can help a programmer set a breakpoint based on the candidates. Second, to help a programmer make estimation at breakpoints, VIDA visualizes the static dependency relation of the target program by a directed graph.
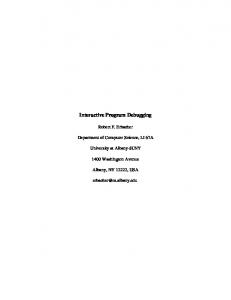
Program & Test Cases 1. Executing Test Cases 6. Static Dependency Analysis
Execution Information 3. Suspicion Calculation
Static Dependency
Suspicions 2. Test Case Selection
4. Breakpoint Candidate Recommendation Breakpoint
A Failed Test Case
5. Breakpoint Estimation Feedback
7. Suspicion Modification
Figure 1. Approach supported by VIDA
2. Related Work
the faulty statement by continuously recommending breakpoint 1 candidates to a programmer based on the execution information of test cases and the programmer’s feedback. Then we [5] proposed a simple approach based on this framework, which requires a programmer to provide confident estimation on whether the faulty statement has been executed before each breakpoint. However, in practice a programmer can hardly provide such estimation. Therefore, in this paper we propose another approach based on the interactive testing-based fault-localization framework [4] and implement this approach as an Eclipse plug-in. This approach supported by VIDA consists of seven steps, shown by Figure 1.
Besides our proposed VIDA, Tarantula, Delta Debugging, and Whyline are another two popular debugging tools. Tarantula [9] is a fault localization tool, which visualizes the suspicions of statements by different colors. In Tarantula, the statements in “red” are suspicious whereas the statements in “green” are innocent. Although with Tarantula a programmer can easily distinguish statements assigned with different suspicions because these statements are in different color, the approach supported by this tool is far from the programmer’s conventional debugging process. Delta Debugging [2] is an Eclipse plug-in, which targets at isolating the failure-inducing input, failure-inducing change, and failure-inducing states by systematically narrowing down the failure-inducing chain. Whyline [7] is an interactive debugging tool, which is designed to help a programmer to locate the fault by allowing the programmer to ask questions along the source code based on their dependency. Although all of these four tools address the same problem, the approaches supported by these tools are different. Moreover, the approach supported by VIDA is similar to algorithmic debugging [10], as both of them require feedback from programmers when being applied to locate faults. However, the approach supported by VIDA is more applicable as the programmers’ feedback required by VIDA usually can be gathered during conventional debugging.
1. Initially, our approach runs the program with its test cases, recording the execution information (i.e., statement coverage) of these test cases. 2. Based on the execution information, our approach selects a failed test case from the set of test cases. The following debugging process is to locate the faulty statement that causes the failure of this failed test case. 3. Based on the execution information, our approach calculates statements’ suspicions. 4. Based on the statements’ suspicions, our approach recommends several breakpoint candidates to the programmer. Then the programmer sets the breakpoint based on these candidates.
3. Approach supported by VIDA
5. Our approach gathers the programmer’s estimation at the breakpoint. The programmer’s estimation used by
The approach supported by VIDA can be viewed as an extension of our previous interactive testing-based faultlocalization framework [4], which is to locate the position of
1 In our previous work [4], we use term “checking point” to represent the similar meaning of “breakpoint”.
584
our approach includes whether variables’ values are wrong and whether the programmer is confidence with her estimation. 6. Based on the analysis of the target program, our approach constructs the static dependency graph of the target program. 7. Our approach modifies statements’ suspicions based on the programmer’s feedback and static dependency relation. Figure 2. Breakpoint candidates
Based on the modified suspicions computed by step 7, our approach will recommend another group of breakpoint candidates and repeat steps 3, 4, 5 and 7.
4. VIDA The debugging tool VIDA is not a standalone tool, which is implemented as an Eclipse IDE plug-in. Moreover, VIDA is designed to be used by a programmer in the debugging mode of the Eclipse IDE. Therefore, a programmer can use VIDA during her development process without switching to other tools or environments. The current version of VIDA supports programs in Java and test cases written in Junit. Due to space limit, we divide the seven steps of the approach supported by VIDA into two components: “Breakpoint computation” (consisting of step 1 to step 4 in Figure 1) and “Suspicion modification” (consisting of step 5 to step 7 in Figure 1), and then introduce them separately by the following two subsections.
Figure 3. Program outline
4.1. Breakpoint computation such as statements’ suspicions, the positions of these breakpoint candidates and the positions of the existing breakpoints. To help the programmer set a breakpoint, VIDA gives a program outline (Figure 3) showing the history information of the existing breakpoints including their position of these breakpoints and the programmer’s estimation on these breakpoints, as well as the positions of breakpoint candidates. Figure 3 uses long lines (in the middle of the window) in different color to show statements with various suspicions. A black line denotes a statement with large suspicion, whereas a light grey line denotes a statement with small suspicion. The breakpoint candidates are addressed by blue lines. On the left boundary of the window, the short lines denote the position of the existing breakpoints. The color of these short lines denote the programmer’s previous estimation on these breakpoints. Specifically, VIDA uses a red line to denote that the variables’ values at the corresponding breakpoint have been estimated to be wrong by the programmer, a green line denotes the variables’ values at the corresponding breakpoint have been estimated to be correct, and a yellow line denotes that the programmer is not confident with her estimation at the breakpoint.
When a program runs, VIDA collects the statement coverage information of test cases. Among the set of test cases, VIDA selects a failed test case that has executed the fewest statements because this failed test case contains few suspicious statement to be examined by a programmer. This selected test case is the starting point of the debugging process. The following debugging process is to locate the position of the faulty statement that causes the failure of this failed test case. Based on the statement coverage of test cases, VIDA calculates statements’ suspicions based on the algorithm of Tarantula [8], which has been evaluated to be effective in fault-localization. Currently VIDA adopts the algorithm of Tarantula, not SAFL [6] because the latter is more timeconsuming than the former. Various statements are assigned with different suspicions, which represent how likely a statement tends to be faulty. Then VIDA recommends 10 breakpoint candidates whose corresponding statements have the highest suspicions, which are shown by a table like Figure 2. The programmer’s choice on breakpoints depends on many factors,
585
5. Conclusion This paper introduces an Eclipse IDE plug-in VIDA, which aims at recommending breakpoint candidates to a programmer based on the analysis of execution information and the programmer’s estimation at breakpoints. Moreover, VIDA provides a program outline to record the debugging history and provides a static dependency graph to help the programmer make estimation at breakpoints.
6. Acknowledgements
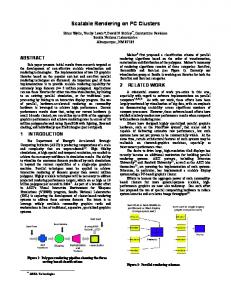
Figure 4. Dependency relation
This work is supported by the National Basic Research Program of China under Grant No. 2009CB320703, the High-Tech Research and Development Program of China under Grant No. 2007AA010301, the Science Fund for Creative Research Groups of China under Grant No. 60821003, the National Natural Science Foundation of China under Grant No. 60803012, and China Postdoctoral Science Foundation funded project (No. 20080440254).
4.2. Suspicion modification After the programmer sets a breakpoint based on the breakpoint candidates, VIDA collects the programmer’s estimation on the current breakpoint and modifies statements’ suspicions based on the programmer’s estimation. To help a programmer make estimation at breakpoints and help modify statements’ suspicions, VIDA constructs and stores the static dependency relation of the target program. Figure 4 shows the static dependency of a piece of code. A node of the dependency graph denotes a statement of the program, whereas an edge between nodes denote the dependency relation between statements. Moreover, the node at the tail of an edge is dependent (including control dependent and data dependent) on the node at the arrow end of an edge. A black edge denotes data dependency, whereas a blue edge denotes control dependency. The static dependency graph can help a programmer make estimation at breakpoints by showing the statements that influence the execution of the statement at the breakpoint and that influence the variables’ values at the breakpoint. Each breakpoint may contain more than one variable. VIDA does not require a programmer to examine all the variables’ values, but some variables that the programmer chooses to examine. The programmer’s feedback to be submitted to VIDA is whether any of the examined variables’ values is wrong. Besides this, VIDA requires the programmer to mark whether she is confident with her estimation. If the programmer thinks that all the examined variables have been assigned with correct values, then VIDA will decrease the suspicions of the statements that influence the statement at the breakpoint based on the static dependency relation; Otherwise, VIDA will increase the suspicions of the statements that influence the statement at the breakpoint. Moreover, if the programmer is confident with her estimation, VIDA will significantly increase or decrease some statements’ suspicions. If the programmer is not confident with her estimation, VIDA will slightly increase or decrease some statements’ suspicions.
References [1] R. Abreu, P. Zoeteweij, and A. J. C. van Gemund. On the accuracy of spectrum-based fault localization. In Testing: Academic and Industrial Conference Practice and Research Techniques, pages 89–98, September 2007. [2] H. Cleve and A. Zeller. Locating causes of program failure. In Proc. 27th ICSE, pages 342–351, 2005. [3] J. S. Collofello and S. N. Woodfield. Evaluating the effectiveness of reliability-assurance techniques. Journal of Systems and Software, 9(3):191–195, 1989. [4] D. Hao. Testing-based interactive fault localization. In Proc. 28th ICSE, Doctoral Symposium Track, pages 957– 960, May 2006. [5] D. Hao, L. Zhang, H. Mei, and J. Sun. Towards interactive fault localization using test information. In Proc. 13th APSEC, pages 277–284, 2006. [6] D. Hao, L. Zhang, Y. Pan, H. Mei, and J. Sun. On similarityawareness in testing-based fault-localization. Journal of Automated Software Engineering, 15(2):207–249, June 2008. [7] A. J.Ko and B. A. Myers. Debugging reinvented: Asking and answering why and why not questions about program behavior. In Proc. 30th ICSE, pages 301–310, May 2008. [8] J. A. Jones and M. J. Harrold. Empirical evaluation of tarantula automatic fault-localization technique. In Proc. 20th ASE, pages 273–282, 2005. [9] J. A. Jones, M. J. Harrold, and J. Stasko. Visualization of test information to assist fault localization. In Proc. 24th ICSE, pages 467–477, May 2002. [10] E. Y. Shapiro. Algorithm Program Debugging. MIT Press, Canbridge, 1983. [11] I. Vessey. Expertise in debugging computer programs: A process analysis. International Journal of Man-Machine Studies, 23(5):459C494, 1985.
586