Construction Research Congress 2012 © ASCE 2012
Binary and Multi-class Classification of fused LIDAR-Imagery Data using an Ensemble Method Seyed Hossein Hosseini NOURZAD1, Anu PRADHAN2 1
PhD candidate, Department of Civil, Architectural and Environmental Engineering, Drexel University, 3141 Chestnut St., Philadelphia, PA 19131; PH (215) 429-0700; email:
[email protected] 2 Assistant Professor, Department of Civil, Architectural and Environmental Engineering, Drexel University, 3141 Chestnut St., Philadelphia, PA 19131; PH (215) 571-3540; email:
[email protected] ABSTRACT Airborne Light Detection and Ranging (LIDAR) data is used for multiple applications, such as urban planning, emergency response, flood control, and city 3D reconstruction. The LIDAR data in its raw form needs to be classified for the above applications. There are two types of classifications: binary and multi-class. In the binary classification, the given LIDAR data is classified into two classes: terrain or non-terrain. In the multi-class classification, the given data is classified into multiple classes, such as ground, vegetation (low, medium, and high), and buildings. Although different techniques have been developed to address the challenges in LIDAR data applications in the last two decades, no single algorithm gives the best result. In this paper, we presented two Ensemble methods (Bagging and AdaBoost) that combine multiple algorithms in an intelligent way. These methods were developed and evaluated using 100 decision trees as the weak classifiers and combination of both point and neighborhood features. The authors were able to achieve the accuracy up to 98.9% for the binary classification and 94.6% for the multi-class classification. While AdaBoost performed slightly better that Bagging, the Bagging was more resistant to over-fitting. 1. INTRODUCTION Topography data obtained from airborne LIDAR is used to generate accurate high-resolution digital elevation models (DEMs) compared to land-based surveying and other remote sensing techniques. The generation of DEM is one of the fastest growing applications of LIDAR data. In addition to DEM, the LIDAR data has been used for a wide range of applications, such as hydrological modeling, flood prediction, geomorphometry, mapping ice-sheet and creating digital city models (Meng et al. 2010). In almost all the LIDAR data applications including the generation of the DEM, one needs to classify the LIDAR data points into the terrain points on the bare earth and different non-terrain points associated with vegetation, buildings and other man-made objects above the ground. So, this classification task can be either binary or multi-class classification. The binary and multi-class classifications of the airborne LIDAR data have proved to be challenging. The object complexities, detached objects, vegetation and discontinuities can considerably influence the performance of these algorithms. At present, filtering and processing of LIDAR data is a semi-automated approach that requires parameter tuning, and
909
Construction Research Congress 2012 © ASCE 2012
manual identification and editing of the algorithms. Such approach is reported to be time consuming as it requires a considerable amount (e.g., 60%) of processing time to ensure the quality of the data (Sithole and Vosselman 2004). To classify LIDAR data, different approaches have been developed by applying either a single classifier or an ensemble of classifiers on single or multiple data sets. For example, various algorithms based on the morphological, slope-based, and machine-learning techniques (Meng et al. 2010; Makarau et al. 2011; Vatsavai et al. 2011) were developed to perform binary classification. To further improve the classification accuracy, different data sets, such as panchromatic aerial photos and multispectral images (Csatho et al. 2003) and hyper-spectral images (Dalponte et al. 2008) were combined with LIDAR data. However, the classification accuracy varied significantly on different data sets representing different terrain types (Sithole and Vosselman 2004). In this paper, we implemented two Ensemble methods (AdaBoost and Bagging) using different features (e.g., height) extracted from LIDAR data and satellite (color) images. The results have shown that the Ensemble methods can deal with both binary and multi-class classifications. By combining 100 decision trees (each of which is accurate up to 60%), the accuracy of the final model is 98.6% and 94.6% for binary and multi-class classifications. 2. BACKGROUND RESEARCH The LIDAR classification problem can be grouped into two categories: (1) binary classification (or bare-earth extraction) in which the LIDAR point cloud is classified into terrain or non-terrain points, and (2) multi-class classification in which the LIDAR point cloud is classified into more than two classes (i.e., multiple classes). 2.1 Binary Classification (Bare-Earth extraction) Some researchers applied a single classifier using a single data set for binary classification of LIDAR data (Sithole and Vosselman 2004). For example, Elmqvist et al. developed a surface estimation method using variation in height extracted from LIDAR data (Elmqvist, Jungert et al. 2001). Some other researchers developed single classifier using a combination of multiple data sets (e.g., LIDAR, multi-spectral images) for LIDAR binary classification. For example, a multi-sensor data fusion approach was developed by combining LIDAR, aerial images and multispectral images (Csatho et al. 2003). Recently, an approach in which multiple classifiers are combined has also been investigated to classify LIDAR data. For example, Lodha and his colleagues developed different approaches for LIDAR data classification using Support Vector Machines, Expectation-Maximization, and AdaBoost (Lodha, Kreps et al. 2006; Lodha, Fitzpatrick et al. 2007; Lodha, Helmbold et al. 2007). 2.2 Multi-class Classification Different approaches were developed by applying a single or a combination of classifiers on a single or multiple data sets for the multi-class classification of LIDAR data. For example, different available data sources, such as satellite images (Huber et al. 2003), multispectral images (Makarau et al. 2011), and hyperspectral images (Dalponte et al. 2008) were fused with LIDAR data for multi-class classification purposes. Makarau et al. proposed a method based on the fusion of laser Digital
910
Construction Research Congress 2012 © ASCE 2012
Surface Model (DSM), texture, and multispectral images for multi-class classification of LIDAR data (Makarau et al. 2011). Their framework includes three main phases: (1) feature extraction from optical multispectral data, texture, and the DSM, (2) dimensionality reduction using K-means clustering, and (3) fusion of clustered features using a Bayesian Network or Neural Network. They compared performance of their method (INFOFUSE) with two other methods: Maximum Likelihood (ML) and Support Vector Machine (SVM). While the accuracy of ML and SVM were 82.07% and 72.53% respectively, they obtained 96.04% accuracy in their tests (Makarau et al. 2011). In addition, fusion of different algorithms was also explored to achieve better classification performance. For example, Fauvel et al. developed an approach to aggregate the results of two classifiers: a conjugate gradient neural network and a fuzzy classifier. While the overall accuracies of the individual classifiers are 57.0% for neural network and 43.1% for fuzzy, the accuracy of the aggregated classifier was 75.7% after the fusion (Fauvel et al. 2006). 2.3 Limitation of the existing methods Majority of the above-mentioned binary classification approaches are designed for binary classification, and thus are not able to deal with multi-class classification. These methods filter ground points by fitting a surface to them in a way that the resultant surface has the characteristics of the ground surface. The remained points are labeled as non-ground points. In addition, the mostly-used features in these approaches are derived from height, which is not successful in separating the points with similar elevation such as low vegetation and ground points. The limitations of the above-mentioned multi-classification approaches are generally in two categories: (1) the data set(s) which is (are) used by them, and (2) the classifier(s) that is (are) implemented in these processes. In terms of the data sets, some approaches used a single data source, while others used a combination of multiple sources. Although using a single data source is simpler, it is not accurate because the available features in a single source are not sufficient to classify the data. By using multiple sources we can take the advantages of different features. However, it has two issues. The first issue is the unavailability of the multiple sources for a given area. The second issue is the higher dimensionality (e.g. more than 200 bands as in the case of hyper-spectral images) which significantly increases the computational time. To address these limitations, we attempted to develop a framework that is capable of performing both binary and multi-class classifications. We circumvented the higher dimensionality owing to multiple data sources by leveraging two low dimensional data sources: LIDAR data (2 dimensions) and color images (3 dimensions). Color images are easily available for different geographic regions at publicly available websites (e.g., USGS) for free. To classify the points, we used two different ensemble based methods (i.e., Bagging and AdaBoost). 3. RESEARCH APPROACH The information available in each single data source reveals some aspects of the classes. There is no single source that has all the required information for classification. For example, height information can help to classify objects with
911
Construction Research Congress 2012 © ASCE 2012
912
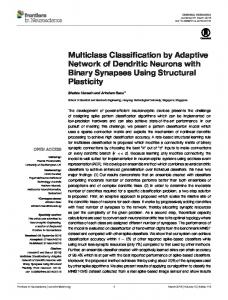
different elevations, such as buildings and ground. However, height, by itself, cannot differentiate between objects having similar elevations (e.g., low vegetation areas and ground). So, there is a need to utilize a set of different features (from multiple sources) that can assist in classifying ambiguous objects (e.g., objects with similar elevations). Though it seems prudent to utilize multiple features, one should be careful not to use many features (e.g. 200 features) since having many features will significantly increase the computational time. Thus, one should strive to train a given classification model using a minimal subset of features. In this paper, we combined LIDAR data with low-dimensional satellite image data having color (RGB) features. We fused multiple features (e.g., height, intensity, red , green, and blue) from both LIDAR and color images, and this process of fusing multiple features from different data sources is called feature fusion (Huber et al. 2003). In this process, we developed two categories of features: (a) point features and (b) neighborhood features (Figure 1). The point features are standalone features, and such features do not utilize the information of the neighboring features. In this research, five point features, such as height, intensity, red, green, and blue, of each data point were used. In addition, we utilized neighboring information since each data point is correlated with its neighbors (based on the first law of geography). In the case of neighborhood feature, each feature is computed based on the summary statistics (such as average, standard deviation, minimum, and maximum) of its nearest neighbors. So, twenty neighborhood features, such as standard deviation of height, maximum of intensity, were computed (Figure 1). The next step after the feature fusion is the feature selection process that is to select a minimal subset of these 25 features to achieve a classification model. Such model needs to be faster and as accurate as the classification model with all the 25 features. Finally, the last step is to build a classification model with a minimal subset of features. This process, which is known as decision fusion, combines multiple weak classifiers using two Ensemble methods (i.e. AdaBoost and Bagging).
Figure 1. Research Approach
Construction Research Congress 2012 © ASCE 2012
3.1 Feature fusion The goal of feature fusion is to fuse a set of features that achieves a good classification model. One of the widely used features of LIDAR data is the height feature which is a good feature to classify areas with different elevations, such as low vegetation and buildings. However, it fails to classify different objects with similar heights, such as buildings and tall trees. To differentiate buildings from tall trees, one can utilize color features. Thus, we utilized features (i.e., red, green and blue bands) from color satellite images. The LIDAR and color images have five point features in total: two features (height and intensity) from LIDAR data and three features (red, green and blue) from a satellite color image. Since there is a spatial correlation between the neighboring points (assuming that the point cloud is dense enough), we derived 20 neighborhood features based on the feature values (height, intensity, red, green, and blue) of the neighboring points. For each point, we evaluated four different summary statistics: (1) mean, (2) standard deviation, (3) minimum, and (4) maximum of the nearest neighboring points. In total, 25 features representing both point features and neighborhood features were the output of the feature fusion process. It is to be noted that all features may not be useful to improve classification performance. So, the evaluation of their effectiveness is done in the feature selection step. 3.2 Feature selection Reducing the number of features (dimensionality) is an important task in statistical learning because all features are not equally useful in terms of improving classification performance. Moreover, identifying minimal subset of features can save storage and computational time. Thus, an optimal subset of features can be selected from a given set of features, and such process is called feature selection (Kohavi and John 1997). There are two approaches to perform feature selection: wrapper approach and filter approach (Kohavi and John 1997). The sequential feature selection is a wrapper technique which selects a subset of features by sequentially adding a feature (forward search) or removing a feature (backward search) until no improvement can be seen in classification performance. There is no order of selection among features because the effect of adding or removing each feature is tested individually. In this research, we implemented a forward sequential feature selection method. To build the classification model based on these features, we applied a decision fusion process. In the decision fusion process, two Ensemble methods were used (AdaBoost and Bagging). 3.3 Decision Fusion The no-free-lunch (NFL) theorem states that no single algorithm is always the most accurate one (Wolpert and Macready 1997). The goal of decision fusion is to find a set of diverse classifiers which differ in their decisions so that they complement each other. This process is known (in the research literature) under various names, such as Multiple Classifier Systems (MCS), Committee of Classifiers, Mixture of Experts, Ensemble Methods. In this research, we implemented two Ensemble methods (Bagging and AdaBoost).
913
Construction Research Congress 2012 © ASCE 2012
3.3.1 Bagging One of the implemented Ensemble methods is bootstrap aggregating (Bagging) which is simple to implement and has a good classification performance (Breiman 1996). In this method, multiple training data sets are randomly drawn with replacement (bootstrapping) from a given training data set. Each bootstrapped training data set is used to train a weak classifier which is better than a random classifier. The classification accuracy of such weak classifier is slighter better than a random classifier (with accuracy around 50% for binary classification). The final decision is made by taking the majority vote of the decisions of different individual classifiers. The Bagging is a useful approach when available data set is of limited size. In this case, because of the sampling method, the training subsets can have many repeated samples. So, a relatively unstable model (such as a decision tree) should be used as a weak learner to ensure the diversity of classifiers. An unstable model is defined as a model in which a slight perturbation in training data set leads to a different model (Breiman 1996). 3.3.2 AdaBoost The second Ensemble method implemented in this research is Adaptive Boosting (AdaBoost) which was introduced by Freund and Schapire in 1996 (Freund and Schapire 1996). The reason behind implementing this method is that it is claimed to have better classification accuracy compared to other methods (Polikar 2006). The AdaBoost generates a sequence of classifiers. The first classifier equally weighs all the data points in the given training data. Then, the weights of training data are updated based on the performance of the previous classifier. The weights of the misclassified and correctly classified points are scaled up and down respectively to focus more on misclassified points by subsequent classifiers. The next classifier is trained using the training data with data points having different weights. This updating process is repeated to train a desired number of classifiers (Kearns and Vazirani 1994; Freund and Schapire 1996; Oza 2003). 4. RESULTS The proposed approach is a supervised one, i.e. it requires both training and test data sets to be labeled and to contain points from different classes. In this research, we are interested in classifying the given LIDAR data into both binary classes (i.e., terrain and non-terrain) and multiple classes (i.e., ground, low vegetation (0-0.3 meter), medium vegetation (0.3-2 meters), high vegetation (higher than 2 meters) and buildings). The selected study area is a 1.5 km by 0.8 km in Fargo city in North Dakota (figure 2). The LIDAR point cloud (of Fargo city) has 400,000 points, and processing such data set requires considerable computational time. To minimize the computational time, we subsampled 100,000 points from the given point cloud. A random uniform selection was performed to pick 100,000 points from 400,000 points. To extract the neighborhood features, we used ESRITM ArcGIS to (spatially) join these 100,000 points with their neighboring points. Then 67,000 data points (67%) were selected as training data set and the remaining 33% as test data set. Thus, the training and testing data sets are two mutually exclusive point clouds for the same geographic region.
914
Construction Research Congress 2012 © ASCE 2012
915
Figure 2. left: part of the study area (Fargo city); right: an example of the multi-class classification result using AdaBoost 4.1 Evaluating subsets of point features To evaluate the effectiveness of different point features and their combinations, the authors created different subsets of the point features (first column of table 1): (1) height; (2) intensity; (3) height and intensity; (4) red, green, and blue; (5) height, intensity, red, green, and blue. The number of weak classifiers in an Ensemble method should be large enough to ensure the diversity of the model and small enough to avoid over-fitting. We used 100 weak classifiers for both AdaBoost and Bagging. We repeated the classification with different subsets of features. The results of binary and multi-class classification are presented in table 1.
set
1 2 3 4 5
Table 1. Training and test overall accuracy (%) - using point features Binary classification Multi-class classification (5 classes) AdaBoost Bagging AdaBoost Bagging training
test
training
test
training
test
training
test
96.37 78.80 99.89 83.12 100.0
95.04 79.36 95.67 63.88 96.56
95.89 78.80 96.87 72.52 97.17
95.45 79.27 96.36 67.75 96.68
88.98 73.99 96.19 69.72 98.86
80.51 74.17 87.49 63.99 90.73
85.04 73.99 90.06 67.74 91.98
80.68 74.17 88.63 64.48 90.71
Table 1 shows that the height feature worked better compared to other features especially for binary classification. The accuracy of the model using only the height feature is about 80% for multi-class classification and 95% for binary classification. Using the LIDAR data (both height and intensity features) increased the accuracy of the model from 80% to 88% for multi-class classification, and from 95% to 96% for binary classification. Moreover, the accuracy of the trained model using RGB features is around 64% for multi-class and 67% for binary classification. To boost the power of classification, we used a combination of LIDAR data and satellite (color) images. Thus, we built a more accurate model with 90.7% and 96.7% accuracy for multi-class and binary classifications, respectively. In general, while the Bagging and AdaBoost had similar performances, the Bagging seems to be more resistant to over
Construction Research Congress 2012 © ASCE 2012
916
fitting. Since the difference between training and test accuracies for the Bagging is noticeably lower than that of the AdaBoost, the Bagging’s performance is more consistent (i.e., with approximately the same accuracy). 4.2 Evaluating combinations of point and neighborhood features To evaluate the effectiveness of neighborhood features, the classification was repeated using both point and neighborhood features. A minimal subset of features was used to build the classification model. The results of sequential feature selection process indicate that a subset including seven features performed as accurate as all 25 features. Two of these seven features are point features: (1) height, (2) intensity, and the five are neighborhood features: (3) minimum of height, (4) average of intensity, (5) standard deviation of intensity, (6) maximum of blue, and (7) minimum of red. In other words, five of these seven features are extracted from LIDAR data and two are from color satellite image. The results of binary and multi-class classifications using the selected subset of features are shown in table 2. Table 2. Training and test accuracy (%) - using point and neighborhood features Binary classification Multi-class classification (5 classes) AdaBoost Bagging AdaBoost Bagging training
test
training
test
training
test
training
test
100.0
98.89
98.62
98.59
100.0
94.62
94.62
93.64
Comparing tables 1 and 2 for binary classification, the results indicate that accuracy of the model using the combination of point and neighborhood features is about 98.9% compared to 96.7% using only point features. This 2.2% improvement demonstrates the usefulness of adding neighborhood features. In case of multi-class classification, the results show that the accuracy of the model improved from 90.7% to 94.6% by adding the neighborhood features. Again, this 3% improvement indicates the effectiveness of adding neighborhood features. Based on the results, the AdaBoost performed slightly better than the Bagging. However, the minimal difference between training and test accuracies demonstrates that Bagging is more resistant to over-fitting than AdaBoost. Another important analysis of the classification performance is to see if the model is confusing each pair of classes (i.e. mislabeling one as another). Confusion matrix is a visualization tool typically used for such purpose. Columns of a confusion matrix are predicted classes, and its rows are actual classes of the points. In this paper, a confusion matrix (table 3) is presented for the multi-class classification with the AdaBoost method. The table (the distribution of test error) indicates that approximately half of the test error is due to the confusion between high vegetation and buildings. In addition, about one-third of the error is due to the misclassification between low vegetation and ground. In both these two cases, the mislabeling has occurred between two classes with approximately similar elevations. Thus, the models need to be improved to classify objects of similar-height data points.
Known class
Construction Research Congress 2012 © ASCE 2012
Table 3. Distribution of 100% of test error, using selected subset of features Predicted class ground Low veg. Med veg. High veg. Building ground 5.35 1.06 1.82 1.41 Low veg. 24.03 2.64 0.88 0.53 Medium veg. 0.94 1.41 2.94 0.65 High veg. 3.17 0.53 2.00 20.92 Building 5.93 0.24 0.29 23.27 -
5. CONCLUSIONS In this research, two different LIDAR data classifications, binary and multiclass, were discussed. Based on the existing research studies, it is concluded that no single algorithm is always the most accurate one. In addition, there is no single source which has all the required information needed for classification. Therefore in this research, two Ensemble methods (Bagging and AdaBoost) were developed using two different categories of features: point features and neighborhood features. Using only the point features, the results showed that fused LIDAR-imagery data was able to achieve 96.7% and 90.7% accuracies for binary and multi-class classifications. Moreover, adding neighborhood features and using a minimal subset of features, the classification accuracy was further improved to 98.9% for binary and 94.6% for multi-class classification. To address the limitations of the proposed approach, one can add more informative features, such as infrared band from multispectral images. Such infrared feature could help to differentiate between vegetation and non-vegetation compared to the RGB values obtained from satellite color images. Another motivation for further research in future is to use various study areas representing different geographical regions to train and test the classification models. 6. REFERENCES Breiman, L. (1996). “Bagging predictors.” Machine Learning 24(2): 123-140. Csatho, B., T. Schenk, et al. (2003). “Spectral interpretation based on multi-sensor fusion for urban mapping. 2nd GRSS/ISPRS Joint Workshop on Remote Sensing and Data Fusion over Urban Areas, 2003. Dalponte, M., L. Bruzzone, et al. (2008). “Fusion of Hyperspectral and LIDAR Remote Sensing Data for Classification of Complex Forest Areas.” Geoscience and Remote Sensing, IEEE Transactions on 46(5): 1416-1427. Elmqvist, M., E. Jungert, et al. (2001). “Terrain modelling and analysis using laser scanner data.” International Archives of the Photogrammetry, Remote Sensing and Spatial Information Sciences XXXIV: 219– 227. Fauvel, M., J. Chanussot, et al. (2006). “Decision Fusion for the Classification of Urban Remote Sensing Images.” IEEE Transactions on Geoscience and Remote Sensing 44(10): 2828-2838. Freund, Y. and R. E. Schapire (1996). “Experiments with a New Boosting Algorithm.” Proceedings of the Thirteenth International Conference on Machine Learning.
917
Construction Research Congress 2012 © ASCE 2012
Huber, M., W. Schickler, et al. (2003). “Fusion of LIDAR data and aerial imagery for automatic reconstruction of building surfaces.” 2nd GRSS/ISPRS Joint Workshop on Remote Sensing and Data Fusion over Urban Areas, 2003. Kearns, M. J. and U. V. Vazirani (1994). “Introduction to Computational Learning Theory.” Cambridge, MA, MIT Press. Kohavi, R. and G. H. John (1997). “Wrappers for feature subset selection.” Artif. Intell. 97(1-2): 273-324. Lodha, S. K., D. M. Fitzpatrick, et al. (2007). “Aerial Lidar Data Classification using AdaBoost.” Sixth International Conference on 3-D Digital Imaging and Modeling, 2007. Lodha, S. K., D. P. Helmbold, et al. (2007). “Aerial Lidar Data Classification using Expectation-Maximization.” International Society for Optical Engineering. Lodha, S. K., E. J. Kreps, et al. (2006). “Aerial LiDAR Data Classification Using Support Vector Machines (SVM).” Proceedings of the Third International Symposium on 3D Data Processing, Visualization, and Transmission (3DPVT'06), IEEE Computer Society: 567-574. Makarau, A., G. Palubinskas, et al. (2011). “Multi-sensor data fusion for urban area classification.” Urban Remote Sensing Event (JURSE), 2011. Meng, X., N. Currit, et al. (2010). “Ground Filtering Algorithms for Airborne LiDAR Data: A Review of Critical Issues.” Remote Sensing 2(3): 833-860. Oza, N. (2003). “Boosting with Averaged Weight Vectors. Multiple Classifier Systems.” T. Windeatt and F. Roli, Springer Berlin / Heidelberg. 2709: 159159. Polikar, R. (2006). “Ensemble based systems in decision making.” Circuits and Systems Magazine, IEEE 6(3): 21-45. Roggero, M. (2001). “Airborne laser scanning: clustering in raw data.” International Archives of the Photogrammetry, Remote Sensing and Spatial Information Sciences XXXIV: 227– 232. Sithole, G. and G. Vosselman (2004). “Experimental comparison of filter algorithms for bare-Earth extraction from airborne laser scanning point clouds.” ISPRS Journal of Photogrammetry and Remote Sensing 59(1-2): 85-101. Vatsavai, R. R., E. Bright, et al. (2011). “Machine learning approaches for highresolution urban land cover classification: a comparative study.” Proceedings of the 2nd International Conference on Computing for Geospatial Research and Applications. Washington, DC, ACM: 1-10. Wolpert, D. H. and W. G. Macready (1997). “No free lunch theorems for optimization.” Evolutionary Computation, IEEE Transactions on 1(1): 67-82.
918