We investigated two binary classification strategies to further extend the strength of ensemble classifiers for mapping of urban objects. The first strategy was a ...
A.9. Chan J.C.-W., Demarchi, L., Van De Voorde, T., & Canters, F. (2008),”Binary classification strategies for mapping urban land cover with ensemble classifiers”, Proceedings of IEEE International Geoscience and Remote Sensing Symposium (IGARSS), July 6-11, 2008, Boston, Massachusetts, USA. Vol. III, pp. 1004-1007
BINARY CLASSIFICATION STRATEGIES FOR MAPPING URBAN LAND COVER WITH ENSEMBLE CLASSIFIERS Jonathan Cheung-Wai Chan, Luca Demarchi, Tim Van de Voorde, Frank Canters Cartography and GIS Research Group, Geography Department, Vrije Universiteit Brussel, Pleinlaan 2, Brussels 1050, Belgium ABSTRACT
1. INTRODUCTION
We investigated two binary classification strategies to further extend the strength of ensemble classifiers for mapping of urban objects. The first strategy was a oneagainst-one approach. The idea behind it was to employ a pairwise binary classification where n(n-1)/2 classifiers are created, n being the number of classes. Each of the n(n-1)/2 classifiers was trained using only training cases from two classes at a time. The ensemble was then combined by majority voting. The second strategy was a one-against-all binary approach: if there are n classes, with a = {1,…, n} being one of the classes, then n classifiers were generated, each representing a binary classification of a and non-a. The ensemble was combined using accuracy estimates obtained for each class. Both binary strategies were applied on two single classifiers (decision trees and artificial neural network) and two ensemble classifiers (Random Forest and Adaboost). Two multi-source data sets were used: one was prepared for an object-based classification and one for a conventional pixel-based approach. Our results indicate that ensemble classifiers generate significantly higher accuracies than a single classifier. Compared to a single C5.0 tree, Random Forest and Adaboost increased the accuracy by 2 to 12%. The range of increase depends on the data set that was used. Applying binary classification strategies often increases accuracy, but only marginally (between 1-3%). All increases are statistically significant, except on one occasion. Coupling ensemble classifiers with binary classification always yielded the highest accuracies. For our first data set, the highest accuracy was obtained with Adaboost and a 1-against-1 strategy, 4.3% better than a single tree - for the second data set with the Random Forest approach and a 1-against-all strategy, 13.6% higher than a single tree.
Classification of man-made objects in urban areas is a big challenge due to their similar spectral properties. For example, the separation of roads and squares (open space) is extremely important in many real life applications, but their separation is non-trivial as these objects are often composed of materials that show almost identical reflectance. Recently available high definition airborne photos and high resolution broadband satellite images such as Ikonos and Quickbird, while giving stunning details and visual impressions, have not eased the difficulty of mapping urban objects. In fact, classification tasks have been made even harder with high spatial resolution data because of higher intra-class variability. This is a well-known problem and different remedies have been proposed. An important milestone is to replace pixel-based classification by object-based classification approaches. An object-based approach relies on a good approximation of object boundaries by segmentation. Additional features can also be derived from the ‘objects’ in terms of their geometric structure or texture expressions. Incorporating additional features such as texture measures to enhance classification accuracy has been experimented with in pixel-based classification of remote sensing images for decades. More recently, geometric activity (GA) features derived from mathematical morphology are being studied [1]. These GA features contain information concerning physical properties of image objects and are reportedly useful for classification of urban man-made objects. Their usefulness is comparable to features generated using object-based approaches [2].
Index Terms— Binary classification, pairwise classification, ensemble classification, Random Forest, Adaboost, urban mapping.
It is evident that non-spectral data are increasingly being applied in urban mapping. Various textural or geometric features are generated and used together with spectral inputs. To generate geometric activity or textural features, an operator has to decide which spectral band or which kernel sizes to use. Without a priori knowledge, features are often blindly generated using various thresholds or rule-of-thumb settings. Sometimes hundreds of features are generated which dramatically increases the input dimension. To separate urban land-cover classes, or objects, which are
difficult to discern using high dimensional inputs, powerful learning algorithms are needed. Many different classifiers have been proposed for the classification of remote sensing images. Conventional classifiers include the maximum likelihood classifier, artificial neural networks, support vector machines and decision trees. Recently, increased attention is drawn to ensemble classification which uses more than one classifier [3]. Ensemble classification can be implemented with either one base learner, or different learners. The implementation with an ensemble of different learners is intuitive. The same training set is used to train different algorithms and the final labeling is decided by voting. However, a more popular approach to ensemble classification is to use just one base learner that is reasonably accurate and fast in training. Two popular ensemble classifiers are Adaboost [4] and Bagging [5]. Both algorithms have been thoroughly examined and tested in the machine learning communities. Based on the resampling method of bagging, Random Forest [6] is another powerful ensemble classifier equipped with out-ofbag estimates and random feature subsets. Both Adaboost and Random Forest were originally conceived to boost the accuracy of decision trees. A decision tree is a classifier that recursively partitions the original training set into increasingly homogenous subsets using certain purity measurements such as the Gini index [7], information gain ration [8] and chi square measures [9]. A decision tree classifier has many advantages: it is fast in training, nonparametric, and accurate. Indeed, its fast training makes it a natural choice as a base learner in ensemble classification, which often generates up to hundreds of classifiers. Ensemble classification methods like Adaboost and Random Forest have been proven effective with high dimensional inputs [10]. They produce results comparable or superior to accurate learners such as support vector machines and artificial neural networks. Some would comment that these algorithms are not just fast and accurate, they are also easy to use with very few parameters to tune and consequently their results are highly reproducible [11]. These qualities are important in the operational sense. In a bid to understand if the accuracy of ensemble classifiers can be pushed even further, we investigated the use of binary classification strategies, i.e. strategies that map a multi-class learning problem onto several two-class learning problems and that derive the final multi-class prediction from the predictions of the pair-wise classifiers [12]. The idea is to modulate complex multi-class problems into simpler two-class problems. Since the binarization technique also creates many classifiers, it can be perceived as another type of ensemble method. We will examine two forms of binary strategies: the one-against-one and the one-against-all strategy.
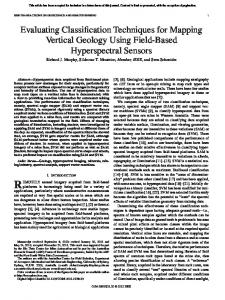
2. METHODS To evaluate the effect of class binarization techniques, we have chosen four well-known classification algorithms, decision trees (DT), artificial neural networks (ANN), Adaboost with decision trees as base-classifier and Random Forest, which uses a CART-like decision tree [6]. The latter two are ensemble classifiers, and consequently they become a type of stacked ensemble classifier when binary strategies are applied. Class binarization maps a multi-class learning problem onto several two-class learning problems where the final multi-class prediction is derived from the predictions of the two-class classifiers. Two ways of formulation adopted are one-against-one and one-against-all scenarios. Decision boundaries for multi-class problems are considerably more complex and difficult to obtain than those of a two-class system and hence binary strategies are suggested to provide faster and better classification (Fig. 1).
Figure 1. Top left: multi-class decision boundary with one classifier. Top right: one-against-all learning with n classifiers, each separating one class from all other classes. Here the separation between the class x and non-x is represented. Bottom: one-against-one learning with simple decision boundary separating two classes x and ○. This figure is adapted from Figure 1 in [12].
2.1 One against one The one-against-one strategy reformulates the multi-class problem as a set of binary classification problems by using only the training examples of two classes and ignoring all others. For a classification problem with n classes, the number of binary classifiers is n(n-1)/2. The obtained classifiers are used to classify all samples, also those which belong to classes other than the two classes these binary classifiers are trained with. For each unknown sample, its class label will be decided by voting.
2.2 One against all The one-against-all strategy subdivides a multi-class problem with n classes into n binary classification problems, each dealing with one class against the rest. There are three possibilities for labeling an unknown sample: it is assigned to one of the classes; it is not assigned to any of the classes; or it is assigned to more than one of the classes. In the first case, nothing needs to be done. In the second case, if a sample is not assigned to any of the classes, we assign it to the class it is attributed to by the original multi-class classification. In the last case, if more than one class is assigned, we choose the class using classification confidence estimates. Producer’s class accuracies are calculated from the multi-class classification. When an unknown sample is assigned to several classes, the class with the highest producer’s accuracy is used. 2.3 Statistical measures of significance The kappa index-of-agreement and overall accuracy are common measures for classification assessment. To compare the effectiveness of different learning algorithms in classification using related samples, we use a resampling method that simulates Monte Carlo permutation [13]. In order to keep the length of this paper within limits, we refer the reader to [13] for more details on this significance test. 3. DATA SETS Both data sets used in this study represent typical (sub)urban settings for the city of Ghent in Belgium. The scenes cover dense built-up area, low-density residential development, areas with sparsely distributed clusters of buildings, urban green including park areas, sport facilities (playfields,…), motorways,…. In addition to the spectral data, geometrical and textural features were generated and used as extra input channels for classification. A Normalized Difference Vegetation Index layer, which has been shown to be useful in discerning vegetation, was also created for each of the data sets. 3.1 Data set I The first data set is a mosaic of high definition digital aerial photos acquired in 2002, which consists of four bands including three visible bands and one infrared band, with a pixel size of 25cm. The image was segmented and geometric features that provide information concerning the shape and size of the segmented objects were generated using the commercial software Definiens®. An NDVI layer was created to help separate vegetation from non-vegetation segments. LIght Detection And Ranging (Lidar) data were also available for this study area. To make the Lidar data useful for object-based classification, we averaged all corrected Lidar measurements within each segment. The average value obtained for each segment (object) represents the average height of the segment as measured from the
ground level and was used as an input feature for classification. A total of 138 input channels were created, including the four spectral bands, NDVI, object height derived from Lidar data and more than 130 texture and geometric measures. The number of training and test samples and the class definitions are listed in Table 1. 3.2 Data set II The second data set is an Ikonos image, consisting of four multispectral bands and one panchromatic band. Data Set I Class name 1 2 3 4 5 6 7
buildings roads squares/road junctions grass trees bare soil shadow Total Data Set II Class names
# training samples 318 201 175 304 326 7 250 1581
# test samples 322 322 221 305 301 6 311 1788
# training # test samples samples 1 water 3548 3520 2 grass 2644 2200 3 trees 3519 3267 4 buildings with dark roof 3507 2072 5 buildings with red roof 892 852 6 buildings with bright roof 514 600 7 roads 3291 2272 8 Other man-made objects 3016 4535 9 shadow 1346 2966 Total 22277 22284 Table 1. Class descriptions and number of training and test data for data sets I and II.
Multispectral bands were pan-sharpened to 1m resolution and an extra NDVI channel was created. Geometric Activity features based on mathematical morphology were generated. A detailed description of these features can be found in Chan et al. (in press). These geometric activity features are pixel-based instead of object-based. Hence, no segmentation was applied. A total of 43 input features including 5 spectral bands, NDVI, and 37 geometric activity features were produced. The number of training and test samples and the definition of classes are given in Table 1. 4. RESULTS AND CONCLUSIONS In the first experiments the four classifiers were applied to both data sets. All ensemble classifiers outperform a single decision tree. For data set I, ensemble classifiers brought an increase of 2-3% while for data set II, the increase amounts to 6-12%. The amount of increase depends on the data set. A particular learner may work better with some data set, but not with the other. ANN shows better results with data set II where it outperforms a decision tree by more than 8%, but
with data set I its accuracy is 2% lower. For data set I, both Random Forest and Adaboost outperform an ANN by a 45% margin, but only Random Forest has a higher accuracy (+4%) than ANN with data set II. These mixed results illustrate why it is beneficial to experiment with different classifiers for a specific problem. Nevertheless, our results show that in the case of decision trees, ensemble classifiers are always better than a single tree.
DT ANN Adaboost Random Forest
DT ANN Adaboost Random Forest
Data Set I 1 against 1 84.1 85.2 (0.8087) (0.8229) 84.5 82.2 (0.8134) (0.7859) 88.4 87.1 (0.8603) (0.8448) 86.7 85.9 (0.8406) (0.8300)
1 against all 85.5 (0.8252) 84.6 (0.8138) 88.1 (0.8568) 87.2 (0.8437)
Data Set II 1 against 1 57.1 57.9 (0.5198) (0.5108) 68.7 65.5 (0.6402) (0.6044) 63.4 66.3 (0.5818) (0.6150) 69.3 66.5 (0.6479) (0.6172)
1 against all 54.4 (0.4799) 66.7 (0.6177) 63.1 (0.5783) 70.7 (0.6645)
Table 2. Classification accuracy before and after the application of oneagainst-one and one-against-all binary strategies. The values between brackets are kappa values. The shaded cells represent an increase in accuracy that is statistically significant. The crossed cell represents an increase that is not statistically significant.
In the second set of experiments we applied both oneagainst-one and one-against-all strategies to all four classifiers. It shows that, although the binary strategies often increase accuracy, improvement is not guaranteed. Each strategy triumphs in some cases, but fails for others. The one-against-one strategy does not seem to work with Random Forest resulting in a 0.8% and 3.8% drop for data sets I and II, respectively. But it increases accuracy for all other classifiers by a 1-3% margin. All these increases are statistically significant. The one-against-all strategy, if it works, brings an increase of around 1-2.4% in accuracy. In one case, when applied to Random Forest for data set I, the increase in accuracy is too small to be significant. In all other cases, the increase is significant. Despite the modest improvement in accuracy, most of the increases obtained with the binary strategies are statistically significant, and the additional effort needed to achieve this improvement is minimal. The increased complexity of rearranging the training set can be automated easily. For all ensemble classifications using decision trees as base learner, the computing time is still very fast even with hundreds of
classifiers more. Hence, it would be beneficial to implement binary strategies with ensemble classifiers. (This, however, does not apply to ANN for which training costs will be substantially higher and easily become prohibitive.) Results from this preliminary study show that application of binary strategies with ensemble classifiers can improve classification results. The improvements are modest but significant. Very little has been done so far to unravel the potential of binary strategies, and more research, especially on the methods used to combine the pairwise classifiers, might lead to more satisfactory results. The use of bias/variance analysis might deepen our knowledge of why binary strategies work. 11. REFERENCES [1] R. Bellens, L. Martinez-Fonte, S. Gautama, J.C.-W. Chan, and F. Canters, “Potential problems with using reconstruction in morphological profile for classification of remote sensing images from urban areas”, in IGARSS 2007, 23-28 July 2007, Barcelona, pp. 2698-2701. [2] J.C.-W. Chan, R. Bellens, F. Canters and S. Gautama, “An assessment of geometric activities features for classification of urban man-made objects using meter resolution imagery”, Photogrammetric Engineering & Remote Sensing (in press). [3] P.O. Gislason, J.A. Benediktsson, and J.R. Sveinsson, “Random Forests for land cover classification”, Pattern Recognition Letters, 27, pp. 294-300. [4] Y. Freund and R.E. Schapire R.E, “Experiments with a new boosting algorithm”, in Machine Learning: Proceedings of the Thirteenth International Conference, pp. 148-156. 1996. [5] L. Breiman, “Bagging predictors”, Machine Learning, 24, pp.123-140. 1996. [6] L. Breiman, “Random Forests”, Machine Learning, 45, pp. 532. 2001. [7] L. Breiman, J.H. Freidman, R.A. Olshen and C.J. Stone, Classification and Regression Trees. Wadsworth. 1984. [8] J.R. Quinlan, C4.5: Programs for Machine Learning. San Mateo, CA: Morgan Kaufmann Publishers, Inc. 1993. [9] J. Mingers, “An empirical comparison of selection measures for decision tree induction”, Machine Learning, 3, pp.319-342. [10] J.C.-W. Chan and F. Canters, “Ensemble classifiers for hyperspectral classification”, on CD-ROM, Proceedings of the 5th EARSeL SIGIS, Innovation in Environment Research, Bruges, 2325 April, 2007. [11] J.C.-W. Chan and D. Paelinckx, “Evaluation of Random Forest and Adaboost tree-based ensemble classification and spectral band selection for ecotope mapping using airborne hyperspectral imagery”, Remote Sensing of Environment, 112, pp. 2999-3011. 2008. [12] J. Fürnkranz, “Round Robin Classification”, Journal of Machine Learning Research, 2, pp. 721-747. 2002. [13] G.M. Foody, “Thematic map comparison: Evaluating the statistical significance of differences in classification accuracy”, Photogrammetric Engineering & Remote Sensing, 70, pp. 629633. 2004.