tiation of orthologs and paralogs—has been proposed to address these ...
allowed to evolve novel functions. Paralogous ..... A graphic user interface similar
to the one .... revealed a 'twilight zone' of protein sequence identity where
mistakes in .... 31, 383–387. Marcotte,E.M., Xenarios,I., van Der Bliek,A.M. and
Eisenberg,D.
Vol. 20 no. 2 2004, pages 170–179 DOI: 10.1093/bioinformatics/bth021
BIOINFORMATICS
Phylogenomic inference of protein molecular function: advances and challenges Kimmen Sjölander Berkeley Phylogenomics Group, Department of Bioengineering, University of California, 473 Evans Hall #1762, Berkeley, CA 94720-1762, USA Received on November 9, 2003; accepted on November 26, 2003
ABSTRACT Motivation: Protein families evolve a multiplicity of functions through gene duplication, speciation and other processes. As a number of studies have shown, standard methods of protein function prediction produce systematic errors on these data. Phylogenomic analysis—combining phylogenetic tree construction, integration of experimental data and differentiation of orthologs and paralogs—has been proposed to address these errors and improve the accuracy of functional classification. The explicit integration of structure prediction and analysis in this framework, which we call structural phylogenomics, provides additional insights into protein superfamily evolution. Results: Results of protein functional classification using phylogenomic analysis show fewer expected false positives overall than when pairwise methods of functional classification are employed. We present an overview of the motivations and fundamental principles of phylogenomic analysis, new methods developed for the key tasks, benchmark datasets for these tasks (when available) and suggest procedures to increase accuracy. We also discuss some of the methods used in the Celera Genomics high-throughput phylogenomic classification of the human genome. Availability: Software tools from the Berkeley Phylogenomics Group are available at http://phylogenomics.berkeley.edu. Contact:
[email protected]
INTRODUCTION One of the fundamental paradigms in computational biology is function prediction by homology. In this framework, a gene or protein is compared against other genes or proteins in a database, and if a sequence can be detected whose similarity is statistically significant, the function of the unknown gene or protein is inferred based on the known (or presumed) function of the homolog. These predictions are used to gain a first-order approximation of the molecular function of the proteins encoded in a genome and to prioritize experimental investigation. While computationally efficient methods for pairwise sequence comparison—notably BLAST (Altschul et al., 1990)—have been developed to make this approach feasible
170
in high-throughput, homology-based function prediction is not without its dangers. Systematic errors associated with this paradigm have become increasingly apparent (Bork and Koonin, 1998; Eisen, 1998; Galperin and Koonin, 1998). Gene duplication is perhaps the single greatest contributing factor to the tremendous diversity of function observed in protein superfamilies (Fitch, 1970), as well as to errors in function prediction by homology. When gene duplication occurs, one copy must supply the original function, while the other is allowed to evolve novel functions. Paralogous genes, related by duplication events, are more likely to have divergent function, while orthologous genes, related by speciation, are more likely to share a common function. Phylogenetic tree construction is required to disambiguate the relationship between the two. Domain shuffling (Doolittle, 1995; Doolittle and Bork, 1993) also complicates matters, as standard methods of homolog detection typically ignore whether two proteins align globally or only locally. This can lead to errors in function prediction, as the presence or absence of a domain can have a dramatic impact on protein molecular function. Changes in function due to speciation are a third contributing factor to errors in function prediction. Proteins can share a common ancestor, and be orthologous, but still have different functional specificities, particularly if the proteins are contained in very distantly related species (Galperin and Koonin, 1998; Gerlt and Babbitt, 2001). Last but not least, existing database errors can be propagated through function prediction by homology (Brenner, 1999; Devos and Valencia, 2001; Gilks et al., 2002).
Evolution is not simply conservative Evolution not only conserves function, it also generates new functions. The fundamental biochemical function (such as the reaction catalyzed by an enzyme) may be conserved, while the substrate or ligand specificity changes. Analyses of protein structures show the same basic theme: the hydrophobic core elements of a fold are typically conserved while exposed surface regions often display high degrees of variability. Numerous evolutionary processes combine to produce protein families with pairs that may not be mutually recognizable
Bioinformatics 20(2) © Oxford University Press 2004; all rights reserved.
Phylogenomic inference of protein molecular function
Fig. 1. Scorpion-toxin-related SCOP superfamily. These are only three members of a large superfamily including plant and insect defensins as well as scorpion toxins, provided as an example of the functional and structural diversity found in protein superfamilies. The N-terminus of each structure, shown in cartoon representation, is colored green, beta strands are colored yellow, helices are colored pink, hairpin turns are colored blue and loop regions are uncolored. These three proteins are believed to be related by divergent evolution from a common ancestor, and to share a common (albeit high-level) molecular function with obvious differences in specificity. Differences in structure are particularly evident in 1CN2, which has longer connecting and terminal loops, and only two helical turns compared with three in the other structures shown. BLAST comparison finds no recognizable sequence similarity between any two in this set, yet these are all part of a superfamily identified in the Structural Classification of Proteins database (see http://scop.berkeley.edu/data/scop.b.h.d.h.html).
from sequence information alone, and whose structures may be superposable over only a small conserved core. This is illustrated in Figure 1.
Phylogenomic inference of protein function Molecular phylogenetic analysis has been used for decades for the elucidation of species relationships. With the advent of the sequencing projects, new applications of phylogenetic analysis have become possible, one of which involves inferring the complex evolutionary processes underlying the generation of protein superfamilies. Integration of experimental data in these analyses enables investigators to predict the functional subtypes in a protein superfamily. This general approach to protein function prediction has been used by biologists for years (even if homology-based methods of function prediction have dominated), but received a major boost in definition, visibility and usage following Eisen’s (1988) seminal paper outlining an approach he termed phylogenomic analysis. Eisen’s paper was timely, given the maturing of several sequencing projects, including human (Lander et al., 2001; Venter et al., 2001) and the growing recognition that homology-based methods of functional classification were prone to systematic error (Bork and Koonin, 1998; Brenner,
1999; Devos and Valencia, 2001; Eisen, 1998; Galperin and Koonin, 1998; Gilks et al., 2002). Eisen and others then showed how phylogenomic analysis addresses the deficiencies of function prediction by homology and improves the accuracy of protein function prediction (Eisen and Fraser, 2003; Eisen and Wu, 2002; Zmasek and Eddy, 2001b, 2002). Phylogenomic inference of protein molecular function has been applied to detailed analyses of individual protein families (Citerne et al., 2003; Eisen and Hanawalt, 1999; Gadelle et al., 2003), in comparative genomics (Daubin et al., 2002; Sicheritz-Ponten and Andersson, 2001), whole genome analysis (Eisen et al., 2002; Venter et al., 2001) and in reconstruction of the evolutionary history of a segment of the human genome (Vienne et al., 2003). Evidence of correlated evolution of genes also inspired phylogenetic profile methods for inferring the cellular process involvement of proteins (Pellegrini et al., 1999) and for predicting protein cellular localization (Marcotte et al., 2000). Due to limited space and the extremely broad scope of the subject area, this review focuses on the most common application of phylogenomic analysis—prediction of molecular function—and represents a personal perspective of the field. Research and method development in the Berkeley Phylogenomic Group has been strongly influenced by developments in computational structural biology. Given the intimate relationship of protein structure and function, we believe many of the insights and advances of the computational structural biology community can contribute to the accuracy of protein functional classification. Included in this review are methods we have found useful for detailed analyses of individual protein superfamilies in our laboratory, as well as for high-throughput functional classification at a genomic scale (Venter et al., 2001).
METHODOLOGY Overview Phylogenomic inference of protein molecular function consists of a series of subtasks, starting with identification of homologous proteins for the protein of interest. Once a cluster of homologs is identified, a multiple sequence alignment and phylogenetic tree are constructed. The tree topology is analyzed to label branch points as indicative of either speciation or gene duplication events, enabling the discrimination of orthologs from paralogs. Finally, the phylogenetic tree is overlaid with experimental data culled for the members of the family, and changes in biochemical function (and sometimes structure) can be traced along the evolutionary tree (Eisen, 1998). For proteins whose functions are unknown, consistency of database annotations within subtrees containing the protein can be used as the basis for function prediction [a process termed ‘subtree neighbors’ (Zmasek and Eddy, 2002)]. Every computational task in this process is rendered far more complex and also more prone to error when applied to
171
K.Sjölander
1. Gather homologs 2. Construct a multiple sequence alignment 3. Examine/edit alignment
4. Alignment masking
5. Construct phylogenetic tree
6. Identify subtrees with statistical support 7. Overlay tree topologies with experimental data
8. Label tree nodes as indicating gene duplication or speciation
9. Infer molecular function using tree topology and predicted gene relationships
Fig. 2. Flowchart for phylogenomic analysis. Details on these steps are provided in the Methodology section.
large and divergent protein superfamilies than when applied to smaller and more closely related protein families. This section includes an overview of some promising new methods developed for these tasks, and recommendations designed to avoid the main pitfalls and improve accuracy. A flowchart for phylogenomic analysis is presented in Figure 2. Step 1. Clustering homologous proteins The first step in phylogenomic analysis involves the identification of related proteins from different species to the protein(s) of interest. What criteria should be applied in selecting sequences for phylogenomic analysis? First, in order for inferences of molecular function to be credible, sequences accepted into the cluster must share a common overall fold. They should also share sufficient sequence identity to enable the generation of an accurate multiple sequence alignment and phylogenetic tree. However, since the inclusion of more distantly related proteins can help many aspects of the analysis, the cluster should include sufficient diversity for optimal information content, but not so much as to introduce noise. This requires a certain degree of judgment and experience, and it is often necessary to alternate clustering and alignment with alignment inspection. Some superfamilies, such as the 7TM receptors, are sufficiently large and divergent that it may not be possible to include all family members in a single tree without loss of accuracy; these will need to be divided into several potentially overlapping sets (i.e. the construction of a set covering). The most commonly used methods for clustering homologous proteins are BLAST (Altschul et al., 1990) and PSI-BLAST (Altschul et al., 1997). Less commonly used but
172
somewhat more powerful are the UCSC hidden Markov model (HMM)-based methods [SAM-T98 and successors (Karplus et al., 1998)]. Given a seed sequence, PSI-BLAST and the UCSC methods iteratively search a sequence database to identify and align putative homologs, from which a profile (or HMM) is constructed for database search in the next iteration. The UCSC SAM-T99 method has been shown to have the highest sensitivity of remote homolog detection, followed closely by PSI-BLAST, with pairwise methods, such as BLAST, generally showing poor discrimination power in remote homolog detection (Park et al., 1998). There are three primary problems with the use of these tools in the context of phylogenomic inference of molecular function. First, clusters are not screened to remove proteins with different domain structure. Second, overly permissive parameterization of these tools can result in the inclusion of non-homologs. Third, it is possible for repeated iterations of the homolog identification process to result in profile drift, with the result that the seed sequence may not be included in the final cluster. This last problem is possible even without the intrusion of false positives in the cluster, and is much more common in protein superfamilies spanning large distances in protein sequence space. The Celera Genomics classification of the human genome used a program called FlowerPower designed to address these issues. Like PSI-BLAST and the UCSC methods, FlowerPower employs an iterative approach to clustering, but instead of using a single HMM or profile to expand the cluster, identifies subfamilies using the BETE algorithm (Sjölander, 1998) and then selects and aligns new homologs using subfamily HMMs; these prevent profile drift by the persistent representation of the seed sequence in one of the subfamily HMMs. More recently, we have extended FlowerPower to include alignment analysis following each iteration to prevent the intrusion of non-homologs and to enforce global–global alignment. When parameterized for global–local alignment, FlowerPower can be used to gather and align homologs for modeling structural domains. Assessed on the PDB40 benchmark dataset (Brenner et al., 2000), FlowerPower identifies more remote homologs than both PSI-BLAST and the UCSC methods when low numbers of false positives are allowed; when more false positives are allowed, its sensitivity drops below PSI-BLAST and the UCSC methods (data not shown). FlowerPower is available upon request to investigators in academia and government laboratories. Step 2. Multiple sequence alignment In this step, a multiple sequence alignment of the sequences gathered in database search is constructed. The accuracy of the alignment is critical, since it is the source of phylogenetic signal for the actual tree construction. Fortunately, we have fairly concrete and detailed data on the performance of multiple sequence alignment methods for different types of inputs, through the use of benchmark datasets.
Phylogenomic inference of protein molecular function
These benchmark datasets are based on structural alignments, and have been very useful in providing key feedback and motivation to many algorithm developers. Of these, the BAliBASE benchmark dataset (Thompson et al., 1999a) is the most well known, and new methods in this area are tested routinely on this benchmark. This dataset includes subsets with different characteristics, to compare method performance on commonly encountered inputs. Studies using BAliBASE and other datasets have shown that multiple sequence alignment methods are sensitive to attributes characterizing many protein superfamilies: large numbers (in the hundreds and thousands) of sequences, high sequence variability and length differences. When pairwise sequence identity is roughly above 25–30%, a pairwise sequence alignment often matches a structural alignment very well. However, the number of amino acids in a pairwise structural superposition may represent only a small fraction of each protein sequence, so that higher levels of identity are often necessary to ensure global alignment accuracy. Below 25% identity, sequence and structure alignments often correlate poorly or not at all, particularly if there are significant differences in sequence lengths (McClure et al., 1994; Thompson et al., 1999b). To the degree that phylogenomic analysis is restricted to more closely related taxa, alignment accuracy can be expected to be high, with corresponding increased likelihood of accuracy in the resulting tree topology. However, when large numbers of divergent sequences are included in a cluster, alignment and tree topology accuracy can be expected to decrease. As noted earlier, a balance between the two extremes is helpful. How do available methods rank on these datasets? The very popular ClustalW tool (Higgins et al., 1996) performs well and is computationally efficient. But some other methods perform better, and are worth trying out. One of our personal favorites is MAFFT (Katoh et al., 2002); it is blindingly fast and produces high-quality alignments, performing at or near the top of these benchmark datasets, and appears to be more robust than ClustalW to variations in sequence length in the input. PRRP/PRRN (Gotoh, 1996) and T-Coffee (Notredame et al., 2000) have superior performance to ClustalW on BAliBASE and other datasets, but are extremely slow so we do not use them for high-throughput analyses. Step 3. Alignment analysis and editing The first step involves removing potential non-homologs included during clustering. To accomplish this, the multiple sequence alignment should be examined to identify critical motifs or conserved residues, followed by removal of sequences not matching the consensus structure of the family as a whole. Next, engineered or mutant proteins should be removed. The SwissProt database (Bairoch and Apweiler, 2000) provides manually curated information valuable in these analyses. Following removal of any potentially problematic sequences,
sequences can be realigned using several different methods and/or parameterizations, and a consensus alignment can be constructed (Bucka-Lassen et al., 1999). Alignment editors can assist in small modifications to the alignment of individual sequences. For more drastic editing of column blocks (particularly for regions of high variability), we turn to alignment masking in the following section. Step 4. Alignment masking The next step involves alignment masking to prevent the intrusion of noise from variable regions in the alignment. Two basic approaches have been proposed. The first approach involves deleting columns that appear unreliable or include many gaps. These can be identified either manually or computationally (e.g. using measurements of entropy or pairwise substitution matrix scores). An alternative approach (Wheeler et al., 1995) involves the construction of a concatenated super-alignment of several separate multiple alignments, varying parameters and using the concatenated alignment as input to phylogenetic tree construction. This approach assumes that noisy regions will be aligned differently from one alignment to the next, while the more conserved regions will be more consistently aligned, and that using the concatenated alignment will reinforce the true phylogenetic signal while reducing the noise. We find this approach appealing, but note that caution is required when interpreting the results of bootstrap analysis, as concatenation of sequences has been shown to inflate bootstrap values (Brocchieri, 2001). While we do not discount the importance of masking variable regions of a multiple alignment, we are concerned about the potential impact. It is known that regions outside the conserved core can play important functional roles, such as determining binding specificity. These binding pocket positions are not always structurally conserved across all superfamily members, and may shift (along with changes in substrate specificity) to form different pockets and clefts in different subgroups. In these cases, the information outside the conserved core may be necessary for tree topology accuracy. Step 5. Phylogenetic tree construction Phylogenetic inference is a field of great complexity that is beyond the scope of this review to cover in any significant detail. For an overview of issues related to phylogenetic reconstruction see Brocchieri (2001), Holder and Lewis (2003) and Huelsenbeck and Rannala (1997); an excellent graduate-level text by Felsenstein (2003) is also available. Key issues of particular importance to reconstruction of protein superfamily relationships are summarized below. There are two main classes of phylogenetic tree construction methods: distance-based [e.g. neighbor-joining (Saitou and Nei, 1987)], and character-based (e.g. maximum parsimony, maximum likelihood and Bayesian approaches). Distancebased methods compute a matrix of pairwise distances between sequences in an alignment, and thereafter ignore the sequences themselves, constructing a tree based entirely on the original distance computations. The computational
173
K.Sjölander
advantage of distance-based methods over character-based methods makes them more popular for day-to-day use by biologists, and also amenable to bootstrap analysis (Felsenstein, 1985) for very large trees. Detailed phylogenomic analyses of protein families using different tree-estimation tools have shown a lack of consistency across methods (see, e.g. Citerne et al., 2003). The lack of robustness of phylogenetic tree estimation is supported by simulation studies (Felsenstein, 1988; Hasegawa and Fujiwara, 1993; Kuhner and Felsenstein, 1994), which show that tree topology accuracy is optimized when taxa diverge at a constant rate from a common ancestor (i.e. are consistent with a molecular clock); there is low site-to-site variation in mutation rate and a 1–1 correspondence between each residue in each sequence with a homologous residue in other sequences; sequences are long; non-homologs are excluded; and sampling of taxa representing the family is thorough and representative. However, none of these can be assumed in protein superfamilies, and while some methods are more robust than others when data do not match these assumptions, the divergence in protein superfamilies can become quite extreme, challenging even the best of methods. The order in which sequences are aligned is also known to bias the tree topology (Lake, 1991). Notably, the most popular alignment methods among biologists involve progressive alignment (e.g. ClustalW); these methods estimate a guide tree based on pairwise distances computed in the first step and then align sequences according to the guide tree. We often see the guide tree topology reflected in phylogenetic trees produced using entirely different phylogenetic tree estimation methods. In recognition of these issues and of the sensitivity of phylogenetic inference to errors in a multiple sequence alignment, methods for inferring an alignment and tree simultaneously have also been developed (Sankoff et al., 1973; Hein, 1990; Mitchison, 1999; Edgar and Sjölander, 2003). Primary sources of phylogenetic tree construction software include the PHYLIP website (http://evolution.genetics. washington.edu/phylip.html), MrBayes (Huelsenbeck and Ronquist, 2001) and PAUP (Swofford, 2002). How do the different methods for phylogenetic tree construction compare with respect to reconstructing the evolution of protein superfamilies? In contrast to assessment of computational methods for protein structure prediction, remote homolog detection and sequence alignment, no biological datasets exist to assess phylogenetic tree method accuracy directly. This is essentially unavoidable, as we have no way of knowing the true evolutionary tree underlying a protein superfamily. For this reason, virtually all experimental validation of phylogenetic inference methods has been performed on simulated data, and results relevant to protein superfamily reconstruction are inconclusive. Complicating matters, highthroughput phylogenomic analysis often necessitates the use of fast methods that may be less robust to the types of variability encountered in protein superfamilies. Our own
174
experiments assessing phylogenetic tree estimation software based on their ability to produce tree topologies corresponding to the experimentally determined functional and structural hierarchy in the data do not identify any methods (including our own) as significantly better than others; all appear to fail on some inputs and perform credibly on others. Until more convincing evidence exists to suggest which methods to use for what types of data, we prefer to hedge our bets, as outlined in the next section. Step 6. Identify subtrees with high support Given the same multiple sequence alignment, two tree methods will produce at least two trees and sometimes many more (e.g. maximum parsimony methods may produce many hundreds or thousands of equally parsimonious trees). Closely related subgroups are found reliably by most tree methods, with most of the differences between trees restricted to the order in which these subgroups are joined (i.e. the coarse branching order of the tree nearer the root). To avoid any systematic biases of particular methods of multiple sequence alignment or tree construction, we combine bootstrap analysis (Felsenstein, 1985) with different alignment and tree construction methods. The PHYLIP resource includes a variety of software tools for these tasks, including seqboot to generate bootstrap replicates, and consense to identify a consensus tree (either from trees inferred based on the bootstrap replicates or from the use of different tree estimation tools). The CONSEL software suite enables users to compute p-values for several testing procedures (Shimodaira and Hasegawa, 2001) to assess confidence levels at different nodes of a phylogenetic tree. Step 7. Overlay tree with experimental data This step is facilitated through the use of software tools explicitly designed for this purpose. A critical (and not at all trivial) element of this step is differentiating annotations based on experiment from those based on homology. Software tools for this task are presented in the Visualization Tools section. Step 8. Differentiate orthologs and paralogs There are two basic approaches to this task. The clusters of orthologous groups (COG) database at NCBI (Tatusov et al., 2000) uses bi-directional top BLAST hits across genomes to generate these clusters, and is a powerful tool for analysis of genomes (Natale et al., 2000). The second basic approach explicitly includes phylogenetic tree construction and analysis, so methods using this approach are expected to have potentially greater specificity of classification. Two new methods have been developed very recently: Resampled Inference of Orthologs (RIO) (Zmasek and Eddy, 2002) and orthostrapper (Storm and Sonnhammer, 2002). Though there are some distinct differences between the methods, both RIO and orthostrapper incorporate bootstrap analysis and comparison of gene and species trees to differentiate orthologs and paralogs. RIO is designed to take advantage
Phylogenomic inference of protein molecular function
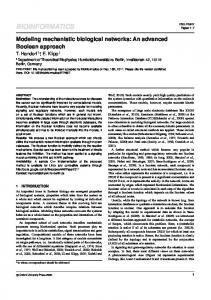
Fig. 3. GTREE software for phylogenomic analysis. Shown above is the GTREE user interface created by our group to correlate a phylogenetic tree with a multiple sequence alignment and experimental data. Data shown in the table are downloaded automatically from GenBank and SwissProt. Columns in the spreadsheet can be resized, re-ordered, inserted and modified. Subtrees can be viewed separately, removed from the tree, or collapsed to view a consensus sequence and consensus attributes. The GTREE software is available for UNIX/Linux platforms, and can be downloaded from the Berkeley Phylogenomics Group website at http://phylogenomics.berkeley.edu/software/. New user interfaces written in Java are under development by our group; these will also integrate protein structure visualization and analysis.
of pre-computed pairwise distances in PFAM alignments, which makes it suitable for rapid inference of orthologous relationships for novel sequences. The Celera Genomics approach to this task used the Bayesian Evolutionary Tree Estimation (BETE) algorithm to construct phylogenetic trees and identify functional subfamilies (Sjölander, 1997, 1998). BETE uses a symmetrized form of relative entropy as a distance measure between profiles constructed using Dirichlet mixture densities (Sjölander et al., 1996) to build a tree, and minimum encoding cost principles to identify subfamilies. BETE subfamilies often correspond to orthologous groups, but may instead contain ultra-paralogs from the same species, or simply very similar proteins (including both paralogs and orthologs). A graphic user interface similar to the one shown in Figure 3 was employed to correlate sequence attributes with the tree topology. This enabled us to further refine the BETE subfamily decomposition in cases where subtrees contained combinations of orthologs and paralogs, and to assign descriptive names to defined subfamilies. Subfamily HMMs were constructed for the final set of ‘subfamilies’ and used to classify sequences identified in the human genome.
BETE tree topologies and automatic subfamily decompositions appear to correlate well with experimental data on protein families, but the method has not been assessed using simulated data experiments. It is extremely fast; an alignment of 300 sequences with 200 columns takes under 3 min on a dual-processor Athlon 1800+MP Linux box (using only one of the two processors). BETE is available upon request to investigators in academia and government laboratories. Step 9. Infer molecular function Complicating matters, even orthology does not always suffice for correct inference of molecular function (Eisen and Wu, 2002; Zmasek and Eddy, 2002). Biological knowledge, when available, should be included in the analysis. If a protein is missing a key residue necessary for a particular enzymatic function, it may not have that function. Similarly, orthologous genes in distantly related species may perform different functions. We look for consistent annotation within subtrees [an approach called subtree neighbors (Zmasek and Eddy, 2002)]. In addition to the subtree neighbors concept, Zmasek and Eddy have extended phylogenomics nomenclature to include two other terms: super-orthologs (genes separated on a tree by only
175
K.Sjölander
speciation, with higher likelihood of functional similarity) and ultra-paralogs (genes in the same organism separated by only duplication; these may have greater functional similarity than with their orthologs in other species).
Structural phylogenomics The explicit integration of structure prediction and analysis in this process—which we call structural phylogenomics— can provide important insights in protein molecular evolution. First, for a significant percentage of proteins encoded in a typical genome, no amount of BLAST or PSI-BLAST searches will identify homologs of known function. Structure prediction in these cases may provide the only clues to molecular function. (N.B. inferences of function based on weak similarity to proteins of solved structure should be made with caution, as the presumed homology may be spurious, and even when the homology is accurate, specificity of function may well have changed.) The Structural Classification of Proteins (SCOP) database (Hubbard et al., 1999) clusters proteins into a hierarchy based on structural and functional similarity, and contains useful information on the often diverse set of functions associated with each fold type. A second use for structure prediction and analysis is the detection of structural domains—independently folding structural building blocks—in a protein family. Because protein domains may be under different evolutionary constraints, combining phylogenomic analysis for individual domains with an analysis based on the entire protein fold can provide clues to the functional roles played by these domains, and help resolve ambiguities in the evolutionary tree topology. A number of webservers are designed explicitly to detect the presence of structural domains. The most successful of these are those that combine predictions from various servers. These meta-servers have been shown by various tests, including the biennial critical assessment of protein structure prediction (CASP) (Marti-Renom et al., 2002), CAFASP (Bourne, 2003) and LiveBench experiments (Fischer and Rychlewski, 2003; Rychlewski et al., 2003) to provide the highest accuracy. The relative performance of the different servers and meta-servers is updated regularly on the LiveBench website at http://bioinfo.pl/LiveBench/. Note that while PFAM (Bateman et al., 2002) and the NCBI Conserved Domain Database (Marchler-Bauer et al., 2003) are fantastic resources, they combine both functional and structural domains (as well as profile/HMMs for short repeats), so that users should be careful not to confuse the two when using results from these servers as the basis for phylogenomic analysis. To confirm the presence of structural domains, particularly if webserver results are somewhat weak, we find it helpful to perform a complementary analysis in the reverse direction. In addition to submitting one or more sequences from the family against a library of HMMs, we construct an HMM for the family using the multiple sequence alignment produced
176
in Step 3 as a template, and then score a sequence database of structural domains [e.g. the Astral Compendium PDB40 datasets (Brenner et al., 2000)]. This bi-directional analysis helps avoid spurious predictions, and is also useful at detecting domain boundaries with greater specificity (Karplus et al., 1997). Third, the simultaneous analysis of changes in sequence, structure and function can enable a user to identify structural motifs conferring subfamily-specific function (Fetrow et al., 1999; Zhang et al., 1999). Structural alignments, such as those available through FSSP (Holm and Sander, 1998) are a good starting point for these analyses.
Phylogenomic visualization software The primary source for phylogenetic tree visualization is the PHYLIP website, but for the specific needs of phylogenomic analysis, additional features are required. Two new tools enable users to annotate trees and overlay tree topologies with experimental data. Zmasek and Eddy (2001a) have produced a tree viewer (ATV), usable as both a Java applet and as an application. ATV is part of a body of Java code available for the phylogenomics developer and user community through the Eddy Lab Forester resource. The GTREE software shown in Figure 3, available from our lab, enables users to integrate a multiple sequence alignment, phylogenetic tree and experimental data (downloaded automatically from various protein databases) to visualize the evolution of functional subtypes in a protein superfamily.
DISCUSSION Phylogenomic analysis has been shown to improve the accuracy of protein function prediction. However, for the biological community to benefit from the potential power of this approach, we must first obtain a clear understanding of its limitations and all potential sources of systematic error. An old adage in computer science—garbage in, garbage out—is all too relevant here. It is absolutely critical that existing errors in database annotations be corrected, and that new annotations entered into the sequence databases include the source of annotation (whether computational or experimental) and are accompanied by sufficient information to enable other investigators to use those annotations accurately. Evidence codes, such as those used by the Gene Ontology Consortium (Ashburner et al., 2000), are essential at this juncture. We also need a clear picture of the inherent issues and dependencies of each of the methods used in phylogenomic analysis. For example, analysis of many pairs of proteins has revealed a ‘twilight zone’ of protein sequence identity where mistakes in homology detection are likely (Rost, 1999). We need to identify the twilight zone of every method used in phylogenomic analysis. Identifying the twilight zone of a method is greatly enhanced by the availability of biologically curated benchmark datasets.
Phylogenomic inference of protein molecular function
Critically, no benchmark datasets are available for the arguably single most important task in phylogenomic analysis: phylogenetic tree construction. The lack of benchmark datasets for the evaluation of protein superfamily phylogeny is not surprising, given that we have no way of knowing the true evolutionary tree. How do we get around these problems? Simulated data experiments are certainly helpful in this regard, but cannot take the place of insights obtained from method application to biological data. If evolution conserves function and structure, then phylogenetic trees that cluster proteins sharing a common molecular function and fold should correspond more closely to the true tree than those that do not. This assumption, if we accept it, provides a framework to enable us to use benchmark datasets of functionally and structurally curated biological data to assess phylogenetic tree accuracy. This allows us to separate protein function prediction (for which definitive feedback of prediction accuracy can be obtained) from reconstruction of the evolutionary tree (for which such feedback is not possible). Issues of convergent evolution can largely be managed by explicitly including similarity in overall fold as well as function. In the absence of such a benchmark dataset, an international ‘experiment’ similar to the biennial CASP experiments (Levitt, 1997), could provide a powerful incentive to algorithm developers. Scientists, perhaps even more than the average member of our species, are competitive beasts. Provide us with a standard of excellence, and we will raise that bar. Understanding evolution is a major challenge, but protein superfamily analysis requires an evolutionary framework in order to ferret out the family secrets. As Theodosius Dobzhansky said, ‘Nothing in biology makes sense except in the light of evolution’ (Dobzhansky, 1973).
ACKNOWLEDGMENTS I thank Patricia Babbitt, Duncan Brown, Joe Felsenstein, Mary Wildermuth and anonymous reviewers for helpful comments. This work was supported in part by Grant no. 0238311 from the National Science Foundation, and by Grant no. R01 HG002769-01 from the National Institutes of Health.
REFERENCES Altschul,S.F., Gish,W., Miller,W., Myers,E.W. and Lipman,D.J. (1990) Basic local alignment search tool. J. Mol. Biol., 215, 403–410. Altschul,S.F., Madden,T.L., Schaffer,A.A., Zhang,J., Zhang,Z., Miller,W. and Lipman,D.J. (1997) Gapped BLAST and PSIBLAST: a new generation of protein database search programs. Nucleic Acids Res., 25, 3389–3402. Ashburner,M., Ball,C.A., Blake,J.A., Botstein,D., Butler,H., Cherry,J.M., Davis,A.P., Dolinski,K., Dwight,S.S., Eppig,J.T. et al. (2000) Gene ontology: tool for the unification of biology. The Gene Ontology Consortium. Nat. Genet., 25, 25–29.
Bairoch,A. and Apweiler,R. (2000) The SWISS-PROT protein sequence database and its supplement TrEMBL in 2000. Nucleic Acids Res., 28, 45–48. Bateman,A., Birney,E., Cerruti,L., Durbin,R., Etwiller,L., Eddy,S.R., Griffiths-Jones,S., Howe,K.L., Marshall,M. and Sonnhammer,E.L. (2002) The Pfam protein families database. Nucleic Acids Res., 30, 276–280. Bork,P. and Koonin,E.V. (1998) Predicting functions from protein sequences—where are the bottlenecks? Nat. Genet., 18, 313–318. Bourne,P.E. (2003) CASP and CAFASP experiments and their findings. Meth. Biochem. Anal., 44, 501–507. Brenner,S.E. (1999) Errors in genome annotation. Trends Genet., 15, 132–133. Brenner,S.E., Koehl,P. and Levitt,M. (2000) The ASTRAL compendium for protein structure and sequence analysis. Nucleic Acids Res., 28, 254–256. Brocchieri,L. (2001) Phylogenetic inferences from molecular sequences: review and critique. Theoret. Popul. Biol., 59, 27–40. Bucka-Lassen,K., Caprani,O. and Hein,J. (1999) Combining many multiple alignments in one improved alignment. Bioinformatics, 15, 122–130. Citerne,H.L., Luo,D., Pennington,R.T., Coen,E. and Cronk,Q.C. (2003) A phylogenomic investigation of CYCLOIDEA-like TCP genes in the Leguminosae. Plant Physiol., 131, 1042–1053. Daubin,V., Gouy,M. and Perriere,G. (2002) A phylogenomic approach to bacterial phylogeny: evidence of a core of genes sharing a common history. Genome Res., 12, 1080–1090. Devos,D. and Valencia,A. (2001) Intrinsic errors in genome annotation. Trends Genet., 17, 429–431. Dobzhansky,T. (1973) The American Biology Teacher, 35, 125–129. Doolittle,R.F. (1995) The multiplicity of domains in proteins. Annu. Rev. Biochem., 64, 287–314. Doolittle,R.F. and Bork,P. (1993) Evolutionarily mobile modules in proteins. Sci. Am., 269, 50–56. Edgar,R.C. and Sjölander,K. (2003) SATCHMO: sequence alignment and tree construction using hidden Markov models. Bioinformatics, 19, 1404–1411. Eisen,J.A. (1998) Phylogenomics: improving functional predictions for uncharacterized genes by evolutionary analysis. Genome Res., 8, 163–167. Eisen,J.A. and Fraser,C.M. (2003) Phylogenomics: intersection of evolution and genomics. Science, 300, 1706–1707. Eisen,J.A. and Hanawalt,P.C. (1999) A phylogenomic study of DNA repair genes, proteins, and processes. Mutat. Res., 435, 171–213. Eisen,J.A. and Wu,M. (2002) Phylogenetic analysis and gene functional predictions: phylogenomics in action. Theoret. Popul. Biol., 61, 481–487. Eisen,J.A., Nelson,K.E., Paulsen,I.T., Heidelberg,J.F., Wu,M., Dodson,R.J., Deboy,R., Gwinn,M.L., Nelson,W.C., Haft,D.H. et al. (2002) The complete genome sequence of Chlorobium tepidum TLS, a photosynthetic, anaerobic, green-sulfur bacterium. Proc. Natl Acad. Sci., USA, 99, 9509–9514. Felsenstein,J. (1985) Confidence limits on phylogenies: an approach using the bootstrap. Evolution, 39, 783–791. Felsenstein,J. (1988) Phylogenies from molecular sequences: inference and reliability. Annu. Rev. Genet., 22, 521–565. Felsenstein,J. (2003) Inferring Phylogenies. Sinauer Associates, Sunderland, MA.
177
K.Sjölander
Fetrow,J.S., Siew,N. and Skolnick,J. (1999) Structure-based functional motif identifies a potential disulfide oxidoreductase active site in the serine/threonine protein phosphatase-1 subfamily. FASEB J., 13, 1866–1874. Fischer,D. and Rychlewski,L. (2003) The 2002 olympic games of protein structure prediction. Protein Eng., 16, 157–160. Fitch,W.M. (1970) Distinguishing homologous from analogous proteins. Syst. Zool., 19, 99–113. Gadelle,D., Filee,J., Buhler,C. and Forterre,P. (2003) Phylogenomics of type II DNA topoisomerases. Bioessays, 25, 232–242. Galperin,M.Y. and Koonin,E.V. (1998) Sources of systematic error in functional annotation of genomes: domain rearrangement, nonorthologous gene displacement and operon disruption. In Silico Biol., 1, 55–67. Gerlt,J.A. and Babbitt,P.C. (2001) Divergent evolution of enzymatic function: mechanistically diverse superfamilies and functionally distinct suprafamilies. Annu. Rev. Biochem., 70, 209–246. Gilks,W.R., Audit,B., De Angelis,D., Tsoka,S. and Ouzounis,C.A. (2002) Modeling the percolation of annotation errors in a database of protein sequences. Bioinformatics, 18, 1641–1649. Gotoh,O. (1996) Significant improvement in accuracy of multiple protein sequence alignments by iterative refinement as assessed by reference to structural alignments. J. Mol. Biol., 264, 823–838. Hasegawa,M. and Fujiwara,M. (1993) Relative efficiencies of the maximum likelihood, maximum parsimony, and neighbor-joining methods for estimating protein phylogeny. Mol. Phylogenet. Evol., 2, 1–5. Hein,J. (1990) Unified approach to alignment and phylogenies. Meth. Enzymol., 183, 626–645. Higgins,D.G., Thompson,J.D. and Gibson,T.J. (1996) Using CLUSTAL for multiple sequence alignments. Meth. Enzymol., 266, 383–402. Holder,M. and Lewis,P.O. (2003) Phylogeny estimation: traditional and Bayesian approaches. Nat. Rev. Genet., 4, 275–284. Holm,L. and Sander,C. (1998) Touring protein fold space with Dali/FSSP. Nucleic Acids Res., 26, 316–319. Hubbard,T.J., Ailey,B., Brenner,S.E., Murzin,A.G. and Chothia,C. (1999) SCOP: a structural classification of proteins database. Nucleic Acids Res., 27, 254–256. Huelsenbeck,J.P. and Rannala,B. (1997) Phylogenetic methods come of age: testing hypotheses in an evolutionary context. Science, 276, 227–232. Huelsenbeck,J.P. and Ronquist,F. (2001) MRBAYES: Bayesian inference of phylogenetic trees. Bioinformatics, 17, 754–755. Karplus,K., Sjölander,K., Barrett,C., Cline,M., Haussler,D., Hughey,R., Holm,L. and Sander,C. (1997) Predicting protein structure using hidden Markov models. Proteins, (Suppl. 1), 134–139. Karplus,K., Barrett,C. and Hughey,R. (1998) Hidden Markov models for detecting remote protein homologies. Bioinformatics, 14, 846–856. Katoh,K., Misawa,K., Kuma,K. and Miyata,T. (2002) MAFFT: a novel method for rapid multiple sequence alignment based on fast Fourier transform. Nucleic Acids Res., 30, 3059–3066. Kuhner,M.K. and Felsenstein,J. (1994) A simulation comparison of phylogeny algorithms under equal and unequal evolutionary rates. Mol. Biol. Evol., 11, 459–468.
178
Lake,J.A. (1991) The order of sequence alignment can bias the selection of tree topology. Mol. Biol. Evol., 8, 378–385. Lander,E.S., Linton,L.M., Birren,B., Nusbaum,C., Zody,M.C., Baldwin,J., Devon,K., Dewar,K., Doyle,M., FitzHugh,W. et al. (2001) Initial sequencing and analysis of the human genome. Nature, 409, 860–921. Levitt,M. (1997) Competitive assessment of protein fold recognition and alignment accuracy. Proteins, (Suppl. 1), 92–104. Marchler-Bauer,A., Anderson,J.B., DeWeese-Scott,C., Fedorova,N.D., Geer,L.Y., He,S., Hurwitz,D.I., Jackson,J.D., Jacobs,A.R., Lanczycki,C.J. et al. (2003) CDD: a curated Entrez database of conserved domain alignments. Nucleic Acids Res., 31, 383–387. Marcotte,E.M., Xenarios,I., van Der Bliek,A.M. and Eisenberg,D. (2000) Localizing proteins in the cell from their phylogenetic profiles. Proc. Natl Acad. Sci. USA, 97, 12115–12120. Marti-Renom,M.A., Madhusudhan,M.S., Fiser,A., Rost,B. and Sali,A. (2002) Reliability of assessment of protein structure prediction methods. Structure (Cambridge), 10, 435–440. McClure,M.A., Vasi,T.K. and Fitch,W.M. (1994) Comparative analysis of multiple protein-sequence alignment methods. Mol. Biol. Evol., 11, 571–592. Mitchison,G.J. (1999) A probabilistic treatment of phylogeny and sequence alignment. J. Mol. Evol., 49, 11–22. Natale,D.A., Galperin,M.Y., Tatusov,R.L. and Koonin,E.V. (2000) Using the COG database to improve gene recognition in complete genomes. Genetica, 108, 9–17. Notredame,C., Higgins,D.G. and Heringa,J. (2000) T-Coffee: A novel method for fast and accurate multiple sequence alignment. J. Mol. Biol., 302, 205–217. Park,J., Karplus,K., Barrett,C., Hughey,R., Haussler,D., Hubbard,T. and Chothia,C. (1998) Sequence comparisons using multiple sequences detect three times as many remote homologues as pairwise methods. J. Mol. Biol., 284, 1201–1210. Pellegrini,M., Marcotte,E.M., Thompson,M.J., Eisenberg,D. and Yeates,T.O. (1999) Assigning protein functions by comparative genome analysis: protein phylogenetic profiles. Proc. Natl Acad. Sci. USA, 96, 4285–4288. Rost,B. (1999) Twilight zone of protein sequence alignments. Protein Eng., 12, 85–94. Rychlewski,L., Fischer,D. and Elofsson,A. (2003) LiveBench-6: large-scale automated evaluation of protein structure prediction servers. Proteins, 53(Suppl. 6), 542–547. Saitou,N. and Nei,M. (1987) The neighbor-joining method: a new method for reconstructing phylogenetic trees. Mol. Biol. Evol., 4, 406–425. Sankoff,D., Morel,C. and Cedergren,R.J. (1973) Evolution of 5S RNA and the non-randomness of base replacement. Nat. New Biol., 245, 232–234. Shimodaira,H. and Hasegawa,M. (2001) CONSEL: for assessing the confidence of phylogenetic tree selection. Bioinformatics, 17, 1246–1247. Sicheritz-Ponten,T. and Andersson,S.G. (2001) A phylogenomic approach to microbial evolution. Nucleic Acids Res., 29, 545–552. Sjölander,K. (1997) Bayesian Evolutionary Tree Estimation. In Proceedings of the Eleventh International Conference on Mathematical and Computer Modelling and Scientific Computing, Computational Biology Session “Computing in the Genome Era”, Washington D.C.
Phylogenomic inference of protein molecular function
Sjölander,K. (1998) Phylogenetic inference in protein superfamilies: analysis of SH2 domains. Proc. Int. Conf. Intell. Syst. Mol. Biol., 6, 165–174. Sjölander,K., Karplus,K., Brown,M., Hughey,R., Krogh,A., Mian,I.S. and Haussler,D. (1996) Dirichlet mixtures: a method for improved detection of weak but significant protein sequence homology. Comput. Appl. Biosci., 12, 327–345. Storm,C.E. and Sonnhammer,E.L. (2002) Automated ortholog inference from phylogenetic trees and calculation of orthology reliability. Bioinformatics, 18, 92–99. Swofford,D. (2002) PAUP∗ . Phylogenetic Analysis Using Parsimony (∗ and Other Methods). Version 4. Sinauer Associates. Tatusov,R.L., Galperin,M.Y., Natale,D.A. and Koonin,E.V. (2000) The COG database: a tool for genome-scale analysis of protein functions and evolution. Nucleic Acids Res., 28, 33–36. Thompson,J.D., Plewniak,F. and Poch,O. (1999a) BAliBASE: a benchmark alignment database for the evaluation of multiple alignment programs. Bioinformatics, 15, 87–88. Thompson,J.D., Plewniak,F. and Poch,O. (1999b) A comprehensive comparison of multiple sequence alignment programs. Nucleic Acids Res., 27, 2682–2690. Venter,J.C., Adams,M.D., Myers,E.W., Li,P.W., Mural,R.J., Sutton,G.G., Smith,H.O., Yandell,M., Evans,C.A., Holt,R.A.
et al. (2001) The sequence of the human genome. Science, 291, 1304–1351. Vienne,A., Rasmussen,J., Abi-Rached,L., Pontarotti,P. and Gilles,A. (2003) Systematic phylogenomic evidence of en bloc duplication of the ancestral 8p11.21–8p21.3-like region. Mol. Biol. Evol., 20, 1290–1298. Wheeler,W.C., Gatesy,J. and DeSalle,R. (1995) Elision: a method for accommodating multiple molecular sequence alignments with alignment-ambiguous sites. Mol. Phylogenet. Evol., 4, 1–9. Zhang,B., Rychlewski,L., Pawlowski,K., Fetrow,J.S., Skolnick,J. and Godzik,A. (1999) From fold predictions to function predictions: automation of functional site conservation analysis for functional genome predictions. Protein Sci., 8, 1104–1115. Zmasek,C.M. and Eddy,S.R. (2001a) ATV: display and manipulation of annotated phylogenetic trees. Bioinformatics, 17, 383–384. Zmasek,C.M. and Eddy,S.R. (2001b) A simple algorithm to infer gene duplication and speciation events on a gene tree. Bioinformatics, 17, 821–828. Zmasek,C.M. and Eddy,S.R. (2002) RIO: Analyzing proteomes by automated phylogenomics using resampled inference of orthologs. BMC Bioinformatics, 3, 14.
179