GENEOrder/index.html. GeneOrder .... genome sequence into the 'Database' box. Another Gen ... selects from the drop-down menu 'NCBI' for both the database ...
BIOINFORMATICS
Vol. 17 no. 2 2001 Pages 162–166
GeneOrder: comparing the order of genes in small genomes Raja Mazumder 1, Ashok Kolaskar 2 and Donald Seto 1,∗ 1 School
of Computational Sciences, George Mason University, 10900 University Boulevard, MSN 4E3, Manassas, VA 20110, USA and 2 Bioinformatics Program, American Type Culture Collection, 10801 University Boulevard, Manassas, VA 20110, USA Received on July 8, 2000; revised on October 9, 2000; accepted on November 21, 2000
ABSTRACT Motivation: The recent rapid rise in the availability of whole genome DNA sequence data has led to bottlenecks in their complete analysis. Specifically, there is a need for software tools that will allow mining of gene and putative gene data at a whole genome level. These new tools will complement the current set already in use for studying specific aspects of individual genes and putative genes in detail. A key software challenge is to make them userfriendly, without losing their flexibility and capability for use in research. Results: The creation of GeneOrder—a web-based interactive, computational tool—allows researchers to compare the order of genes in two genomes. It has been tested on full genome sequence data for viruses, mitochondria and chloroplasts that were obtained from the NCBI GenBank database. It is accessible at http://www.bif.atcc.org/ GENEOrder/index.html. GeneOrder prepares the comparison in table form, listing the order of similar genes. Hyperlinks are provided from this output; these lead to the ‘Protein Coding Regions’ in the NCBI database.
INTRODUCTION An increasingly large number of full genome sequences from different organisms are becoming available to the public. To date, more than 35 large genome sequences are available, and this number is projected to reach in excess of 100 in about a year. Additionally, the number of smaller genomes, such as mitochondria, viruses and chloroplasts, are expected to be available even more rapidly. These developments leave comparative genomics poised to give a better understanding of biological functions. This will also help in identifying new low cost DNA sequencing approaches to scientific questions. One approach often used in comparative genomics is to discover common and related genes in the organisms, and ∗ To whom correspondence should be addressed.
162
to study the differences in their sequences. Putative genes are assigned the function based on sequence similarity with known genes. Sequence similarity is also used to deduce evolutionary relationships. These comparisons of full genome sequences have yielded interesting and useful results (Afonso et al., 2000; Hannenhalli et al., 1995). Programs such as BLAST (Altschul et al., 1990) and FASTA (Pearson, 1990) have contributed significantly in the analysis of genomes. Whole genome analyses, such as gene order studies, have received less attention. The comparison of the gene order of similar genes can give us insight into gene regulation, and will allow investigators to study gene–gene communication. Gene order studies have been carried out for few bacterial species and eukaryotic organisms (Mushegian and Koonin, 1996; Gilley and Fried, 1999; Subramanian et al., 2000). Similarly, studies have been carried out to compare the gene order among fully sequenced viruses, mitochondria, and chloroplasts (Hannenhalli et al., 1995; Boore and Brown, 1998; Blanchette et al., 1999; Turmel et al., 1999; Afonso et al., 2000). The apparent dearth in these types of studies may be due to the non-availability of user-friendly interactive software packages. The Kyoto Encyclopedia of Genes and Genomes (KEGG) website has a web-based program that allows one to find the position of a gene in the physical map of 35 fully sequenced genomes. This program also clusters similar genes in a pair of genomes from the precomputed results. However, only pre-defined genomes are displayed with no options to enter new genomes. This manuscript describes the web-based bioinformatics software that has been developed to remedy this situation. The importance of gene order studies in comparative genomics can be realized by the recent conference in Montreal, Canada (‘Conference on Gene Order Dynamics, Comparative Maps and Multigene Families,’ September 2000). c Oxford University Press 2001 �
GeneOrder for genome comparisons
MATERIALS AND METHODS Algorithm Two full genome sequence entries from the NCBI GenBank database are considered through their GenBank accession numbers. One genome is called the reference database genome, and the other the query genome. In the GenBank database, annotations include the sequence of each of the putative proteins obtained by translating the open reading frames. These gene products are listed sequentially. Protein sequences from the annotations are retrieved from GenBank entries. The proteins from the reference organism are organized into a database that can be queried using BLASTP. The proteins from the query organism are also organized into a BLASTP format. The query proteins are then queried against the database sequentially using the BLASTP program. If the alignment score is equal to or exceeds the pre-assigned BLASTP high score threshold value, then the genes are paired and their gene numbers are extracted and stored. Standard graphical programs to plot this data in the x–y plane can be used. Program description GeneOrder is an interactive web-based application that primarily uses the ‘gt2fasta,’ ‘setdb,’ and ‘BLASTP’ programs from WU-BLAST (http://BLAST.wustl.edu/). Perl and Java scripts were written to connect the programs, and to retrieve the alignments and high scores from the BLASTP run. The basis of this comparison rests on the BLASTP program (Altschul et al., 1990; Gish and States, 1993; Karlin and Altschul, 1993). If the scores fall within the ranges specified by the user, then the Perl script extracts gene numbers and BLASTP high score value, and creates an output table. Hyperlinks in this output table allow the user to view the protein coding regions. A flow chart of this process is shown in Figure 1. Parameters The user enters a GenBank accession number for the genome sequence into the ‘Database’ box. Another GenBank accession number for the second genome sequence to be compared is entered into the ‘Query’ box. The user selects from the drop-down menu ‘NCBI’ for both the database and the query. The user may also specify the BLASTP high score parameters in three ranges. These ranges are entered into the ‘A’, ‘B’ and ‘C’ boxes. The user can specify any values to these ranges above 75. Currently, the default scores are set at [200–∞) for Range A, [100–200) for Range B and [75–100) for Range C. GeneOrder test The GenBank accession numbers of the genome pairs used for the validation study are as follows: ovine
Get GenBank file from NCBI website
Problem during process
Yes
No
Error message
Stop
Remove unnecessary information and save
Convert to FASTA format
Convert to database format for BLASTP
Break query file into single query. Save each query in a temporary file. BLASTP against database.
Get BLASTP results based on selected ranges
Extract and print table
Fig. 1. Flow chart of GeneOrder.
adenovirus OAV287 (U40839) against itself; human adenovirus HAD12 (X73487) against ovine adenovirus OAV287 (U40839); poxvirus vaccinia, strain Copenhagen (M35027) against poxvirus variola, strain Bangladesh1975 (L22579); poxvirus vaccinia, strain Copenhagen (M35027) against entomopoxvirus Melanoplus sanguinipes MsEPV (AF063866); human mitochondrion (NC 001807) and chicken mitochondrion (NC 001323); and Zea mays chloroplast (X86563) and Arabidopsis thaliana chloroplast, strain Columbia (AP000423).
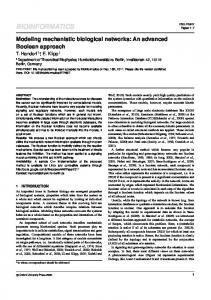
RESULTS AND DISCUSSION GeneOrder application description Results of the validation of GeneOrder program are shown in Figure 2. The initial output of the program is in the form of a table and is shown for ovine adenovirus (OAV287) against human adenovirus (HAD12) in Table 1. Default values for the range A, B, and C were used. In column ‘X’, gene numbers from query organism, as entered in the Query box, are given. In column ‘Y’, 163
R.Mazumder et al.
Human adenovirus (HAV12)
Ovine adenovirus (OAV287)
A 35 30 25 20 15 10 5 0 0
10
20
30
B
30 25 20 15 10 5 0
40
0
5
Chicken mitochondrion
Variola (Bangladesh)
150 100 50 0 0
100
200
300
0
25
5
10
15
Human mitochondrion
E
80 60 40 20 0
F
250 Pox virus (MsEPV)
Z. mays chloroplast
20
14 12 10 8 6 4 2 0
Vaccinia (Copenhagen)
100
15
D
C
200
10
Ovine adenovirus (OAV287)
Ovine adenovirus (OAV287)
200 150 100 50 0
0
50
100
150
A. thaliana chloroplast
0
50
100
150
200
250
Pox virus (Vaccinia)
Fig. 2. Comparison of the gene order between pairs of genomes. (A) Ovine adenovirus OAV287 against itself. (B) Human adenovirus HAD12 against ovine adenovirus OAV287. (C) Orthopox virus vaccinia, strain Copenhagen against variola, strain Bangladesh-1975. (D) Mitochondria from human and chicken. (E) Chloroplasts from Z.mays and A.thaliana. (F) Orthopox virus vaccinia, strain Copenhagen against entomopoxvirus, strain M.sanguinipes(MsEPV).
the gene number of the organism to which the query gene is compared is given. This is a function of a score above the threshold value initially specified by the user or the default. The letters A, B, and C denote the level of identity based on the BLASTP high scores as specified by the user. For example, gene number 5 of ovine adenovirus OAV287 (U40839) aligns with gene number 5 of human adenovirus HAV12 (X73487), with a BLASTP high score of 737 (probability of matching by chance of 4.3 × 10−77 ). Since this is ≥ 200, the suffix A appears after the gene number. Similarly, the twelfth 164
gene of OAV287 aligns with the thirteenth gene of HAD12 with a BLASTP score of 91. The suffix C therefore appears after 13. The BLASTP high score for OAV287 gene 13 and HAD12 gene 14 is 121, and hence the suffix B. These default ranges were chosen for the following reasons. A BLASTP high score of ≥ 200 extracts the homologous proteins, with the possible exceptions of large proteins. If the high score is in the range of 100–200, then the proteins are likely to be homologs. However, a few of these 100–200 range pairings may also be for nonhomologous matches. The 75–100 range matches may
GeneOrder for genome comparisons
Table 1. Typical output from GeneOrder. The inputs are GenBank accession numbers. The suffix A, B, and C as explained in the text are ranges for the BLASTP high scores [200–∞), [100–200), and [75–100) respectively
X (U40839) Query (Ovine Adenovirus OAV287)
Y (X73487) Database (Human Adenovirus HAD12)
5 6 7 8 9 10 12 13 14 15 16 17 19 20 22
5A 6A 8A 9A 10A 11A 13C 14B 15A 16A 17A 18A 19A 24A 25C
give homologous protein pairs in a few cases, but will require additional and more careful analyses of alignments and related data. This range is added to avoid missing any possible homologous proteins. Again, hyperlinks in this tabular output allow the user to go to the protein coding regions of the database and the query organism at the NCBI site. The user can use any plotting program to view the output graphically. For example, in our laboratory, the GeneOrder output is graphically represented in Figure 2 by using the ‘Chart Wizard’ option of ‘Microsoft Excel.’ The data shown in the Figure 2 was generated using the value 200 in all three boxes, and thus the BLASTP score of ≥ 200 was set in all the three ranges. Figure 2A shows the results of the comparison of gene order of OAV287 against itself. The protein product of gene 24 pairs with itself, as well as with the protein products of genes 28 and 26. Their BLASTP high scores are 947, 343 and 270 respectively. Visual inspections of protein alignments of these sequences reveal that the sequence similarity is maintained. This suggest that genes 24, 26, 28 are products of gene duplication, and can be seen in Figure 2A. This program identifies paralogous genes. Figure 2B shows that the gene order of both the human and ovine adenoviruses is co-linear. Figure 2C displays the gene order in a poxvirus pair as being conserved to a large extent. In contrast, the conservation of gene order is absent between the vaccinia and MsEPV poxvirus genomes (Figure 2F). Figure 2D demonstrates that the gene order between human and chicken mitochondria is conserved. Figure 2E shows that there may have been
major genomic rearrangements between the Z.mays and A.thaliana chloroplast genomes. Though most of the genes are co-linear in the two chloroplasts, there appear to be translocations and inversion of the gene order (Figure 2E). The average run time of GeneOrder application is dependent upon the availability of the ATCC and NCBI servers. Currently GeneOrder is located on a SUN Ultra 10 server. In the validations presented here, the tabular output for genomes having ∼200 genes took approximately 1–3 min on an iMac (233 MHz) with ethernet connection.
Limitations GeneOrder retrieves data from the NCBI database as a GenBank file format, and uses this data to generate a representative gene order. Therefore, it is dependent upon the time required to query the NCBI database. With the current version, only the NCBI database with GenBank accession numbers can be used, i.e. any non-GenBank designation leads to an error message. Another constraint is that the total number of genes within each genome is limited to approximately 200 genes. This limitation is due to the small disk space provided to store the output temporary files. These limitations are being addressed to enhance the versatility of the software. Conclusions This computational tool, GeneOrder, will aid researchers in determining and analyzing the types and frequencies of genome rearrangements. Work in our laboratory is in progress to compare the gene order of larger genomes, such as complete bacterial and eukaryotic chromosomes. Efforts also include expanding the options to allow accessing other databases including the users’ proprietary database, and to allow comparison of proprietary genomes. We also plan to archive full genome sequence data on our server. This will improve the response time. ACKNOWLEDGEMENTS We thank Truc Nguyen for developing the web-based interface; G.F.Kutish for directing us to public domain software; J.M.Yulish for his SX program; E.V.Koonin for his suggestion on defining output ranges; and E.Blair and K.Lauer for testing the alpha version of GeneOrder. We are immensely indebted to Gabrielle DeFord and Deirdre Mullervy for suggestions to the text. REFERENCES Afonso,C.L., Tulman,E.R., Lu,Z., Zsak,L., Kutish,G.F. and Rock,D.L. (2000) The genome of fowlpox virus. J. Virol., 74, 3815–3831.
165
R.Mazumder et al.
Altschul,S.F., Gish,W., Miller,W., Myers,E.W. and Lipman,D.J. (1990) Basic local alignment search tool. J. Mol. Biol., 215, 403– 410. Blanchette,M., Kunisawa,T. and Sankoff,D. (1999) Gene order breakpoint evidence in animal mitochondrial phylogeny. J. Mol. Evol., 49, 193–203. Boore,J.L. and Brown,W.M. (1998) Big trees from little genomes: mitochondrial gene order as a phylogenetic tool. Curr. Opin. Genet. Dev., 8, 668–674. Gilley,J. and Fried,M. (1999) Extensive gene order differences within regions of conserved synteny between the Fugu and human genomes: implications for chromosomal evolution and the cloning of disease genes. Hum. Mol. Genet., 8, 1313–1320. Gish,W. and States,D.J. (1993) Identification of protein coding regions by database similarity search. Nature Genet., 3, 266–272. Hannenhalli,S., Chappey,C., Koonin,E.V. and Pevzner,P.A. (1995)
166
Genome sequence comparison and scenarios for gene rearrangements: a test case. Genomics, 30, 299–311. Karlin,S. and Altschul,S.F. (1993) Applications and statistics for multiple high-scoring segments in molecular sequences. Proc. Natl Acad. Sci. USA, 90, 5873–5877. Mushegian,A.R. and Koonin,E.V. (1996) Gene order is not conserved in bacterial evolution. Trends Genet., 12, 289–290. Pearson,R. (1990) Rapid and sensitive sequence comparison with FASTP and FASTA. Meth. Enzymol., 183, 63–98. Subramanian,G., Koonin,E.V. and Aravind,L. (2000) Comparative genome analysis of the pathogenic spirochetes Borrelia burgdorferi and Treponema pallidum. Infect. Immun., 68, 1633–1648. Turmel,M., Otis,C. and Lemieux,C. (1999) The complete chloroplast DNA sequence of the green alga Nephroselmis olivacea: insights into the architecture of ancestral chloroplast genomes. Proc. Natl Acad. Sci. USA, 96, 10248–10253.