Vol. 20 no. 4 2004, pages 452–459 DOI: 10.1093/bioinformatics/btg428
BIOINFORMATICS
RAD and the RAD Study-Annotator: an approach to collection, organization and exchange of all relevant information for high-throughput gene expression studies E. Manduchi∗, G. R. Grant, H. He, J. Liu, M. D. Mailman, A. D. Pizarro, P. L. Whetzel and C. J. Stoeckert Jr Center for Bioinformatics, University of Pennsylvania, 14th Floor Blockley Hall, 423 Guardian Drive, Philadelphia, PA 19104-6021, USA
ABSTRACT Motivation: Gene expression array technology has become increasingly widespread among researchers who recognize its numerous promises. At the same time, bench biologists and bioinformaticians have come to appreciate increasingly the importance of establishing a collaborative dialog from the onset of a study and of collecting and exchanging detailed information on the many experimental and computational procedures using a structured mechanism. This is crucial for adequate analyses of this kind of data. Results: The RNA Abundance Database (RAD; http://www. cbil.upenn.edu/RAD) provides a comprehensive MIAMEsupportive infrastructure for gene expression data management and makes extensive use of ontologies. Specific details on protocols, biomaterials, study designs, etc. are collected through a user-friendly suite of web annotation forms. Software has been developed to generate MAGE-ML documents to enable easy export of studies stored in RAD to any other database accepting data in this format (e.g. ArrayExpress). RAD is part of a more general Genomics Unified Schema (http://www.gusdb.org), which includes a richly annotated gene index (http://www.allgenes.org), thus providing a platform that integrates genomic and transcriptomic data from multiple organisms. This infrastructure enables a large variety of queries that incorporate visualization and analysis tools and have been tailored to serve the specific needs of projects focusing on particular organisms or biological systems. Availability: The system is freely available. Information on how to obtain it and how to install it can be found at http://www. cbil.upenn.edu/RAD/RAD-installation.htm Contact:
[email protected]
∗ To
whom correspondence should be addressed.
452
INTRODUCTION An increasing number of researchers are incorporating into their studies experiments utilizing high-throughput gene expression technology because they provide a snapshot of the RNA abundance levels of thousands of transcripts simultaneously for samples of interest. Array gene expression data are used in the investigation of a variety of crucial functional genomics questions including: which genes are expressed in a given sample, which genes are differentially expressed between samples, what classes do samples or genes fall into, how expression evolves over time, what are the relevant gene networks, etc. In parallel, the scientific community has begun addressing the infrastructure challenges presented by the analyses of array gene expression data and the consequent data management needs. There are many technical steps involved in data generation, such as array manufacturing, RNA extraction, labeling, hybridization, scanning and image quantification. Thus, there are many places where errors can occur and protocols might need optimization to minimize noise. Moreover, information on the details of the bench work, typically kept in lab notebooks or scattered files, as well as information regarding scanning and image quantification settings, is often very relevant to the computational analyses and needs to be passed on to the researchers doing the latter. Exchange of files between wet labs and bioinformatics labs and the use of free text add more room for error. Besides the need of a collaborative dialog between bench investigators and bioinformaticians doing the data analysis from the onset of a study, these challenges underscore the importance of a structured storage mechanism for such information. This also calls for the use of known terms with a well-defined meaning, i.e. of controlled vocabularies or of more complex ontologies, to facilitate experimental annotation and minimize errors originated by the use of free text. [By ontology we mean ‘a specification of concepts together with the relationships between these concepts’, Gruber (1993).] Finally, user-friendly means Bioinformatics 20(4) © Oxford University Press 2004; all rights reserved.
Downloaded from http://bioinformatics.oxfordjournals.org/ by guest on February 25, 2013
Received on June 19, 2003; revised on August 9; accepted on August 11, 2003 Advance Access publication January 22, 2004
RAD and the RAD Study-Annotator
SYSTEMS AND METHODS RAD: background and recent improvements The original RAD schema has been described previously (Stoeckert et al., 2001; Manduchi et al., 2001). Our third version of RAD includes revisions and expansions made in order to incorporate the most recent efforts of the MGED working groups and to better structure the descriptions of biomaterials and study designs. Moreover, we have built on our experience analyzing array data. RAD is part of a more general platform: the Genomics Unified Schema (GUS; http://www.gusdb.org),
which integrates genomic and transcriptomic data. GUS has a relational schema (implemented in Oracle) and a lightweight Perl object layer, which can be used by an application framework that loads data and facilitates communications between the database and other applications. A Java object layer, which has a role similar to that of the Perl object layer, is also being implemented. Source code (e.g. schema, object layer, etc.) is available through a CVS repository hosted by the Sanger Institute (http://cvsweb.sanger.ac.uk). In this paper, we use the term GUS (and RAD) to denote both the schema and our specific database instance. Currently RAD is composed of about 65 tables, some of which represent generic concepts that can be specialized by views. For example, RAD can accommodate data from different platforms and coming from different quantification software packages using the same generic tables, (Composite)ElementImp and (Composite)ElementResultImp, respectively. Although the majority of the data currently stored in RAD comes from spotted oligo arrays, photolithographic oligo arrays, and spotted cDNA microarrays, SAGE data can be stored as well. In this paper, however, we focus on array data. The RAD tables can be subdivided into nine major groups. (Links to summary snapshots on each of the groups and to a schema browser with detailed descriptions of all the tables are available at http://www.cbil.upenn.edu/RAD). (i) Assay to quantification tables. By ‘assay’ we mean a one- or two-channel hybridization. The tables in this group are used to store information about each individual hybridization, its scanning(s) [which we call ‘acquisition(s)’] and its image quantification(s). This includes descriptions of the hybridization, scanning and image quantification protocols, along with their parameter settings. (ii) Study design tables. By ‘study’ we mean a collection of assays which have been planned and carried out to investigate particular questions of interest and that might be the focus of a given publication. (The MGED term for ‘study’ is ‘experiment’ but we prefer to avoid the use of this overloaded term in this context). The study design tables store information about the general experimental design for a particular study, including structured information about the design types and factors of interest. The assays can be divided into groups according to the values of such factors. Ontologies for study design types and study factor types are being utilized and expanded in conjunction with the MGED OWG efforts. (iii) Biomaterial tables. These tables are meant to capture detailed information about the samples hybridized to the array (organism, relevant descriptors, such as sex, age, developmental stage, organism part, etc.), as well as a description of any treatment performed to obtain such samples up to nucleic acid extraction and labeling.
453
Downloaded from http://bioinformatics.oxfordjournals.org/ by guest on February 25, 2013
for entering all this information should be provided to bench investigators. As the international community has recognized the challenges and needs illustrated above, efforts have been focused on addressing them such as those of the working groups of the Microarray Gene Expression Data (MGED) society (http://www.mged.org): MIAME, OWG, MAGE and Data Transformation and Normalization. The Minimal Information About a Microarray Experiment (MIAME) working group has compiled a list of ‘minimum’ information deemed crucial to enable interpretability, verifiability and reproducibility of a gene expression study (Brazma et al., 2001). In October 2002, several major scientific journals endorsed the MIAME guidelines for publishing microarray gene expression data (expressed in the letter by Ball et al., 2002). The Ontology Working Group (OWG) has concentrated its efforts on ‘the development of ontologies for microarray experiment description and biological material (biomaterial) annotation’ (Stoeckert and Parkinson, 2003). The Micro Array and Gene Expression (MAGE) working group has developed a data exchange model (MAGE-OM) and a data exchange format (MAGE-ML) to facilitate exchange of this information (Spellman et al., 2002). The Data Transformation and Normalization working group is focusing on the development of standards for recording how microarray data are transformed and normalized prior to downstream analyses. Besides the need to build suitable databases and interfaces to enable bench investigators to enter all the relevant annotation into such databases, there is also a need to store all remaining information relative to a microarray study including image quantification results, pre-processing procedures and results, analysis results, as well as quality control and data integrity measures. This will not only allow for verification of a study but will also enable further research. The latest release of our RNA Abundance Database (RAD; www.cbil.upenn.edu/RAD), together with the new RAD Study-Annotator, represent our most recent efforts to address all of the needs described above. In what follows we describe the most recent improvements to the RAD schema and the new study annotation tool. We will demonstrate the rewards of these efforts in terms of powerful resources that have been developed utilizing this infrastructure.
E.Manduchi et al.
(vi) Processing tables. These tables capture protocols, parameter settings and results of any series of lowlevel transformations (e.g. flagging, normalizations, averaging, etc.) applied to the data from (v) prior to performing any other down-stream analyses. (vii) Analysis result tables. These tables capture protocols, parameter settings and results of computational analyses performed on (pre-processed) data to address questions of interest (e.g. differential expression, class discovery, class prediction, etc.). (viii) Miscellaneous tables. These are a variety of tables used to store information applicable to more than one of the above groups of tables e.g. Protocol and Protocol Parameters (to store description and parameter settings of any kind of protocol) or OntologyEntry, to point to terms for a variety of ontology classes, from TechnologyType to OrganismPart and to ExperimentDesignType. (ix) Integrity statistics tables. These tables are used to store measures that can be used to check whether the data have been corrupted during the loading/normalization process. A more detailed description of these can be found in Grant et al. (2003). Additionally, RAD utilizes auxiliary tables from other components of GUS. Tables in the Shared Resources (SRes)
454
component are used to store contact information for individuals or affiliations, bibliographic references and ontologies of various kinds. The Core component stores data loading information as well as user, group and project information which aid in maintaining data privacy. The Processing and the Analysis Result tables are very flexible and have been designed to accommodate a variety of different pre-processing and downstream analysis results. We have taken a problem-driven approach to guide us in their design, starting with case studies and examining which setting was most suitable to capture them all. For example, the various input data (e.g. pre-processing results for a set of genes in a set of assays) to a downstream analysis are grouped together and referenced as an AnalysisInput. Information on the specific application of the analysis method and parameter settings is captured in an Analysis and an AnalysisParam table. An AnalysisResultImp table is subclassed (using views) to represent the type of report specific to the analysis type. For example, each entry in this table relative to a clustering of genes will usually have a reference to a gene and a position in a tree or cluster number. As another example, attaching P -values obtained from a differential expression analysis will usually result in entries having a reference to a gene and a P -value.
The RAD Study-Annotator The RAD Study-Annotator is a suite of web-based forms that are currently used to collect and upload into RAD information relative to table groups (i)–(iii) and (viii) above and auxiliary information such as contacts, bibliographic references etc (the rest of the tables are populated via a series of plug-ins relying on the Perl object layer). The main function of the Study-Annotator is to enable the bench investigator to enter into a relational database the kind of information that would be typically recorded by hand in a lab notebook or in scattered computer files. A detailed checklist of the information that can be collected through the RAD Study-Annotator can be found at http://www.cbil.upenn. edu/RAD/RAD-data_sub.htm. Besides covering all parts of the MIAME checklist relative to the tables in groups (i)–(iii) and (viii) above, these forms also allow entering of details on the experiments down to very fine levels, if desired. The forms are written in PHP and exploit the Perl object layer to load data into RAD. JavaScript has also been incorporated to provide a certain level of front-end data integrity checks. There are over 25 different forms, each operating on one or more tables in the database. These forms have been grouped into modules, which represent the different RAD table groups they refer to. Each user might belong to one or more groups of investigators and might be involved in one or more projects. A given study will refer to one particular project and to one particular group of investigators. Figure 1 illustrates the workflow behind the annotation of a given study. After logging-in,
Downloaded from http://bioinformatics.oxfordjournals.org/ by guest on February 25, 2013
The tables have been designed to match the MAGE object model for these types of entries and rely on a variety of ontologies, which are being expanded and improved in parallel with the MGED OWG efforts. Moreover, these tables have been designed so that an investigator, if desired, can provide a description of the manipulations done on given biomaterials even at the very fine level of ‘atomic actions’ (e.g. ‘wait’, ‘dilute’, ‘concentrate’, etc.). (iv) Platform tables. These tables store information about the array used: platform type (e.g. spotted oligo array, photolithographic oligo array, spotted cDNA microarray, etc.), layout, and descriptions of each element on the array, including suitable identifiers, which can then be mapped to the extended information stored in another component of GUS, called Database of Transcribed Sequences (DoTS), comprising rich sequence annotation. This mapping is done through appropriate materialized views. In our own instance of GUS, we update these materialized views every time a new release of our DoTS entries is generated. (v) Quantification result tables. These tables contain the results from image quantification(s) of the scanned arrays, element by element, taken from the specific software utilized to this end. All measurements provided by the software for each element are stored. (For SAGE, tag counts are stored in these tables.)
RAD and the RAD Study-Annotator
Logical Flow New User Registration
Login
Data Preferences (Group, Project)
Study
From Assay to Quantification Module I
Study Design
Misc
Biomaterials (samples, treatments)
Module II
Module III
a user selects the group and project to which the study (s)he wants to annotate belongs. At this point (s)he can: • enter a new study and start its annotation or • select an existing study to resume its annotation or • use the miscellaneous forms to enter protocols, contacts
and bibliographic references, which will be referred to in subsequent forms. Alternatively, this information can be entered when needed. Upon selection of the study to annotate, the user can proceed to the annotation modules I–III. Each of these modules corresponds to one of the table groups (i)–(iii) in that its forms will be populating tables in this group. Ease of use is an important component of the forms and this is addressed in part with multiple access points for annotation and with batching of annotation that is common to multiple entries. Although there are dependences between the forms (e.g. acquisition information can only be entered after the assay information has been entered), users have access at any time to all forms so that they can decide on the order in which to enter the annotation (depth-first versus breadth-first). This allows them to choose the best way to batch the particular information to be entered so as to minimize repeated calls to the same forms and it also allows them to enter the information over multiple sessions. For example, once assays have been entered, acquisition information can be entered in batch for all those assays sharing the same acquisition protocol and scanner settings. As another example of batching, if 20 individual mice are used in a study, all those having identical characteristics can be entered in batch, together with such characteristics. There are various combinations in which the forms can be used so to batch the information. The optimal combination for a given data set will depend on the particular kind of information available for that data set. An important characteristic of the forms is that they are driven by ontologies. Select menus are used to provide terms
455
Downloaded from http://bioinformatics.oxfordjournals.org/ by guest on February 25, 2013
Fig. 1. Logical flow of the RAD Study-Annotator.
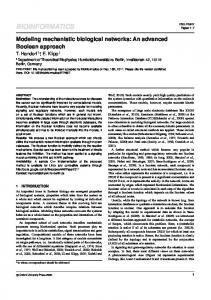
with precise meanings whenever available, minimizing free text entries, which can lead to typos and other errors. These menus are generated on-the-fly by querying the data in RAD. Besides terms from the MGED Ontology, terms from external ontologies can also be imported (Fig. 2) and users can propose new ontology terms. In addition to using ontologies to minimize free text entries, we have designed forms specific to particular protocols, so that the names and, when applicable, the unit types of the parameters are automatically displayed and do not need to be entered in a text field by the user. For example, our users might utilize a variety of quantification software packages, e.g. ArrayVision (http://www.imagingresearch.com/products/ARV.asp), GenePix (http://www.axon.com/GN_GenePixSoftware.html), Spot (http://experimental.act.cmis.csiro.au/Spot/index.php), the Affymetrix MAS (4.0 or 5.0) software (http://www. affymetrix.com/index.affx), etc. For the packages most frequently used by our collaborators, we have created custom forms to enter their specific parameter settings. In these forms, JavaScript is used to check that the values entered satisfy the expected constraints and the help buttons for each field provide detailed information on such parameters. A generic form can be used when the software package utilized is not among those listed, allowing the user to enter parameter names and values. However, our goal is to add software specific forms whenever a given software turns out to be frequently used. Module III and the corresponding tables in RAD are of particular interest because they allow very detailed descriptions of the biological materials employed in a study. BioSources can be entered together with their characteristics: these represent the original samples (e.g. individual mice, cell cultures, etc.) that undergo a series of manipulations to yield BioSamples, which are then labeled to generate the LabeledExtracts that are hybridized to the arrays. Biosources, biosamples and labeled extracts are all special cases of BioMaterials. The characteristics of a given biomaterial (typically a biosource) can be entered using several ontologies: DevelopmentalStage, BioSourceType, CellLine, StrainOrLine, etc. Manipulations (called ‘treatments’ in the forms) performed on a given biomaterial can also be described through ontologies for Atomic/Complex Action and ProtocolType (and protocols can be entered). The treatments applied to a given biomaterial can be broken up into their most elementary steps (atomic actions) if desired. Splitting and pooling of biomaterials can also be described using separate forms, allowing specification about the stage of the process at which they were applied; e.g. whether pooling occurred before or after a given treatment (like nucleic acid extraction or labeling). Each labeled extract is eventually linked, through a form, to its appropriate assay. Figure 3 provides an example of how the biomaterials used in the study by Polacek et al. (2003) have been captured in the RAD schema via the Study-Annotator. When biomaterials are used in more than one study, the user is able to import biomaterials entered for a different study.
E.Manduchi et al.
Ontologies in RAD
In addition to a detailed tutorial containing sample annotations, available at https://www.cbil.upenn.edu/RAD/tutorial, specific help for each field in each form can also be displayed in a pop-up window upon clicking the corresponding ‘?’ button. The content of this help is itself stored in an appropriate table in GUS. As additional aids, pop-up windows can be opened by the user to show descriptions of protocols already stored in the database as well as definitions of certain ontology terms (such as study design types or study factor types).
MAGE exports In order to facilitate exports of data from RAD to other databases accepting data in MAGE-ML format (e.g. the public repository ArrayExpress, http://www.ebi.ac.uk/arrayexpress), we transform RAD objects into MAGE-ML via the MAGE software toolkit (MAGEstk). The object transformations are
456
accomplished by defining a set of declarative rules, which are programming language independent, to apply on a set of inputs and produce a set of outputs. The current implementation, the RuleSet package, for reading and writing rule sets is coded in Perl, as is the engine that applies rules to a set of inputs (the RuleSetEngine). To provide a default set of mappings between MAGE and RAD, we have developed a set of modules that subclass the RuleSetEngine, collectively named the MAGE–RAD Translator (MR_T). Currently, MR_T is only for exports of MAGE-ML, but the same general mechanism will be used to import MAGE-ML into RAD, and will be an extension of the MR_T framework.
RESULTS The RAD schema has been designed keeping in mind that expression data need to be integrated with other information
Downloaded from http://bioinformatics.oxfordjournals.org/ by guest on February 25, 2013
Fig. 2. Snapshot of the Study Design annotation web-form. The select menu containing the ontology terms for study design type currently in RAD and the button to add new terms are indicated by the arrows.
RAD and the RAD Study-Annotator
BioSource
HAEC 5038 split Culture dish 1
Culture dish 2
Culture dish 3
Culture dish 4
TNFα treatment Culture dish 1, TNF+
pool
Culture dish 2, TNF+
BioSamples
pool TNF+ pooled culture
TNF- pooled culture nucleic_acid_extraction
TNF+ pooled culture RNA
TNF- pooled cultured RNA split
Amplify and 33P label …
TNF+ alqt 9
TNF- alqt 1 2, …, 5, 6, ...
TNF- alqt 9
33
Amplify and 33P label
33
P label …
…
P label …
18 distinct resulting Labeled Extracts
LabeledExtracts
Fig. 3. An example of how biomaterials information have been captured in RAD and entered via the Study-Annotator. These biomaterials refer to the study by Polacek et al. (2003). The whole procedure of sample preparation is captured here. Human aortic endothelial cells are split into four cultures, two of which are stimulated via TNFα. Each pair of cultures (treated and untreated) is pooled and nucleic acid is extracted. Each of the two RNA pools is divided into nine aliquots, five of which are linearly amplified and radioactively labeled and four of which are simply labeled.
stored in GUS, especially sequence and sequence annotation data in the DoTS component. The RAD StudyAnnotator facilitates structured storage of rich and detailed information on protocols and biomaterials, which, together with stored information about pre-processing and analysis results, provides the context for interpreting the expression data. A general web query interface to RAD (RAD Querier), with access to all of the public data sets hereby deposited, is available at http://www.cbil.upenn.edu/RAD. The interface is written in HTML, PHP, and uses Perl CGI scripts and graphics generated by GraphViz (Gansner and North, 2000). Its query mechanism is ontology driven. For example, studies can be selected by species and/or by organism part involved, by study design and/or study factor types encompassed, by array platform type, or simply by bibliographic reference. Detailed information about the array platform used, acquisition and quantification protocols and parameters, study design types and study factors examined can be retrieved upon selection of a given study, as well as detailed biomaterial descriptions. (Moreover, graphic displays of the samples in a given assay, with clickable nodes linking to detailed descriptions of biomaterials and their treatments can be made available.) Raw and normalized data can be downloaded. Some analysis capabilities are
also incorporated, like diagnostic plots, XCluster (http:// genetics.stanford.edu/∼sherlock/cluster.html) and PaGE (http://www.cbil.upenn.edu/PaGE). Besides the RAD Querier, there are other resources, focused on specific organisms or biological systems, which rely on GUS and, as a special case, on RAD. In these resources the integration between the gene expression data stored in RAD and sequence annotation information stored in DoTS is fundamental and is exploited. For example, the PlasmoDB resource (http://plasmodb.org), which is the official database of the malaria parasite genome project, uses RAD for its gene expression data component. The Endocrine Pancreas consortium website (http://www.cbil. upenn.edu/EPConDB/index.shtml) also uses RAD and its integration within GUS, in particular its integration with Allgenes (http://www.allgenes.org), a human and mouse gene index which is managed by DoTS. This comprises assemblies of mouse and human expressed sequence tags (ESTs) and RNAs, automatically annotated with BLAST similarities, GO functions, RH mapping, protein domains, EST library and anatomy percentages, locus links, gene traps, transmembrane domains, signal peptides, etc. These transcripts are aligned to the genome together with exon structure and promoter regions predictions and are grouped into genes. Furthermore, manual
457
Downloaded from http://bioinformatics.oxfordjournals.org/ by guest on February 25, 2013
TNF+ alqt 1 2, …, 5, 6, ...
E.Manduchi et al.
curation is provided by a group of expert annotators. As a result, the EPConDB web resource enables complex queries which combine gene expression experiments with sequence annotation, like retrieving microarray values for genes with assigned GO functional classification and located on a given chromosome, etc. RAD has been ported by other groups seeking a mature schema to store gene expression information. Most recently, the Generic Model Organism Database (GMOD, http://www.gmod.org) modified RAD for the gene expression component of chado, the relational schema being developed by the GMOD group.
DISCUSSION AND CONCLUSIONS
458
Downloaded from http://bioinformatics.oxfordjournals.org/ by guest on February 25, 2013
RAD and its associated Study-Annotator provide a solid infrastructure for collecting and storing all relevant information regarding gene expression studies. Besides capturing all MIAME-recommended information, finer details can be captured as well. This enables efficient storage of a large amount of information, which can be utilized to build resources with rich query capabilities that can facilitate further research on specific organisms and biological systems. The international community has recognized the importance of this type of database and annotation tool. Other groups have developed systems addressing similar issues (see http://www.mged.org/Workgroups/MIAME/miame_software. html for a list of efforts in this regard, which includes RAD). Available systems emphasize somewhat different approaches reflecting their primary roles as a community archive, institutional microarray database, or laboratory database and analysis tool. For example, the Standard Microarray Database (SMD Gollub et al., 2003, http://genomewww.stanford.edu/microarray), even though one of the largest academic microarray databases, largely supports the very active microarray community at Stanford focusing on two-channel assays quantified with GenePix or ScanAlyze, with a nice interface for data retrieval and analysis and visualization tools. SMD has successfully exported MAGE to ArrayExpress. RAD accommodates a wider range of platforms (all array platforms and SAGE) and can accommodate data quantified with any kind of software. RAD also allows entering of pre-processing results of any kind (SMD normalization is currently limited to normalization by a constant factor). In terms of sample and experimental design annotation, the RAD Study-Annotator makes a more extensive use of the relevant ontologies and provides the means to enter finer information on samples and their manipulations and on protocols in a structured fashion. The Gene Expression Omnibus (GEO Edgar et al., 2002, http://www.ncbi.nlm.nih.gov/geo), and ArrayExpress (Brazma et al., 2003; http://www.ebi.ac.uk/arrayexpress) are two public repositories (which enable for bulk deposits of data), both accommodating data from any kind of platform.
ArrayExpress has both MAGE-ML import and export capabilities, whereas GEO currently does not have either (it allows for import/exports in an ASCII format called SOFT) and does not have an annotation tool like the RAD Study-Annotator. ArrayExpress has an annotation tool (MIAMExpress) similar to (and has inspired some of the aspects of) the RAD StudyAnnotator. Both rely heavily on the MGED Ontology for annotation terms. Our instance of RAD is not a public repository (albeit the freely available empty infrastructure could be used to build a public repository). The main difference between RAD and ArrayExpress is in the fact that the relational schema of ArrayExpress is generated directly from the MAGE Object Model (MAGE-OM), with a separate table for each class as well as for many–many relations. This makes it easy to load data into such a schema from MAGE-ML, but it is not ideal for efficient queries. Since RAD supports a variety of web resources and queries, we needed a more normalized relational schema. At the same time though, through MR_T, we can export from RAD into MAGE-ML and in particular we can export data to repositories like ArrayExpress. The main strength of RAD and its Study-Annotator is that they combine: (a) the use of ontologies whenever available, keeping up with the MGED OWG efforts, while allowing the incorporation of ontologies from external resources and proposed new terms; (b) the use of a relational schema which in some parts diverges from the MAGE object model in order to optimize query capabilities while remaining compatible with MAGE through the use of MAGE export tools so that data can be easily exported to any database accepting MAGEML formats (development of tools to allow for MAGE-ML imports is in progress) and (c) integration within a larger resource like GUS allowing for rich information on sequence annotation and gene indices. The RAD schema, object layer, plug-ins, MR_T and StudyAnnotator are freely available to the scientific community so that groups can implement their own instances of RAD (and in fact, of GUS). Once an instance of this system is locally installed, additions to the current infrastructure for specific implementations can be easily implemented. For example, we do not have tables in RAD to store information regarding plate consolidation (e.g. from 96 to 384 well plate) and racking, as we store data coming from a variety of laboratories who have their own LIMS for this kind of information. However, tables to track these can be added to the schema if needed and the corresponding (Perl/Java) objects can be automatically generated by the object-generator scripts. Also, we currently load the results of image quantification or preprocessing via plug-ins rather than through a web-interface. Having the object layer in place however allows the possibility of uploading these data via a web-interface, for example by adding links to the Study-Annotator which on the back-end would exploit suitable plug-ins based on the object layer. The rewards of using the RAD system are of three types: (i) better tracking of experimental and analytical details that
RAD and the RAD Study-Annotator
can greatly influence interpretation of the data; (ii) the ability to retrieve and compare results from studies (treatments, protocols, factors) of the same type and (iii) the ability to share and interpret data with other groups using the MGED standards. Apparent differences in gene expression have been found to be due to errors introduced during data generation and manipulation (Coombes et al., 2003). The ability to track and check data stored within RAD allows investigators to check whether their conclusions can be attributed to non-biological causes. As other groups adopt the MGED standards in their database efforts, the ability to share data between these groups (e.g. SMD, TIGR, NCICB, etc.) is gained. Of particular importance is the ability to submit data to ArrayExpress.
The authors wish to thank our colleagues in MGED whose work on standards has greatly enhanced our efforts. We also wish to thank members of CBIL for their advice and discussions relating to GUS. This work was supported by NIH grants RO1-HG-01539, U01-DK56947, K25-HG-02296 (E.M.) and K25-HG-00052 (G.R.G.).
REFERENCES Ball,C.A., Sherlock,G., Parkinson,H., Rocca-Sera,P., Brooksbank,C., Causton,H.C., Cavalieri,D., Gaasterland,T., Hingamp,P., Holstege,F. et al. (2002) An open letter to the scientific journals. Science, 298, 539; Bioinformatics, 18, 1409; The Lancet, 360, 1019. Brazma,A., Hingamp,P., Quackenbush,J., Sherlock,G., Spellman,P., Stoeckert,C.J. Jr., Aach,J., Ansorge,W., Ball,C.A., Causton,H.C. et al. (2001) Minimum information about a microarray experiment (MIAME)—toward standards for microarray data. Nat. Genet., 29, 365–371. Brazma,A., Parkinson,H., Sarkans,U., Shojatalab,M., Vilo,J., Abeygunawardena,N., Holloway,E., Kapushesky,M., Kemmeren,P., Lara,G.G. et al. (2003) ArrayExpress—a public repository for microarray gene expression data at the EBI. Nucleic Acids Res., 31, 68–71.
459
Downloaded from http://bioinformatics.oxfordjournals.org/ by guest on February 25, 2013
ACKNOWLEDGEMENTS
Coombes,K.R., Wang,J. and Abruzzo,L.V. (2003) Monitoring the quality of microarray experiments. In Johnson,K.F. and Lin,S.M. (eds), Methods of Microarray Data Analyses III, Kluwer Academic Publishers, pp. 25–40. CAMDA 2002 Conference Proceedings, in press. Edgar,R., Domrachev,M. and Lash,A. (2002) Gene expression omnibus: NCBI gene expression and hybridization array data repository. Nucleic Acids Res., 30, 20–210. Gansner,E.R. and North,S.C. (2000) An open graph visualization system and its applications to software engineering. Softw. Pract. Exp., 30, 1203–1233. Gollub,J., Ball,C.A., Binkley,G., Demeter,J., Finkelstein,D.B., Hebert,J.M., Hernandez-Boussard,T., Jin,H., Kaloper,M., Matese,J.C. et al. (2003) The Stanford microarray database: data access and quality assessment tools. Nucleic Acids Res., 31, 94–96. Grant,G.R., Manduchi,E., Pizarro,A. and Stoeckert,C.J., Jr (2003) Maintaining data integrity in microarray data management. Biotech. Bioeng., in press. Gruber,T.R. (1993) A translation approach to portable ontologies. Knowledge Acquisition, 5, 199–200. Manduchi,E., Pizarro,A. and Stoeckert,C.J., Jr (2001) RAD (RNA Abundance Database): an infrastructure for array data analysis. Proc. SPIE, 4266, 68–78. Polacek,D.C., Passerini,A.G., Shi,C., Francesco,N.M., Manduchi,E., Grant,G.R., Powell,S., Bishoff,H., Winkler,H., Stoeckert,C.J., Jr. and Davies,P.F. (2003) Fidelity and enhanced sensitivity of differential transcription profiles following linear amplification of nanogram amounts of endothelial RNA. Physiol. Genomics, 13, 147–156. Spellman,P.T., Miller,M., Stewart,J., Troup,C., Sarkans,U., Chervitz,S., Bernhart,D., Sherlock,G., Ball,C., Lepage,M. et al. (2002) Design and implementation of microarray gene expression markup language (MAGE-ML). Genome Biol., 3, RESEARCH0046. Stoeckert,C.J., Jr, Pizarro,A., Manduchi,E., Gibson,M., Brunk,B., Crabtree,J., Schug,S., Shen-Orr,S. and Overton,G.C. (2001) A relational schema for both array-based and SAGE gene expression experiments. Bioinformatics, 17, 300–308. Stoeckert,C.J., Jr and Parkinson,H. (2003) The MGED ontology: a framework for describing functional genomics experiments. Comp. Funct. Genomics, 4, 127–132.