... Columbia, Department of Electrical and Computer Engineering, Vancouver, BC, Canada, V6T 1Z4 ... The multiple signal classification (MUSIC) algorithm has.
Blind Multi-Sources Detection and Localization for Cognitive Radio ∗ Ecole ´
† University
O. Duval∗ , A. Punchihewa† , F. Gagnon∗ , C. Despins‡ and V. K. Bhargava†
´ de Technologie Sup´erieure, D´epartement de G´enie Electrique, Montr´eal, Qu´ebec, Canada, H3C 6M8 of British Columbia, Department of Electrical and Computer Engineering, Vancouver, BC, Canada, V6T 1Z4 ‡ INRS-EMT, ´ Montr´eal, QC, Canada, H3B 3A7
Abstract—In this paper, we introduce a spectrum holes detection approach, which combines blind modulation classification, angle of arrival estimation and number of sources detection. We perform eigenspace analysis to determine the number of sources, and estimate their angles of arrival. In addition, we classify detected sources as primary or secondary users with their distinct second-order/ one-conjugate cyclostationarity features. Extensive simulations carried out indicate that the proposed system identifies and locates individual sources correctly, even at -4 dB SNR.
I. I NTRODUCTION In recent years, cognitive wireless communication networks have emerged as a way to improve frequency spectrum use by offering unlicensed secondary users the opportunity to momentarily occupy spectrum holes in licensed bands [1]. When occupying licensed spectrum bands, the cognitive radio must not cause any perceptible harmful effect for every primary receiver. Radio scene analysis is an important advance associated with cognitive radios [1], [2] because the knowledge it offers allows the radio to adapt to the changing radio frequency environment. With extensive knowledge on both the location and class of all local users, the cognitive radio can efficiently reuse spectrum holes and avoid causing any harmful interference on primary users [1]. Cognitive radios must also adapt to presumably non-cooperative legacy primary user networks and secondary user competitors seeking to occupy the spectrum as well. Secondary users attempting to efficiently reuse spectrum holes left free by single-carrier linear digital (SCLD) primary users may use orthogonal frequency division multiplexing (OFDM) modulation schemes to occupy spectrum bands efficiently [1], [3]. In order to determine whether sources are primary or secondary users, the cognitive radio must then classify incoming signals through modulation classification (MC). Recently proposed OFDM-SCLD blind MC algorithms require carrier of timing recovery [4], or estimation of signalto-noise ratio (SNR) [5], before the recognition algorithm applied. The classification algorithm proposed in [6] does not require the preprocessing tasks, such as symbol timing estimation, carrier and waveform recovery, and signal and noise power estimation. However, it requires the knowledge of presence or absence of signals to avoid identifying noise input as single carrier. Also, authors did not investigate the classifier’s performance with multiple received signals.
In order to extend the spatial reuse, the location of other users has to be known so the cognitive radio can avoid disturbing them. Several localization techniques have been proposed, but may require cooperation from mobile users through the use of a beacon signal [7] or pseudo-noise sequence [8]. Angle of arrival estimation (AoA) is an efficient way to measure users location and may not require cooperation from sources [9]. The multiple signal classification (MUSIC) algorithm has been proven efficient for AoA [7] and estimating the number of present sources [10]. The MC algorithm proposed in [6] requires the presence of a single signal source to perform classification correctly. If these requirements are not satisfied, the MC algorithm can misclassify the signal sources. In order to overcome this issue, our original contribution is to combine the number of sources estimation provided by the MUSIC [9] algorithm to the MC algorithm described in [6] to ensure the cognitive radio’s knowledge on the location of primary and secondary users. The rest of the paper is organised as follows: Signal models and the proposed localization and classification algorithms are introduced in Sections II and III, respectively. Simulation results for the proposed algorithm are discussed in Section IV. Finally, conclusions are drawn in Section V. II. S IGNAL M ODEL The signal model considered in our paper includes wireless transmissions from primary and secondary users through an additive white gaussian noise (AWGN) channel and the receiver consists of an uniform linear array. A. Primary and secondary users signals The noiseless received SCLD and OFDM modulated signals sSCLD (t) and sOF DM (t) are defined as follows [6]: sSCLD (t) = α ejφ ej2πΔfc t
∞ �
sp g(t − pT − �T )
(1)
p=−∞
sOF DM (t) = α ejφ ej2πΔfc t · K−1 �
∞ �
sk,p ej2πΔfK (t−pT −�T ) g(t − pT − �T )
(2)
k=0 p=−∞
where α is the attenuation factor, φ is the initial phase, Δfc is the carrier frequency offset, sp and sk,p represent
978-1-4244-2324-8/08/$25.00 © 2008 IEEE. This full text paper was peer reviewed at the direction of IEEE Communications Society subject matter experts for publication in the IEEE "GLOBECOM" 2008 proceedings.
ant.0
OFDM SCLD
r 0 (t,θ)
ant.1
r1 (t,θ)
θ1
ant.L-1
CR
Sampling
X[n]
...
θ2
Modulation Classifier
Ω
Number of Sources
m
r L-1(t,θ)
Angle of Arrival
2d ds sin in θ θ
Incident Plane Wave
Fig. 2.
θ
θ
System
III. D ETECTION AND L OCALIZATION A LGORITHM L-1 L-2 Uniform Linear Array
Fig. 1.
2
1 d
0
Angles of Arrival
the symbols transmitted within the pth period, and the pth period and kth subcarrier, respectively. Function g(t) is the pulse shape, T is the symbol period, and 0 ≤ � ≤ 1 is the timing offset. For OFDM modulation scheme, ΔfK is the frequency separation between adjacent subcarriers, K is the total number of subcarriers and the symbol period is given by T = Tuse + Tcp where the useful symbol duration is −1 and the cyclic prefix is usually Tcp = Tuse /4. Tuse = ΔfK B. Received signal As shown in Fig. 1, the receiver is equipped with an array of L antennas with uniform distance d, which offers different channel lengths for each element of the antenna array. These differences in distances are shown in Fig. 1, as ldsin(θ), where l refers to the antenna’s number and θ is the wave’s angle of arrival from SCLD and OFMD sources located at an unknown distance from a cognitve receiver (CR). These effects can be accounted for using vector a(θ): a(θ) = [a0 (θ), a1 (θ), · · · , aL−1 (θ)]
(3)
An important objective for cognitive systems is to detect spectrum holes [1], and maximize the exploitation of these novel wireless communications opportunities. OFDM is a very efficient way for cognitive secondary user networks to fill those dynamic spectrum holes [3]. Therefore, when a secondary user detects OFDM transmissions in a band, a competitor secondary user network is most likely filling a significant portion of the available spectrum holes. On the other hand, if no OFDM transmission is detected, a larger number of spectrum holes can be expected. The primary objective of our algorithm is to provide AoA of primary sources in order to exploit spectrum holes when no OFDM sources are detected. For each considered snapshot n of X[n], the proposed system, shown in Fig. 2, operates as follows: 1) Determine the number of sources m; ˆ 2) if m ˆ ≥ 1, evaluate the OFDM presence detector Ω; ˆ for all 3) if Ω = f alse, calculate the AoA estimate Θ, primary users; 4) modify the cognitive radio’s antenna array radiation patˆ 1. tern to minimize transmitted power for every Θ ≈ Θ We employ the MUSIC algorithm [9] to detect the number of sources and the AoA of incoming signals. The Modulation classifier is based on results in [6]. In the following, we describe the functionalities of each of these blocks, also shown in Fig. 2.
with its elements defined as: al (θ) = e
j2πldsin(θ) λ0
,
0≤l ≤L−1
(4)
where λ0 is the received signal’s wavelength. The signal received at the antenna array level is defined by the L-sized vector r(t,θ): r(t, θ) = a(θ)s(t) + n(t)
(5)
with n(t) a L-sized vector with independent AWGN elements. As shown in Fig. 2, for each snapshot n, N samples of r(t,θ) are then saved in the received L x N matrix X[n]: X[n] = [r(t0 , θ), r(t0 + ts , θ), · · · , r(t0 + (N − 1)ts , θ)] (6)
A. Number of Sources The first objective of the algorithm is to determine the number of distinctive sources in order to provide presence of signal information to the MC block. ˆ the estimate of the L x L covariance First, we calculate C, matrix for a given snapshot X[n]. The elements cˆi,j of Cˆ are defined as follows: N
cˆi,j =
1 � ¯ i [n])(Xj,k [n] − X ¯ j [n]) (Xi,k [n] − X N −1
(7)
k=1
1 The
4th element of the algorithm will be considered as future work.
978-1-4244-2324-8/08/$25.00 © 2008 IEEE. This full text paper was peer reviewed at the direction of IEEE Communications Society subject matter experts for publication in the IEEE "GLOBECOM" 2008 proceedings.
where
N � ¯ i [n] = 1 X Xi,k [n] N
(8)
k=1
Then, the covariance matrix Cˆ is decomposed in eigenvalues matrix Λ and eigenvectors matrix Q: Cˆ = QΛQ−1
(9)
for which we consider diagonal elements of Λ are arranged in descending order, and the corresponding eigenvectors in Q are ordered accordingly. The diagonal elements of Λ are then stored in L-elements vector λ. These eigenvalues are separated in two groups [11], the signal subspace: λs λss = [λ(0) λ(1) · · · λ(m ˆ − 1)]
(10)
and the noise subspace λns
−1
crSCLD (β; τ )2,1 = α2 cs,2,1 ρ−1 e−j2πβ�ρ e−j2πρ Δfc T τ � · g(u + τ )g H (u)e−j2πβu + cw (β; τ )2,1 (18) u −1
crOF DM (β; τ )2,1 = α2 cs,2,1 D−1 e−j2πβ�D e−j2π(ρK) Δfc Tu τ � ·ΞK (τ ) g(u + τ )g H (u)e−j2πβu +cw (β; τ )2,1 (19)
(11)
The objective of the algorithm is to estimate the threshold shift Γ that separates these two groups.
where ΞK (τ )
=
K−1 �
e−j2π(ρK)
−1
kτ
k=0
ψP s � �2 1 + PLs
Γ= �
(12)
λ(0) − λ(L − 1) Ps = L
(13)
and ψ is a constant depending on the quality of the data [10]. The number of sources m ˆ is then estimated with: � ˆ =∅ 0 if m m ˆ = (14) ˆ max(m) otherwise where ∅ represents the empty set and ˆ = {∀ i ∈ {0, 1, 2, . . . , L − 1} : λ(i − 1) − λ(i) > Γ} (15) m As discussed in section I, in order to avoid misclassification of noise-only inputs, the MC algorithm requires at least one input signal to be present. Therefore, we only invoke the MC algorithm when m ˆ �= 0. B. Blind Detection and Classification We classify OFDM against SCLD with the lowest order non-zero cyclic cumulants (CC), second-order/ one conjugate, as in [6]. The input signal for the classification algorithm is a snapshot n of X[n] for which the number of sources block has detected the presence of at least one source. We consider r = r0 , the first row of the received signal X[n], representing the input signal from antenna 0. We calculate the estimate cˆrΩ (β; τ )2,1 of the second order, one conjugate CC of r at cycle frequency (CF) β and delay τ as: cˆrΩ (β; τ )2,1
Under the assumption that there is no aliasing, the secondorder/ one-conjugate CC at CF β and delay τ for SCLD and OFDM signals are given as [6]:
u
λn = [λ(m) ˆ λ(m ˆ + 1) · · · λ(L − 1)]
where
where U is the total number of time samples in the received signal vector r and Ω represents the unknown class of signal r: � 1 if at least one OFDM source is present Ω= (17) 0 if only SCLD sources are present
U −1 1 � H = rΩ (u + τ ) · rΩ (u)e−2jπβu U u=0
(16)
=
ejπ(ρK)
−1
(K−1)τ
·
sin(πτ ρ−1 ) sin(πτ (ρK)−1 )
(20)
here, ρ represents the oversampling factor, Cw (β; τ )2,1 represents the noise CC, and D represents the total number of samples in one OFDM symbol period. The classification of OFDM against SCLD is based on the existence of a significant peak located at a non-zero delay value of the estimated secondorder/ one-conjugate CC magnitude. Classification of OFDM against SCLD is performed in two steps. First, we locate a non-zero peak in the estimated second-order/ one-conjugate CC magnitude at delay τpeak , with 0 < τpeak < U , and at CF β = 0. Then, using the cyclostationarity test developed by Dandawate [12], we check whether or not β = 0 is indeed a CF for delay τ = τpeak . If β = 0 is found to be a CF for delay τ = τpeak , the signal is classified as OFDM, otherwise the signal is classified as SCLD. C. Angle of arrival Using the number of sources, and the eigenvectors Q calculated in the number of sources block, we employ the MUSIC algorithm to estimate the angle of arrival for all of these sources. First, we obtain Qns ⊆ Q, the noise subspace eigenvectors matrix by keeping the eigenvectors that are associated with the noise eigenvalues λns : Q = [v0 v1 · · · vL−1 ] · · · vL−1 ] Qns = [vm ˆ vm+1 ˆ ˆ Then we estimate the angle of arrival θ: � � 1 argmax θˆ = ϑ ∈ (−π/2, π/2] aH (ϑ) Qns QH ns a(ϑ)
(21) (22)
(23)
where a(ϑ) is defined in (3) and (4).
978-1-4244-2324-8/08/$25.00 © 2008 IEEE. This full text paper was peer reviewed at the direction of IEEE Communications Society subject matter experts for publication in the IEEE "GLOBECOM" 2008 proceedings.
IV. S IMULATION R ESULTS AND A NALYSIS
A. Simulation setup For all simulations conducted in this paper, we select the parameters defined in section II-A as follows: α = 1, � = 0.75 and φ ∼ U (−π, π). We generate baseband SCLD signals using g(t) as a raised cosine filter with roll-off factor 0.35, 40 kHz bandwidth and Δfc = 16 kHz. We select baseband OFDM signals parameters as g(t) is a raised cosine window with roll-off factor 0.025, 800 kHz bandwidth, Δfc = 320 kHz, K = 128. We select the data symbols {sp } and {sk,p } by choosing independent and identically distributed samples from M-ary phase shift keying (MPSK) constellations. Regarding the propagation and reception parameters defined in Section II-B, we select L = 15, d/λ0 = 0.5 and N=12800.
Average error on number of sources
7
In this section, we illustrate the performance of each part of the algorithm through extensive simulations.
7 Sources with PSK One PSK & One OFDM 4 Sources with PSK 2 Sources with PSK Only Noise
6
5
4
3
2
1
0 −24
−22
−20
−18
−16
−14
−12
−10
−8
−6
−4
SNR (dB)
Fig. 3.
Average Error on Number of Sources
1
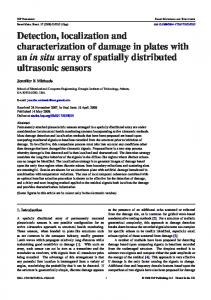
B. Simulation of the Number of Sources Detector 0.9 PCC
This simulation illustrates the performance of the number of sources detector, described in Section III-A. We investigate several combinations of primary and secondary user scenarios. For each scenario, we estimate the number of signals m ˆ and evaluate the average estimation error e¯ as: V |m ˆ v − mv | (24) e¯ = v=1 V for which we conduct V = 100 trials. Our results, illustrated in Fig. 3, show that the number of sources estimation algorithm obtains low estimation errors for all scenarios even with SNR as low as -10 dB. In addition, except for the 7 PSK sources scenario, similar performance is obtained for SNR as low as -15 dB. However, the 7 PSK sources scenario, with sources located at angles 6 ◦ , 14 ◦ , 29 ◦ , 40 ◦ , 46 ◦ , 63 ◦ and 74 ◦ , shows a significant estimation error for SNR below -10 dB. This deviation is due to the eigenvalues vector λ which does not show a clear threshold between the noise and signal subspaces λns and λss as the number of sources increases significantly. These results dominate the overall performance of the system and will hinder any AoA estimation for this particular scenario and SNR levels. Our algorithm offers near zero error average error for a 4 single carrier signals input, when SNR is as low as -17 dB, which significantly outperforms [10].
0.8
0.7
0.6 −10 −9
−8
Fig. 4.
−7
−6
−5
−4
−3 −2 −1 SNR (dB)
0
Noise only OFDM only OFDM and two SCLD Seven SCLD 1 2 3 4 5 6
Performance evaluation of the MC block
SCLD signals present, even at SN R = −3dB. Whereas [6] has considered only one SCLD or OFDM signal source. We observe a performance degradation when compared with a single OFDM source scenario because β = 0 is not a CF at τ0 for the SCLD signal. The test statistic value we evaluate for the cyclostationarity test decreases with the increase of the number of SCLD signals. Furthermore, the scenario with seven SCLD sources shows perfect classification results for the whole SNR range. The cognitive radio can use these classification results to find out all the available spectrum holes. D. Performance of the Angle of Arrival Estimator In Fig. 5, we illustrate a typical set of estimated angles with SNR = -8 dB. There, one can easily identify seven distinguished peaks corresponding to the seven distinct sources.
C. Simulation of the Modulation Classifier We have investigated the performance of the MC algorithm described in III-B with several combinations of primary and secondary user scenarios. In Fig. 4, we show the probability of correct classification PCC for those scenarios. We obtain PCC = 1 for the whole examined SNR range for a scenario for which only noise is present. If the MC block operated alone, this result would be incorrect because Ω = 0 is supposed to represent SCLD, not noise only sources. Since our system combines the number of sources and MC blocks, we eliminate this misclassification. In addition, we have shown that our system is able to detect OFDM signals when there are also
We then calculate the root mean square error (RMSE) of the AoA estimation for several combinations of primary and secondary user scenarios, with RMSE defined as:
V ˆ 2 v=1 (θv − θv ) (25) RMSE = V where we measure the square error for each one of the V estimated angles θv . According to the results shown in Fig. 6, the AoA block estimates offers a maximum RMSE of 1 ◦ for SNR as low as -12 dB for all considered scenarios. From Fig. 6, one can notice that the RMSE of the AoA increases
978-1-4244-2324-8/08/$25.00 © 2008 IEEE. This full text paper was peer reviewed at the direction of IEEE Communications Society subject matter experts for publication in the IEEE "GLOBECOM" 2008 proceedings.
fering with primary users, through advanced beamforming techniques. V. C ONCLUSION In this paper, we present an algorithm for blind detection and localization of primary and secondary users for cognitive radio through modulation classification and angle of arrival estimation. The overall simulation results indicate that this system identifies and locates sources correctly for all considered scenarios, even at -4 dB SNR. In addition, we have shown the classification performance for several SCLD sources and for OFDM signal in presence of multiple SCLD sources. Cognitive radios employing the proposed system will identify available spectrum holes efficiently by avoiding frequency bands that are already filled by secondary user competitors, and exploit available spectrum holes by avoiding interference to primary users, employing information on their localization. Fig. 5.
Estimation of the AoA for seven BPSK sources
ACKNOWLEDGMENT This work is funded in parts by the National Sciences and Engineering Research Council of Canada. R EFERENCES
Fig. 6.
Root mean square error on the AoA estimation algorithm
with the increase of the number of sources. This is caused by an error in the number of sources estimation, as discussed in IV-B. By combining the number of sources, blind modulation classification and angle of arrival blocks results, the secondary user has cognition of the angle of arrival and class of all surrounding sources. This knowledge can then be exploited to occupy available dynamic spectrum holes without inter-
[1] S. Haykin, “Cognitive radio: brain-empowered wireless communications,” Select Areas Commun., IEEE J., vol. 23, no. 2, pp. 201–220, 2005. [2] Vijay K. Bhargava and Ekram Hossain, Cognitive Wireless Communication Networks, New York: Springer-Verlag,, 2007. [3] D. Cabric and R.W. Brodersen, “Physical layer design issues unique to cognitive radio systems,” in Proc, IEEE PIMRC, vol. 2, pp. 759–763 vol. 2, 11-14 Sept. 2005. [4] W. Akmouche, “Detection of multicarrier modulations using 4th-order cumulants,” in Proc. IEEE MILCOM, vol. 1, pp. 432–436 vol.1, 1999. [5] Bin Wang and Lindong Ge, “A novel algorithm for identification of ofdm signal,” in Proc. WiMob, vol. 1, pp. 261–264, 23-26 Sept. 2005. [6] A. Punchihewa, O. A. Dobre, S. Rajan, and R. Inkol, “Cyclostationaritybased algorithm for blind recognition of ofdm and single carrier linear digital modulations,” in Proc. PIMRC, pp. 1–5, 3-7 Sept. 2007. [7] N. Bulusu, J. Heidemann, and D. Estrin, “Gps-less low-cost outdoor localization for very small devices,” IEEE Trans. on Wireless Commun., vol. 7, no. 5, pp. 28–34, Oct. 2000. [8] Jr. Caffery, J. and G.L. Stuber, “Subscriber location in cdma cellular networks,” IEEE Trans. Veh. Technol., vol. 47, no. 2, pp. 406–416, May 1998. [9] Lal Chand Godara, Smart Antennas, CRC, 2004. [10] O. Hu, Fuchun Zheng, and M. Faulkner, “Detecting the number of signals using antenna array: a single threshold solution,” in Proc. ISSPA, vol. 2, pp. 905–908 vol.2, 1999. [11] Q.-T. Zhang, K.M. Wong, P.C. Yip, and J.P. Reilly, “Statistical analysis of the performance of information theoretic criteria in the detection of the number of signals in array processing,” IEEE Trans. Signal Processing], IEEE Transactions on, vol. 37, no. 10, pp. 1557–1567, Oct 1989. [12] A.V. Dandawate and G.B. Giannakis, “Statistical tests for presence of cyclostationarity,” IEEE Trans. Signal Processing, vol. 42, no. 9, pp. 2355–2369, Sep 1994.
978-1-4244-2324-8/08/$25.00 © 2008 IEEE. This full text paper was peer reviewed at the direction of IEEE Communications Society subject matter experts for publication in the IEEE "GLOBECOM" 2008 proceedings.