Bootstrap- and Permutation-Based Inference
arXiv:1605.04729v3 [math.ST] 23 Sep 2016
for the Mann-Whitney Effect for Right-Censored and Tied Data Dennis Dobler˚ and Markus Pauly Ulm University, Institute of Statistics Helmholtzstr. 20, 89081 Ulm, Germany email:
[email protected], email:
[email protected]
September 26, 2016 Summary The Mann-Whitney effect is an intuitive measure for discriminating two survival distributions. Here we analyze various inference techniques for this parameter in a two-sample survival setting with independent right-censoring, where the survival times are even allowed to be discretely distributed. This allows for ties in the data and requires the introduction of normalized versions of Kaplan-Meier estimators from which adequate point estimates are deduced. Asymptotically exact inference procedures based on standard normal, bootstrap- and permutation-quantiles are developed and compared in simulations. Here, the asymptotically robust and – under exchangeable data – even finitely exact permutation procedure turned out to be the best. Finally, all procedures are illustrated using a real data set. Keywords: Counting process; Efron’s bootstrap; Heteroscedasticity; Kaplan-Meier estimator; Permutation technique.
˚
Corresponding author
1
Introduction
When comparing the survival times from two independent groups (j “ 1, 2) the Mann-Whitney effect is an intuitive measure; see e.g. Koziol and Jia (2009). In a classical survival setting with continuous life time distributions and random censoring it is given by the probability P pT1 ą T2 q that a random subject from group j “ 1 (with survival time T1 ) survives longer than a randomly chosen person from group j “ 2 (with survival time T2 ). In case of uncensored data this effect reduces to the well-known Wilcoxon functional underlying the nonparametric Mann-Whitney test. Depending on the field of application it is also known as nonparametric treatment effect (e.g. Brunner and Munzel 2000), stress-strength characteristic (e.g. Kotz et al. 2003) or probabilistic index (e.g. Thas et al. 2012). Moreover, in case of diagnostic tests it has a direct interpretation as the area under the corresponding ROC curve, see e.g. Lange and Brunner (2012), Pauly et al. (2016) and Zapf et al. (2015) as well as Zhou et al. (2002) for more details on diagnostic accuracy measures. The Mann-Whitney effect is often estimated by the c-index for concordance (e.g. Koziol and Jia 2009). As pointed out by Acion et al. (2006), this is “a simple, clinically relevant, and robust index” and thus “an ideal effect measure”, see also Kieser et al. (2013). The same still holds true in case of survival outcomes that may be subject to independent random censoring, see e.g. the glorification of the c-index in Hess (2010) or Dunkler et al. (2010). An R-package for a Wilcoxon-Mann-Whitney test was propagated in De Neve et al. (2014). In the present paper we face the practically relevant situation where tied data are often inevitable. Thus, in order to take ties appropriately into account, we use a more general definition of the Mann-Whitney effect: 1 (1.1) p “ P pT1 ą T2 q ` P pT1 “ T2 q, 2 also known as ordinal effect size measure in case of completely observed data (Ryu and Agresti 2008; Konietschke et al. 2012). Recently, a related effect measure, the so called win ratio (for prioritized outcomes), has been investigated considerably by several authors (Pocock et al. 2012, Rauch et al. 2014, Luo et al. 2015, Abdalla et al. 2016; Bebu and Lachin 2016 as well as Wang and Pocock 2016). It is the odds of the Mann-Whitney effect p in (1.1), i.e. w“
p , 1´p
(1.2)
which is also referred to as the odds of concordance, see Martinussen and Pipper (2013) for a treatment in the context of a semiparametric regression model. In our situation p and w describe the probability that a patient of group 1 survives longer than a patient of group 2. That is, p ą 1{2, or equivalently w ą 1, imply a protective survival effect for group 1. Note that until now, ties have been excluded for estimating these quantities which particularly led to the recent assessment of Wang and Pocock (2016) that “we caution that the win ratio method should be used only when the amount of tied data is negligible”. In this paper, we propose and rigorously study different statistical inference procedures for 1
both parameters p and w in a classical survival model with independent random censoring, even allowing for ties in the data. While several authors (e.g. Nandi and Aich 1994, Cramer and Kamps 1997, Kotz et al. 2003, and references therein) have considered inference for p under specific distributional assumptions, we here focus on a completely nonparametric approach, not even assuming continuity of the data. Apart from confidence intervals for p and w this also includes one- and two-sided test procedures for the null hypothesis of no group effect (tendency) H0p
) ! 1) ! “ w“1 . : p“ 2
(1.3)
In the uncensored case this is also called the nonparametric Behrens-Fisher problem, see e.g. Brunner and Munzel (2000) and Neubert and Brunner (2007). To this end, the unknown parameters p and w are estimated by means of normalized versions of Kaplan-Meier estimates. These are indeed their corresponding nonparametric maximum likelihood estimates, see Efron (1967) as well as Koziol and Jia (2009) for the case of continuous observations. Based on their asymptotic properties we derive asymptotically valid tests and confidence intervals. These may be regarded as extensions of the Brunner-Munzel (2000) test to the censored data case. Since, for small sample sizes, the corresponding tests may lead to invalid α-level control (e.g. Medina et al. 2010 or Pauly et al. 2016 without censoring) we especially discuss and analyze two different resampling approaches (bootstrapping and permuting) to obtain better small sample performances. The resulting tests are innovative in several directions compared to other existing procedures for the two-sample survival set-up: 1. We focus on the null hypothesis H0p in (1.3) of actual interest. Before, only the more special null hypothesis H0S : tS1 “ S2 u of equal survival distributions between the two groups has been investigated, see e.g. Efron (1967), Akritas and Brunner (1997) and Akritas (2011). Corresponding one-sided testing problems (for null hypotheses formulated in terms of distribution functions) based on the related stochastic precedence have been treated in Arcones et al. (2002) and Davidov and Herman (2012). Instead, our procedures are not only able to assess the similarity of two survival distributions but they also quantify the degree of deviation by confidence intervals for meaningful parameters. 2. The more complex null H0p has so far only been studied in the uncensored case, see e.g. Janssen (1999), Brunner and Munzel (2000), De Neve et al. (2013), Chung and Romano (2016), Pauly et al. (2016) and the references cited therein. The present combination of allowing for survival analytic complications and focussing on the effect size p is achieved by utilizing empirical process theory applied to appropriate functionals. 3. We do not rely on the (elsewhere omnipresent) assumption of existing hazard rates. Instead, we here adjust for tied data by considering normalized versions of the survival function and the Kaplan-Meier estimator (leading to mid-ranks in the uncensored case). This more realistic assumption of ties in the observations accounts for a phenomenon which is oftentimes 2
an intrinsic problem by study design. Therefore, methodology for continuous data (even for only testing H0S ) should not be applied. Notable exceptions for the combination of survival methods and discontinuous data are provided in Akritas and Brunner (1997) and Brendel et al. (2014) where the hypothesis H0S is tested. 4. Finally, small sample properties of inference procedures relying on the asymptotic theory are greatly improved by applications of resampling techniques. These utilized resampling techniques are shown to yield consistent results even in the case of ties. Thereof, the permutation procedure succeeds in being even finitely exact in the case of exchangeable survival data in both sample groups; see e.g. Lehmann and Romano (2010), Good (2010), Pesarin and Salmaso (2010, 2012), and Bonnini et al. (2014) for the classical theory on permutation tests. In this perspective, the present paper not only states the first natural extension of point estimates for p to tied survival data, but especially introduces the first inference procedures for H0p (tests and confidence intervals) with rigorous consistency proofs. The latter have formerly not even been known in the continuous survival case. The article is organized as follows. Section 2 introduces all required notation and estimators, whose combination with the variance estimator in Section 3 yields (non-resampling) inference procedures. Theoretical results concerning the resampling techniques will be presented in Sections 4.1 (the pooled bootstrap) and 4.2 (random permutation). A simulation study in Section 5 reports the improvement of the level α control by the proposed permutation and bootstrap techniques. A final application of the developed methodology to a tongue cancer data set (Klein and Moeschberger 2003) is presented in Section 6. This article’s results are discussed in Section 7 and theoretically proven in Appendix A.
2
Notation, model, and estimators
For a more formal introduction of the concordance index p and the win ratio w we employ some standard notation from survival analysis. Thus, we consider two independent groups pj “ 1, 2q of independent survival times T˜j1 , . . . , T˜jnj : pΩ, A, P q Ñ p0, 8q, j “ 1, 2, with total sample size n “ n1 ` n2 , n1 , n2 P N. Their distributions may have discrete components which reflects the situation in most clinical studies (i.e. survival times rounded to days or weeks). Since most studies pre-specify a point of time K ą 0 after which no further observation is intended, we may also truncate the above survival times to Tji “ T˜ji ^ K “ minpT˜ji , Kq;
i “ 1, . . . , nj , j “ 1, 2.
Denote their survival functions as Sj ptq “ 1 ´ Fj ptq ” P pTj1 ą tq, j “ 1, 2. Thus, both sample groups may have different, even heteroscedastic distributions. Their cumulative hazard 3
şt dS functions are given by Λj ptq “ ´ 0 Sj´j where the index minus (here in Sj´ ) always indicates the left-continuous version of a right-continuous function. The survival times are randomly right-censored by independent, positive variables Cj1 , . . . , Cjnj with possibly discontinuous censoring survival functions Gj , j “ 1, 2. Observation is thus restricted to Xj “ tpXj1 , δj1 q, . . . , pXjnj , δjnj qu,
j “ 1, 2,
where Xji “ minpTji , Cji q, δji “ 1tXji “ Tji u, 1 ď i ď nj . Note that the choice of K shall imply a positive probability of each tT˜ji ą Ku. This constant K could, for example, be the end-of-study time, i.e. the largest censoring time. For later use we also introduce the usual counting process notation Nj;i puq “ 1t“ind. i of group j has an observed event during r0, us”u “ 1tXji ď u, δij “ 1u, Yj;i puq “ 1t“ind. i of group j is under observation at time u´”u
“ 1tXji ě uu.
řnj Yj;i puq, the number of Summing up these quantities within each group results in Yřj puq “ i“1 nj group-j subjects under study shortly before u, and Nj puq “ i“1 Nj;i puq, the number of observed events in group j until time u. Denote by f ˘ “ 12 pf ` f´ q the normalized version of a rightcontinuous function f . With this notation the Mann-Whitney effect (1.1) and the win ratio (1.2) are given as p “ P pT11
1 ą T21 q ` P pT11 “ T21 q “ ´ 2
ż
ż S1˘ dS2
“1´
F1˘ dF2
(2.1)
and w “ p{p1 ´ pq, respectively. If not specified, integration is over r0, Ks. In this set-up we test the null hypothesis H0p : tp “ 1{2u “ tw “ 1u that the survival times from both groups are tendentiously equal against one- or two-sided alternatives. We note that the usually considered null hypothesis H0S : tS1 “ S2 u of equal survival distributions is more restrictive and implies H0p . Similarly, a stochastic order or precedence (Davidov and Herman 2012) such as F1 ň F2 implies p ě 1{2. In order to test H0S for continuous survival times, Efron (1967) has introduced a natural estimator for p, see also Koziol and Jia (2009), by replacing the unknown survival functions Sj in (2.1) with the corresponding Kaplan-Meier estimators Spj , j “ 1, 2. Thus, utilizing the normalized versions of the non-parametric maximum likelihood estimators yields pp “ PppT11
1 ą T21 q ` PppT11 “ T21 q “ ´ 2 4
ż Sp1˘ dSp2
(2.2)
p “ pp{p1 ´ ppq as reasonable estimators of p and w, respectively. Similar estimators for p have and w been proposed by Akritas and Brunner (1997) and Brunner and Munzel (2000). The latter quantity w p has been introduced by Pocock et al. (2012) for uncensored observations (without ties) with the nice interpretation as total number of winners divided by the total number of losers in group 1 (where T1i wins against T2` if T1i ą T2` ). In order to obtain tests for H0p as well as one- or two-sided confidence intervals for the MannWhitney effect p and the win ratio w, we study the limit behaviour of pp under the general asymptotic framework 0 ă lim inf
n1 n1 ď lim sup ă1 n n
(2.3)
as n1 ^ n2 Ñ 8. For a better illustration in intermediate steps we sometimes also assume that a unique limit exists, i.e., as n1 ^ n2 Ñ 8, n1 {n Ñ κ P p0, 1q.
(2.4)
Our main theorems, however, will only rely on the weak assumption of display (2.3). d
p
We denote by “ÝÑ” and “ÝÑ” weak convergence and convergence in outer probability as n Ñ 8, respectively, both in the sense of van der Vaart and Wellner (1996). The following central limit theorem for pp is the normalized counterpart of the asymptotics due to Efron (1967) and is proven by means of the functional δ-method in combination with the weak convergence theorem for the Kaplan-Meier estimator as stated in van der Vaart and Wellner (1996), Section 3.9. a p´ Theorem 2.1. (i) Suppose (2.4) holds, then the Mann-Whitney statistic Vn “ Vn ppq “ n1 n2 {npp d
pq is asymptotically normal distributed, i.e. Vn ÝÑ Z „ N p0, σ 2 q as n Ñ 8. The limit variance 2 2 is σ 2 “ p1 ´ κqσ12 ` κσ21 , where for j, k P tp1, 2q, p2, 1qu:
ż u^v
ż ż 2 σjk
“
Γ˘˘ j pu, vqdSk puqdSk pvq
and Γj pu, vq “ Sj puqSj pvq 0
dΛj . Sj´ Gj´
(2.5)
Moreover, Γ˘˘ denotes the normalized covariance function given by j 1 Γ˘˘ j pu, vq “ rΓj pu, vq ` Γj pu´, vq ` Γj pu, v´q ` Γj pu´, v´qs. 4 a p asymptotically (ii) Under the conditions and notation of (i), the win ratio statistic n1 n2 {npw´wq follows a normal-N p0, σ 2 {p1 ´ pq4 q-distribution. Remark 2.2. (a) Efron (1967) originally used a version of the Kaplan-Meier estimator that always considered the last observation as being uncensored. Moreover, he considered the more special 5
null hypothesis H0S : tS1 “ S2 u in order to simplify the variance representation under the null. (b) Without a restriction at some point of time K, a consistent estimator for the Mann-Whitney effect requires consistent estimators for the survival functions on their whole support. This involves ş the condition ´ pdSj q{Gj´ ă 8, j “ 1, 2, which is obviously only possible if the support of Sj is contained in the support of Gj ; see e.g. Gill (1983), Ying (1989) and Akritas and Brunner (1997). However, this assumption is often not met in practice, e.g. if Gj puq “ 0 ă Sj puq for some point of time u ą 0. 2 Since the variances σjk are unknown under the null H0p , their estimation from the data is mandatory in order to obtain asymptotically consistent tests and confidence intervals for p and w.
3
Variance estimation and studentized test statistics
p A natural estiAsymptotically pivotal test statistics result of pp and w. a from studentized versions n1 n2 2 2 2 2 p “ n pp p21 q, where mator for the limit variance σ of Vn “ n1 n2 {npp p ´ pq is σ σ12 ` σ ż u^v
ż ż 2 pjk nj σ
p˘˘ pu, vqdSpk puqdSpk pvq nj Γ j
“
dNj
pj pu, vq “ Spj puqSpj pvq and Γ
p1 ´
0
∆Nj qYj2 Yj
(3.1)
for 1 ď j ‰ k ď 2. Here, the function ∆f puq “ f puq ´ f pu´q contains all jump heights of a right-continuous function f . p
p2 is consistent for σ 2 defined in Theorem 2.1, i.e. σ p2 ÝÑ Lemma 3.1. Under (2.4) the estimator σ σ2. This result directly leads to the studentized statistics c Tn ppq “
n1 n2 pp ´ p p n σ
c and
Wn pwq “
n1 n2 p1 ´ ppq2 pw p ´ wq “ p n σ
c
p´w n1 n2 w (3.2) pp1 ` wq p2 n σ
which are both asymptotically standard normal as n1 ^ n2 Ñ 8 by Slutzky’s Theorem and the δ-method only assuming (2.3). Indeed, under (2.3), Theorem 2.1 and Lemma 3.1 might be applied along each convergent subsequence of n1 {n. Since all resulting limit distributions of Tn ppq and Wn ppq are pivotal, i.e. independent of κ, this weak convergence must hold for the original sequence as well. Thus, two-sided confidence intervals for p and w of asymptotic level p1 ´ αq P p0, 1q are ? „ p n zα{2 σ In “ pp ¯ ? (for p) n1 n2
„ and 6
p zα{2 σ w p ¯ p1 ´ ppq2
c
n n1 n2
(for w),
(3.3)
respectively, where zα denotes the p1 ´ αq-quantile of the standard normal distribution. Moreover, ϕn “ 1tTn p1{2q ą zα u
and
ψn “ 1tWn p1q ą zα u
(3.4)
are consistent asymptotic level α tests for H0p : tp “ 21 u “ tw “ 1u against the one-sided alternative hypothesis H1p : tp ą 12 u “ tw ą 1u, i.e. Epϕn q Ñ α1tp “ 1{2u ` 1tp ą 1{2u and Epψn q Ñ α1tw “ 1u ` 1tw ą 1u as n Ñ 8. One-sided confidence intervals and two-sided tests can be obtained by inverting the above procedures. For larger sample sizes (nj ą 30 depending on the magnitude of censoring), the above inference methods (3.3) and (3.4) are fairly accurate; see the simulation results in Section 5. For smaller sample sizes, however, these procedures tend to have inflated type-I error probabilities. Therefore, we propose different resampling approaches and discuss their properties in the following section. For ease of presentation, we only consider resampling tests for H0p : tp “ 21 u in order to concentrate on one parameter of interest (i.e. on p) only. Nevertheless, the results directly carry over to construct resampling-based confidence intervals for p and w, respectively.
4
Resampling the Mann-Whitney statistic
Even in the continuous case, Koziol and Jia (2009) pointed out that “with small samples sizes a bootstrap a approach might be preferable” for approximating the unknown distribution of Vn “ p ´ pq. To this end, we consider different resampling methods, starting with Vn ppq “ n1 n2 {npp Efron’s classical bootstrap. Here the bootstrap sample is generated by drawing with replacement from the original data pairs; see Efron (1981). Large sample properties of the bootstrapped KaplanMeier process and extensions thereof have been analyzed e.g. in Akritas (1986), Lo and Singh (1986) and Horvath and Yandell (1987). Calculating the bootstrap version of pp via bootstrapping for each sample group and using their quantiles leads to a slightly improved control of the type-I error probability in comparison to the asymptotic test (3.4). However, this way of bootstrapping results in a still too inaccurate behaviour in terms of too large deviations from the α “ 5% level (results not shown). This technique is typically improved by resampling procedures based on the pooled data Z “ tpZi , ηi q : i “ 1, . . . , nu given by pZi , δi q “ pX1i , δ1i q1ti ď n1 u ` pX2pi´n1 q , δ2pi´n1 q q1ti ą n1 u,
i “ 1, . . . , n;
see e.g. Boos et al. (1989), Janssen and Pauls (2005) and Neubert and Brunner (2007) for empirical verifications for other functionals in this matter. Boos et al. (1989) and Konietschke and Pauly (2014) also demonstrate that random permuting of and bootstrapping from pooled samples may yield to superior results, where the first has the additional advantage of leading to finitely exact testing procedures in case of S1 “ S2 and G1 “ G2 . We investigate both techniques in more detail below. 7
4.1
The pooled bootstrap
We independently draw n times with replacement from the pooled data Z to obtain the pooled ˚ ˚ n1 ˚ ˚ n2 bootstrap samples Z˚1 “ pZ1i , η1i qi“1 and Z˚2 “ pZ2i , η2i qi“1 . Denote the corresponding KaplanMeier estimators based on these bootstrap samples as S1˚ and S2˚ . These may also be regarded as the nj out of n bootstrap versions of the Kaplan-Meier estimator Sp based ş ˚˘ on˚the pooled sample ˚ Z. All in all, this results in the pooled bootstrap version p “ ´ S1 dS2 of pp. A suitable ş ˘ centering term for p˚ is based on the pooled Kaplan-Meier estimator and is given by ´ Sp dSp “ 21 . a n1 n2 ˚ 1 ˚ Thus, we study the distribution of Vn “ pp ´ 2 q for approximating the null distribution of n a n1 n2 1 pp p ´ 2 q. n To investigate the large sample behaviour of the bootstrap statistic p˚ , first note that the pooled Kaplan-Meier estimator Sp is a functional of the empirical processes based on X1 and X2 . Since this functional is Hadamard-differentiable with uniformly continuous linear derivative function, Donsker theorems for the empirical processes of X1 and X2 immediately carry over to the pooled Kaplan-Meier estimator. In case of continuously distributed event times this can also be seen by utilizing the usual martingale arguments of Andersen et al. (1993), Section IV.3. In all convergence results stated below the c`adl`ag space Dr0, Ks is always equipped with the sup-norm; cf. van der Vaart and Wellner (1996). Lemma 4.1. Suppose that (2.4) holds. Then, as n Ñ 8, we have
? p d npS ´ Sq ÝÑ U on Dr0, Ks,
where U is a zero-mean Gaussian process with covariance function ż r^s Γ : pr, sq ÞÑ SprqSpsq 0
Here dΛ “
κS1´ G1´ dΛ1 κS1´ G1´ `p1´κqS2´ G2´
`
dΛ . p1 ´ ∆ΛqpκS1´ G1´ ` p1 ´ κqS2´ G2´ q
p1´κqS2´ G2´ dΛ2 κS1´ G1´ `p1´κqS2´ G2´
(4.1)
and Sptq “ Pp0,ts p1 ´ dΛq.
A similar behaviour of the bootstrap counterpart is established in the following theorem. Its proof relies on the δ-method for the bootstrap from which the large sample properties of Vn˚ can be established as well. Theorem 4.2. Suppose that (2.4) holds. As n Ñ 8 and given Z, we have conditional weak convergence on Dr0, Ks, ? d p ÝÑ nj pSj˚ ´ Sq U,
j “ 1, 2,
in outer probability towards a Gaussian zero-mean process U with covariance function Γ given in (4.1). Since pooled sampling affects the covariance structure related to Vn˚ (see the Appendix for details), a studentization becomes mandatory. This is also in line with the general recommendation 8
to bootstrap studentized statistics, see e.g. Hall and Wilson (1991), Janssen and Pauls (2005) or Delaigle et al. (2011). To this end, introduce the bootstrap variance estimator σ
˚2
ż ż ı ” ż u^v dΛ˚1 n2 ˚ S1˚ pvqdS2˚ puqS2˚ pvq “ S1 puq n1 ˚ ˚ qY n p1 ´ ∆Λ 0 1 1 ż ż ı ” ż u^v ˚ n1 dΛ 2 ` S2˚ pvqdS1˚ puqS1˚ pvq, S2˚ puq n2 ˚ ˚ qY n p1 ´ ∆Λ 0 2 2
where Nj˚ and Yj˚ are the obvious bootstrap versions of the counting processes Nj and Yj and dΛ˚j “ dNj˚ {Yj˚ define the pooled bootstrap version of the Nelson-Aalen estimator, j “ 1, 2. We state our main result on the pooled bootstrap. Theorem 4.3. Suppose that (2.3) holds. Then the studentized bootstrap statistic Tn˚ “ Vn˚ {σ ˚ always approximates the null distribution of Tn p1{2q in outer probability, i.e. we have for any choice of p and as n1 ^ n2 Ñ 8: ˇ ˇ p sup ˇPp pTn˚ ď x|Zq ´ P1{2 pTn p1{2q ď xqˇ ÝÑ 0.
(4.2)
x
Moreover, denoting by c˚n pαq the conditional p1 ´ αq-quantile of Tn˚ given Z, it follows that ϕ˚n “ 1tTn p1{2q ą c˚n pαqu is a consistent asymptotic level α test for H0p : tp “ 21 u against H1p that is asymptotically equivalent to ϕn , i.e. we have Ep|ϕ˚n ´ ϕn |q Ñ 0.
4.2
Random permutation
An alternative resampling technique to Efron’s bootstrap is the permutation principle. The idea is to randomly interchange the group association of all individuals while maintaining the original sample sizes. The effect measure is then calculated anew based on the permuted samples. A big advantage of permutation resampling over the pooled bootstrap is the finite exactness of inference procedures on the smaller null hypothesis H0S,G : tS1 “ S2 and G1 “ G2 u Ă H0p ;
(4.3)
see e.g. Neuhaus (1993) and Brendel et al. (2014) in case of testing H0S and Janssen (1997), Janssen (1999), Neubert and Brunner (2007), Chung and Romano (2013a,b), Pauly et al. (2015) as well as Pauly et al. (2016) in other situations without censoring. Therefore, let π : Ω Ñ Sn be independent of Z and uniformly distributed on the symmetric group Sn , the set of all permutations of p1, . . . , nq. The permuted samples are obtained as Zπ1 “ 9
1 pZπpiq , ηπpiq qni“1 and Zπ2 “ pZπpiq , ηπpiq qni“n1 `1 . Plugging the Kaplan-Meier estimators S1π and S2π based on these permuted samples into the Wilcoxon functional leads to the permutation version
ż π
S1π˘ dS2π
p “´
of pp. The permutation sampling is equivalent to drawing without replacement from the pooled sample Z. The following auxiliary result for the permutation version of the Kaplan-Meier estimator is analogous to Theorem 4.2, where now D2 r0, Ks is equipped with the max-sup-norm. Theorem 4.4. Suppose that (2.4) holds. Then, as n Ñ 8, the permutation versions of the KaplanMeier estimators conditionally converge on D2 r0, Ks in distribution ? ? ? d p ?n2 pS π ´ Sqq p ÝÑ p n1 pS1π ´ Sq, p 1 ´ κU, ´ κU q 2 given Z in outer probability. Here, U is a zero-mean Gaussian process with covariance function Γ given in (4.1). a It is shown in the Appendix, that Vnπ “ n1nn2 ppπ ´ 12 q does in general not possess the same limit distribution as Vn . Indeed, the limit variances may be different in general and again studentip2 : zation of Vnπ is necessary. This is achieved by utilizing the permutation version of σ σ
π2
n2 “ n
ż ż
n1 ` n
ż ż
ż u^v
”
S1π puq
n1 0
n2 0
p1
ı S1π pvqdS2π puqS2π pvq
∆N1π qY1π2 Y1π ı dN2π S2π pvqdS1π puqS1π pvq π ∆N2 π2 ´ Y π qY2 2
p1 ´
ż u^v
”
S2π puq
dN1π
yielding the studentized permutation statistic Tnπ “ Vnπ {σ π . It is indeed the permutation version of Tn p1{2q and also shares its asymptotic distribution as stated below. Theorem 4.5. Suppose that (2.3) holds. Then the studentized permutation statistic Tnπ “ Vnπ {σ π always approximates the null distribution of Tn p1{2q in outer probability, i.e. we have for any choice of p and as n1 ^ n2 Ñ 8: ˇ ˇ p sup ˇPp pTnπ ď x|Zq ´ P1{2 pTn p1{2q ď xqˇ ÝÑ 0.
(4.4)
x
Moreover, denoting by cπn pαq the conditional p1 ´ αq-quantile of Tnπ given Z, it follows that ϕπn “ 1tTn p1{2q ą cπn pαqu possesses the same asymptotic properties as ϕ˚n in Theorem 4.3. Furthermore, 10
ϕπn is even a finitely exact level α test under H0S,G .
5
Finite sample properties
In this section we study the finite-sample properties of the proposed approximations. In particular, we compare the actual coverage probability of the asymptotic two-sided confidence interval In given in (3.3) with that of the corresponding bootstrap and permutation confidence intervals In˚
„ ? c˚n pα{2qp σ n “ pp ¯ ? n1 n2
? cπn pα{2qp σ n “ pp ¯ , ? n1 n2 „
and
Inπ
respectively. To this end, the following distribution functions F1 and F2 , frequently occuring in the survival context, have been chosen in our simulation study: (1) Group 1: Exponential distribution with mean 1{2, i.e. F1 “ Expp1{2q. Group 2: Mixture of two exponential distributions: F2 “ 13 Expp1{1.27q ` 32 Expp1{2.5q. End-of-study time: K « 1.6024 such that p « 1{2. (2) Group 1: Weibull distribution with scale parameter 1.65 and shape parameter 0.9. Group 2: Standard lognormal distribution. End-of-study time: K « 1.7646 such that p « 1{2. (3) Groups 1 and 2: Equal Weibull distributions with scale parameters 1 and shape parameters 1.5. End-of-study time: K “ 2 such that p “ 1{2. Censoring is realized using i.i.d. exponentially distributed censoring variables Cji with parameters chosen such that the (simulated) censoring probability (after truncation at K) for each of both sample groups belongs to the following ranges: • Strong censoring: Censoring percentages between 40.97 and 43.6 per cent, • Moderate censoring: Censoring percentages between 21.19 and 26.39 per cent, • No censoring: Censoring percentages set to zero. The sample sizes range over n1 “ n2 P t10, 15, 20, 25, 30u as well as n2 “ 2n1 P t20, 30, 40, 50, 60u. Simulating 10,000 individuals each, the approximate proportions of observations greater than K are given in Table 1. 11
strong set-up / censoring Group I/II (1) 0.36 / 0.32 (2) 12.16 / 10.44 (3) 1.54
moderate none Group I/II Group I/II 1.19 / 1.35 4.12 / 4.26 22.3 / 17.43 34.26 / 28.37 3.28 6.02
Table 1: Simulated percentages of observations greater than the respective K. In set-ups (1) and (2) the proportions for both sample groups are separated by a “ / ”.
The pre-specified nominal level is 1 ´ α “ 95%. Each simulation was carried out using N “ 10, 000 independent tests, each with B “ 1, 999 resampling steps in R version 3.2.3 (R Development Core Team 2016). All Kaplan-Meier estimators were calculated using the R package etm by Allignol et al. (2011). In comparison to the pooled bootstrap confidence interval In˚ , the permutation-based confidence interval Inπ provides even finitely exact coverage probabilities if the restricted null hypothesis H0S,G given in (4.3) is true. The simulation results for all scenarios are summarized in Tables 2 and 3. Starting with the balanced setting (n1 “ n2 ) it can be readily seen that in case of no censoring, both, the asymptotic and permutation confidence intervals In and Inπ show very accurate coverages; even for small samples.
set-up (1)
(2)
(3)
censoring n1 10, 10 15, 15 20, 20 25, 25 30, 30 10, 10 15, 15 20, 20 25, 25 30, 30 10, 10 15, 15 20, 20 25, 25 30, 30
In 90.63 92.69 93.08 93.64 93.96 91.73 93.26 93.70 94.06 94.28 89.88 92.05 92.98 93.32 93.90
strong In˚ 95.70 95.48 95.83 95.37 94.91 95.32 94.73 94.80 94.96 94.52 95.33 95.60 95.05 95.12 95.09
Inπ 94.95 94.99 94.65 94.38 94.31 94.85 95.08 95.00 94.95 94.69 94.64 94.82 95.32 94.78 94.96
moderate Inπ In In˚ 93.49 94.63 95.08 94.26 94.59 95.06 94.00 94.20 94.63 94.41 94.18 94.70 94.73 94.12 94.27 93.97 94.26 95.26 94.76 94.66 94.69 94.80 94.47 95.05 94.87 94.41 95.13 95.22 94.78 94.86 92.86 94.65 94.92 93.85 94.58 95.09 94.33 94.26 95.03 94.07 94.32 95.11 94.63 94.60 95.09
In 95.02 94.76 95.56 94.95 95.34 95.48 95.48 95.48 95.66 95.64 94.86 95.57 95.22 95.34 94.95
none In˚ 93.80 93.91 93.84 93.45 93.80 93.68 94.11 94.17 94.09 94.44 94.30 94.06 94.36 94.38 94.05
Inπ 94.63 94.46 94.98 94.66 94.37 94.97 95.18 95.21 94.78 94.74 94.97 95.28 95.25 95.04 94.64
Table 2: Simulated coverage probabilities (in %) of two-sided asymptotic 95% confidence intervals for p “ 0.5 and equal sample sizes n1 “ n2 . 12
This is in line with previous findings of α-level control of rank-based tests for H0p (e.g. Neubert and Brunner 2007 or Pauly et al. 2016). In comparison the bootstrap based confidence intervals In˚ are slightly liberal; especially in the exponential set-up (1) with coverages between 93.45% and 93.91%. In case of moderate and strong censoring, however, the behaviour of the asymptotic and bootstrap confidence intervals changes: The asymptotic procedure In based on normal quantiles gets liberal while the bootstrap procedure is more or less accurate. The liberality of In is particularly apparent for the smallest total sample sizes of n “ 20 (with coverages between 89.88% and 91.73%) but also remains present with increasing sample sizes. In comparison, the permutation interval Inπ achieved very accurate results in all set-ups. Even in the presence of strong censoring and with unequal distributions (set-ups (1) and (2)) the simulated coverage probabilities are always very close to the nominal level of 95%. censoring set-up n1 (1) 10, 20 15, 30 20, 40 25, 50 30, 60 (2) 10, 20 15, 30 20, 40 25, 50 30, 60 (3) 10, 20 15, 30 20, 40 25, 50 30, 60
In 91.66 92.41 93.62 93.07 92.94 92.02 92.94 94.01 93.94 94.24 90.99 92.18 93.35 93.18 94.03
strong In˚ 95.21 95.35 94.77 94.55 94.42 95.21 95.30 95.45 95.21 94.97 95.46 95.07 95.27 95.51 94.82
Inπ 95.13 94.59 94.53 94.37 94.48 95.11 95.37 95.29 94.93 94.93 95.14 95.23 95.04 95.14 95.01
moderate In In˚ Inπ 93.08 94.09 94.91 93.77 94.16 95.00 93.93 93.93 94.63 93.98 94.06 94.01 93.97 94.28 94.46 93.43 94.49 95.09 94.57 94.90 95.16 94.45 94.75 95.19 95.14 94.84 95.11 94.73 95.30 95.00 92.99 94.79 94.88 93.58 94.90 95.12 94.02 94.80 94.72 94.78 94.80 94.58 94.45 95.02 94.82
In 94.20 94.34 94.50 94.46 94.83 94.93 95.29 95.46 95.72 95.74 94.61 94.61 94.81 94.84 94.90
none In˚ 93.71 93.86 93.60 93.96 93.27 94.33 94.60 95.67 95.15 94.81 94.27 94.00 94.82 94.59 94.24
Inπ 94.48 94.30 94.51 94.43 94.35 95.03 95.32 95.98 95.27 96.05 94.63 94.81 94.72 94.97 95.04
Table 3: Simulated coverage probabilities (in %) of two-sided asymptotic 95% confidence intervals for p “ 0.5 and unequal sample sizes 2n1 “ n2 .
From the results for the unbalanced case 2n1 “ n2 , shown in Table 3, we can draw the same conclusion. In particular, the permutation approach seems to be the most promising since it does not only show the best coverages probabilities but has the additional advantage of being finitely exact in case of equal censoring and survival distributions, i.e. for F1 “ F2 (implying p “ 1{2) and G1 “ G2 . All in all, the permutation procedure can be generally recommended. In the censored case the bootstrap procedure shows a similar coverage (with a minor liberality for moderate censoring) but 13
does not possess the nice exactness property under H0S,G . The asymptotic procedure can only be recommended for larger sample sizes if no or only slight censoring is apparent.
6
Application to a data example
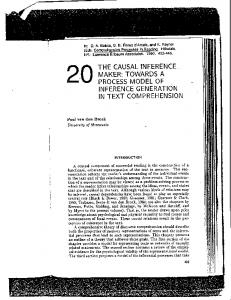
To illustrate the practical applicability of our novel approaches we reconsider a data-set containing survival times of tongue cancer patients, cf. Klein and Moeschberger (2003). This data-set is freely available in the R package KMsurv via data(tongue). It contains 80 patients of which n1 “ 52 are suffering from an aneuploid tongue cancer tumor (group 1) and n2 “ 28 are suffering from a diploid tumor (group 2). Observation of 21 patients in group 1 and of six patients in group 2 have been right-censored, for all others the time of death has been recorded. Thus, the corresponding censoring proportions are intermediate between the “strong” and “moderate” scenarios of Section 5. Note that the data set actually contains ties: among the uncensored survival times, there are 27 different times of death in the first group, 20 different in the second group, and 39 different in the pooled sample. There are three individuals in group 1 with censoring time exceeding the greatest recorded time of death in this group; for group 2 there is one such individual. As a reasonable value for restricting the time interval, we may thus choose K “ 200 weeks which still precedes all just mentioned censoring times. The Kaplan-Meier estimators correspoding to both recorded groups are plotted in Figure 1. It shows that the aneuploid Kaplan-Meier curve is always above the Kaplan-Meier curve of the diploid group. We would therefore like to examine whether this gap already yields significant results concerning the probability of concordance. The data evaluation resulted in a point estimate pp « 0.6148 indicating a slightly larger survival probability of the aneuploid group in comparison to the diploid. To infer this, the one- and twosided 95% confidence intervals (based on normal, bootstrap and permutation quantiles) for the probability p that a randomly chosen individual with an aneuploid tumor survives longer than a corresponding patient with diploid tumor are given in Table 4. These have been calculated using the asymptotic normal quantile as well as B “ 9, 999 resampling iterations for each of the bootstrap and the permutation technique. confidence interval method two-sided one-sided asymptotic [0.475, 0.755] [0.497, 1.000] bootstrap [0.457, 0.772] [0.507, 1.000] permutation [0.464, 0.766] [0.506, 1.000] Table 4: One- and two-sided 95% confidence intervals based on normal, bootstrap and permutation quantiles for the Mann-Whitney effect in the tongue cancer data. In all cases the point estimate is pp « 0.6148. 14
1.0 0.6 0.4 0.0
0.2
Survival Probability
0.8
Aneuploid Tumor Diploid Tumor
0
50
100
150
200
Time (in Weeks)
Figure 1: Kaplan-Meier estimators for patients with diploid tumor (- - -) and aneuploid tumor (—–). By inverting these confidence intervals it can be readily seen that the two-sided null hypothesis H0p : tp “ 1{2u cannot be rejected by any procedure since p “ 1{2 is contained in all two-sided intervals. However, if we were only interested in detecting an effect in favor of the aneuploid group, we have to consider the corresponding one-sided tests to avoid possible directional errors. p In particular, the results for testing the one-sided hypothesis H0,ď : tp ď 1{2u are borderline: It can be rejected by the resampling approaches at level 5% but lies close to the confidence limit of the asymptotic interval. Here, a slightly larger data-set might have caused a different decision. We note that multiplicity issues have not been taken into account.
7
Summary and discussion
In this article, novel inference procedures for the Mann-Whitney effect p and the win ratio w are introduced both of which are meaningful and well-established effect measures (especially in biometry and survival analysis). In comparison to the usual survival hypothesis H0S : tS1 “ S2 u, we were the first who particularly developed asymptotic confidence intervals for p and w as well as tests for the more interesting composite null hypothesis H0p : tp “ 1{2u in the two-sample survival model with right-censored data. By utilizing normalized Kaplan-Meier estimates these can even be constructed for discontinuously distributed survival times that may be subject to independent 15
right-censoring. Applying empirical process theory we showed that point estimates of p and w are asymptotically normal. By introducing novel variance estimates, this leads to asymptotic inference procedures based on normal quantiles. To improve their finite sample performance, bootstrap and permutation approaches have been considered and shown to maintain the same asymptotic properties. In our simulation study it could be seen that the proposed permutation procedure considerably improves the finite sample performance of our procedure. Moreover, it is even finitely exact if data is exchangeable (i.e., whenever both survival and both censoring distributions are equal) and can thus be recommended as the method of choice. In the special continuous situation with complete observations a similar result has been recently proven in Chung and Romano (2016). Note, that the proposed method can also be applied in the ‘winner-loser’ set-ups considered in Pocock et al. (2012) or Wang and Pocock (2016), where now even the neglected ties can be taken into account. We plan to do this in the near future. Moreover, extensions of the proposed techniques to other models such as multiple samples and multivariate or specific paired designs (e.g. measurements before and after treatment) will also be considered in a forthcoming paper.
Appendix A
Proofs
Proof of Theorem 2.1: Integration by parts shows that ż ż 1 1 1 1 S1 dS2 ` S2 dS1 ´ S1 pKqS2 pKq ` S1 p0qS2 p0q p“´ “´ 2 2 2 2 ż ż 1 1 1 “´ S1 dS2 ` S2 dS1 ` 2 2 2 ż ż 1 1 1 “´ S1 dS2 ` S2 dS1 ` “: φpS1 , S2 q. 2 r0,Kq 2 r0,Kq 2 ż
S1˘ dS2
Here it is important to exclude the right boundary K of the support of S1 and S2 since otherwise theorems on the weak convergence of the Kaplan-Meier estimator on the whole support of the survival function would be required; see Gill (1983) and Ying (1989) for such statements as well as Dobler (2016) for a bootstrap version. Each integral is a Hadamard-differentiable functional of pS1 , S2 q tangentially to ˘ H2 :“ tph1 , h2 q P D2 r0, Ks : h˘ 1 P L1 |r0,Ks pS2 q, h2 P L1 |r0,Ks pS1 q, h1 p0q “ h2 p0q, h1 pKq “ h2 pKq “ 0u;
16
see e.g. van der Vaart and Wellner (1996), Lemma 3.9.17. Note that S1 , S2 are monotone and thus of bounded variation. The continuous, linear Hadamard-derivative is given by 1” dφpS1 ,S2 q ¨ ph1 , h2 q “ ´ 2
ż
ż
ż
S1 dh2 ´ r0,Kq
ż
h1 dS2 ` r0,Kq
S2 dh1 ` r0,Kq
ı h2 dS1 ,
r0,Kq
integrals with respect to h1 , h2 defined via integration by parts. Because the integrands and integrators have no mass in K, this derivative can be further simplified to ż dφpS1 ,S2 q ¨ ph1 , h2 q “ ´
ż h˘ 1 dS2
`
h˘ 2 dS1 ,
(A.1)
again via integration by parts. By the functional δ-method (Section 3.9 in van der Vaart and Wellner 1996), we thus conclude that c
n1 n2 rφpSp1 , Sp2 q ´ φpS1 , S2 qs n c n1 n2 p “ dφpS1 ,S2 q ¨ pS1 ´ S1 , Sp2 ´ S2 q ` op p1q n c ż c ż n1 ? p n2 ? p ˘ n2 pS2 ´ S2 q dS1 ´ n1 pS1 ´ S1 q˘ dS2 ` op p1q “ n n ż ż ? d ? ˘ ÝÑ κ U2 dS1 ` 1 ´ κ U1˘ dS2 “: Z
Vn ppq “
as n Ñ 8, where U1 and U2 are independent, Dr0, Ks-valued, zero-mean Gaussian processes with covariance functions ż r^s dΛj , j “ 1, 2, 0 ď r, s ď K Γj : pr, sq ÞÑ 1tr, s ă KuSj prqSj psq p1 ´ ∆Λj qSj´ Gj´ 0 and with U1 pKq “ U2 pKq ” 0; see Example 3.9.31 in van der Vaart and Wellner (1996). Thus, EpZq “ 0 and ż ż 2
σ “ varpZq “ κ
ż ż Γ˘˘ 2 dS1 dS1
` p1 ´ κq
Γ˘˘ 1 dS2 dS2
1 where again Γ˘˘ j pr, sq “ 4 rΓj pr, sq ` Γj pr, s´q ` Γj pr´, sq ` Γj pr´, s´qs, j “ 1, 2. p
l
p2 ÝÑ σ 2 follows Proof of Lemma 3.1: The consistency σ from the consistency of the Kaplan-Meier ş 2 estimator, the continuity of D r0, Ks Q pf, gq ÞÑ f dg in all functions g of bounded variation (see the proof of Lemma 3 in Gill 1989), as well as from the continuity of Dr0, Ks Q f ÞÑ f1 in all 17
functions that are bounded away from zero.
l
Proof of Lemma 4.1: This statement is proven basically in the same way as the large-sample properties of the sample-specific Kaplan-Meier estimators, i.e., applying the functional δ-method (Theorem 3.9.5 in van der Vaart and Wellner 1996) to the (pooled) empirical process of Z, indexed by F “ t1t ¨1 ď z, ¨2 “ 1u, 1t ¨1 ě zu : z P r0, Kqu. The only difference is the limit of the pooled Nelson-Aalen estimator: Writing N “ N1 ` N2 and Y “ Y1 ` Y2 and letting t P r0, Ks, we have ż Y1 n dN1 n2 t Y2 n dN2 ` n 0 n2 Y Y2 0 n1 Y Y1 0 żt żt S1´ G1´ S2´ G2´ p ÝÑ κ dΛ1 ` p1 ´ κq dΛ2 . 0 κS1´ G1´ ` p1 ´ κqS2´ G2´ 0 κS1´ G1´ ` p1 ´ κqS2´ G2´ żt
p “ Λptq
n1 dN “ Y n
żt
Thus, substituting this quantity for the cumulative hazard function in the asymptotic covariance function of the Kaplan-Meier estimator, the proof is complete. l Proof of Theorem 4.2: This is simply an application of the δ-method for the bootstrap (Theorem 3.9.11 in van der Vaart and Wellner 1996) to the result of Lemma 4.1 and the two-sample bootstrap Donsker Theorem 3.7.6 in van der Vaart and Wellner (1996). Note, that we employ a Donsker theorem for c n1 n2 ´ Z n1 pX1 ,δ1 q n2 pXn ,δn q ¯ Pn ´ P ´ P , n n n PZn being the empirical process of the pooled sample Z. This yields the same limit distribution of ? p as in Lemma 4.1 by the uniform Hadamard-differentiability of all involved functionnj pSj˚ ´ Sq als, concluding the proof. l Proof of Theorem 4.3: This is just another application of the functional δ-method for the bootstrap, applied to the Wilcoxon statistic φ and the intermediate Theorem 4.2. To see the consistency of the bootstrap variance estimator, combine the Glivenko-Cantelli theorems for the bootstrap empirical processes of Z˚1 and Z˚2 with the continuous mapping theorem. Finally, apply Slutsky’s lemma; e.g. Example 1.4.7 in van der Vaart and Wellner (1996). l Proof of Theorem 4.4: This follows in the same way as Theorem 4.2, but with the asymptotic covariance function determined by the Donsker theorem for the permutation empirical process (cf. Theorem 3.7.1 in van der Vaart and Wellner 1996) and the observation that PXn11 ´ PZn “
n2 n2 X1 pPn1 ´ PXn22 q “ ´ pPXn22 ´ PZn q. n n1
Here PXn11 and PXn22 are the empirical processes based on X1 and X2 , respectively; cf. p. 361 in van der Vaart and Wellner (1996). l Proof of Theorem 4.5: This theorem is proven in the same way as Theorem 4.3, using the intermediate result of Theorem 4.4. However, the asymptotic variance of Vnπ requires some attention: By 18
the functional δ-method Vnπ is asymptotically equivalent to the image of c
n1 n2 Zπ1 π d pPn1 ´ PZn , PZn22 ´ PZn q ÝÑ pp1 ´ κqU, ´κU q n Zπ
under a continuous linear map, where Pnjj is the jth permutation empirical process, j “ 1, 2, and the Gaussian process U is given by Theorem 4.4. But this map (i.e., the Hadamard derivative) also subtracts both components of the previous display, cf. (A.1). Hence, Tnπ has the same large sample behaviour as its bootstrap counterpart Tn˚ of Theorem 4.3. The finite exactness under exchangeable data is a well-known property of permutation tests, see e.g. Janssen and V¨olker (2007). l
References S. Abdalla, M. E. Montez-Rath, P. S. Parfrey, and G. M. Chertow. The win ratio approach to analyzing composite outcomes: An application to the EVOLVE trial. Contemporary Clinical Trials, 48:119–124, 2016. L. Acion, J. J. Peterson, S. Temple, and S. Arndt. Probabilistic index: An intuitive non-parametric approach to measuring the size of treatment effects. Statistics in Medicine, 25(4):591–602, 2006. M. G. Akritas. Bootstrapping the Kaplan-Meier Estimator. Journal of the American Statistical Association, 81(396):1032–1038, 1986. M. G. Akritas. Nonparametric Models for ANOVA and ANCOVA Designs. In International Encyclopedia of Statistical Science, pages 964–968. Springer, 2011. M. G. Akritas and E. Brunner. Nonparametric Methods for Factorial Designs with Censored Data. Journal of the American Statistical Association, 92(438):568–576, 1997. A. Allignol, M. Schumacher, and J. Beyersmann. Empirical Transition Matrix of MultiState Models: The etm Package. Journal of Statistical Software, 38(4):1–15, 2011. URL http://www.jstatsoft.org/v38/i04/. P. K. Andersen, Ø. Borgan, R. D. Gill, and N. Keiding. Statistical Models Based on Counting Processes. Springer, New York, 1993. M. A. Arcones, P. H. Kvam, and F. J. Samaniego. Nonparametric Estimation of a Distribution Subject to a Stochastic Precedence Constraint. Journal of the American Statistical Association, 97(457):170–182, 2002. I. Bebu and J. M. Lachin. Large sample inference for a win ratio analysis of a composite outcome based on prioritized components. Biostatistics, 17(1):178–187, 2016. 19
S. Bonnini, L. Corain, M. Marozzi, and L. Salmaso. Nonparametric Hypothesis Testing: Rank and Permutation Methods with Applications in R. John Wiley & Sons, 2014. D. Boos, P. Janssen, and N. Veraverbeke. Resampling from centered data in the two-sample problem. Journal of Statistical Planning and Inference, 21(3):327–345, 1989. M. Brendel, A. Janssen, C.-D. Mayer, and M. Pauly. Weighted logrank permutation tests for randomly right censored life science data. Scandinavian Journal of Statistics, 41(3):742–761, 2014. E. Brunner and U. Munzel. The Nonparametric Behrens-Fisher Problem: Asymptotic Theory and a Small-Sample Approximation. Biometrical Journal, 42(1):17–25, 2000. E. Chung and J. P. Romano. Exact and asymptotically robust permutation tests. The Annals of Statistics, 41(2):484–507, 2013a. E. Chung and J. P. Romano. Multivariate and multiple permutation tests. Technical report, Dept. Statistics, Stanford University, 2013b. E. Chung and J. P. Romano. Asymptotically valid and exact permutation tests based on two-sample U-statistics. Journal of Statistical Planning and Inference, 168:97–105, 2016. E. Cramer and U. Kamps. The UMVUE of P pX ă Y q based on type-II censored samples from Weinman multivariate exponential distributions. Metrika, 46(1):93–121, 1997. O. Davidov and A. Herman. Ordinal dominance curve based inference for stochastically ordered distributions. Journal of the Royal Statistical Society: Series B (Statistical Methodology), 74(5): 825–847, 2012. O. Davidov and S. Peddada. The linear stochastic order and directed inference for multivariate ordered distributions. Annals of Statistics, 41(1):1–40, 2013. J. De Neve, O. Thas, J.-P. Ottoy, and L. Clement. An extension of the Wilcoxon-Mann-Whitney test for analyzing RT-qPCR data. Statistical Applications in Genetics and Molecular Biology, 12(3):333–346, 2013. J. De Neve, J. Meys, J.-P. Ottoy, L. Clement, and O. Thas. unifiedWMWqPCR: the unified Wilcoxon–Mann–Whitney test for analyzing RT-qPCR data in R. Bioinformatics, 30(17):2494– 2495, 2014. A. Delaigle, P. Hall, and J. Jin. Robustness and accuracy of methods for high dimensional data analysis based on student’s t-statistic. Journal of the Royal Statistical Society: Series B (Statistical Methodology), 73(3):283–301, 2011. D. Dobler. Bootstrapping the Kaplan-Meier Estimator on the Whole Line. arXiv:1507.02838, 2016. 20
Preprint
D. Dunkler, M. Schemper, and G. Heinze. Gene selection in microarray survival studies under possibly non-proportional hazards. Bioinformatics, 26(6):784–790, 2010. B. Efron. The two sample problem with censored data. In Proceedings of the fifth Berkeley symposium on mathematical statistics and probability, 4:831–853, 1967. B. Efron. Censored Data and the Bootstrap. Journal of the American Statistical Association, 76 (374):312–319, 1981. R. D. Gill. Large Sample Behaviour of the Product-Limit Estimator on the Whole Line. The Annals of Statistics, 11(1):49–58, 1983. R. D. Gill. Non- and Semi-Parametric Maximum Likelihood Estimators and the von Mises Method (Part 1)[with Discussion and Reply]. Scandinavian Journal of Statistics, 16(2):97–128, 1989. P. I. Good. Permutation Tests: A Practical Guide to Resampling Methods for Testing Hypotheses. John Wiley & Sons, New York, second edition, 2010. P. Hall and S.R. Wilson. Two guidelines for bootstrap hypothesis testing. Biometrics, 47(2): 757–762, 1991. K. R. Hess. Comparing survival curves using an easy to interpret statistic. Clinical Cancer Research, 16(20):4912–4913, 2010. L. Horvath and B. Yandell. Convergence Rates for the Bootstrapped Product-Limit Process. The Annals of Statistics, 15(3):1155–1173, 1987. A. Janssen. Studentized permutation tests for non-i.i.d. hypotheses and the generalized BehrensFisher problem. Statistics & Probability Letters, 36(1):9–21, 1997. A. Janssen. Testing nonparametric statistical functionals with applications to rank tests. Journal of Statistical Planning and Inference, 81(1):71–93, 1999. A. Janssen and T. Pauls. A Monte Carlo comparison of studentized bootstrap and permutation tests for heteroscedastic two-sample problems. Computational Statistics, 20(3):369–383, 2005. A. Janssen and D. V¨olker. Most powerful conditional tests. Statistics & Decisions, 25(1/2007): 41–62, 2007. M. Kieser, T. Friede, and M. Gondan. Assessment of statistical significance and clinical relevance. Statistics in Medicine, 32(10):1707–1719, 2013. J. P. Klein and M. L. Moeschberger. Survival Analysis: Techniques for Censored and Truncated Data. Springer Science & Business Media, 2003. F. Konietschke and M. Pauly. Bootstrapping and permuting paired t-test type statistics. Statistics and Computing, 24(3):283–296, 2014. 21
F. Konietschke, L. A. Hothorn, and E. Brunner. Rank-based multiple test procedures and simultaneous confidence intervals. Electronic Journal of Statistics, 6:738–759, 2012. S. Kotz, Y. Lumelskii, and M. Pensky. The stress–strength model and its generalizations: theory and applications. World Scientific, Singapore, 2003. J. A. Koziol and Z. Jia. The concordance index C and the Mann–Whitney parameter P rpX ą Y q with randomly censored data. Biometrical Journal, 51(3):467–474, 2009. K. Lange and E. Brunner. Sensitivity, specificity and ROC-curves in multiple reader diagnostic trialsa unified, nonparametric approach. Statistical Methodology, 9(4):490–500, 2012. E. L. Lehmann and J. P. Romano. Testing Statistical Hypotheses. Springer Science & Business Media, New York, third edition, 2010. S.-H. Lo and K. Singh. The Product-Limit Estimator and the Bootstrap: Some Asymptotic Representations. Probability Theory and Related Fields, 71(3):455–465, 1986. X. Luo, H. Tian, S. Mohanty, and W. Y. Tsai. An Alternative Approach to Confidence Interval Estimation for the Win Ratio Statistic. Biometrics, 71(1):139–145, 2015. T. Martinussen and C. B. Pipper. Estimation of odds of concordance based on the Aalen additive model. Lifetime Data Analysis, 19(1):100–116, 2013. J. Medina, D. Y. Kimberg, A. Chatterjee, and H. B. Coslett. Inappropriate usage of the Brunner– Munzel test in recent voxel-based lesion-symptom mapping studies. Neuropsychologia, 48(1): 341–343, 2010. S. B. Nandi and A. B. Aich. A note on confidence bounds for P pX ą Y q in bivariate normal samples. Sankhy¯a: The Indian Journal of Statistics, Series B, 56(2):129–136, 1994. K. Neubert and E. Brunner. A studentized permutation test for the non-parametric Behrens–Fisher problem. Computational Statistics & Data Analysis, 51(10):5192–5204, 2007. G. Neuhaus. Conditional rank tests for the two-sample problem under random censorship. The Annals of Statistics, 21(4):1760–1779, 1993. M. Pauly, E. Brunner, and F. Konietschke. Asymptotic permutation tests in general factorial designs. Journal of the Royal Statistical Society: Series B (Statistical Methodology), 77(2):461– 473, 2015. M. Pauly, T. Asendorf, and F. Konietschke. Permutation tests and confidence intervals for the area under the ROC-Curve. Biometrical Journal, to appear, 2016. F. Pesarin and L. Salmaso. Permutation tests for complex data: theory, applications and software. John Wiley & Sons, 2010. 22
F. Pesarin and L. Salmaso. A review and some new results on permutation testing for multivariate problems. Statistics and Computing, 22(2):639–646, 2012. S. J. Pocock, C. A. Ariti, T. J. Collier, and D. Wang. The win ratio: a new approach to the analysis of composite endpoints in clinical trials based on clinical priorities. European heart journal, 33 (2):176–182, 2012. R Development Core Team. R: A Language and Environment for Statistical Computing. R Foundation for Statistical Computing, Vienna, Austria, 2016. URL http://www.R-project.org. G. Rauch, A. Jahn-Eimermacher, W. Brannath, and M. Kieser. Opportunities and challenges of combined effect measures based on prioritized outcomes. Statistics in Medicine, 33(7):1104– 1120, 2014. E. Ryu and A. Agresti. Modeling and inference for an ordinal effect size measure. Statistics in Medicine, 27(10):1703–1717, 2008. O. Thas, J. De Neve, L. Clement, and J.-P. Ottoy. Probabilistic index models. Journal of the Royal Statistical Society: Series B (Statistical Methodology), 74(4):623–671, 2012. A. W. van der Vaart and J. Wellner. Weak Convergence and Empirical Processes. Springer, New York et al., 1996. D. Wang and S. Pocock. A win ratio approach to comparing continuous non-normal outcomes in clinical trials. Pharmaceutical Statistics, 15(3):238–245, 2016. Z. Ying. A note on the asymptotic properties of the product-limit estimator on the whole line. Statistics & Probability Letters, 7(4):311–314, 1989. A. Zapf, E. Brunner, and F. Konietschke. A wild bootstrap approach for the selection of biomarkers in early diagnostic trials. BMC Medical Research Methodology, 15(1):43, 2015. X.-H. Zhou, D. K. McClish, and N. A. Obuchowski. Statistical Methods in Diagnostic Medicine. John Wiley & Sons, New York, 2002.
23