ACTA ACUSTICA UNITED WITH ACUSTICA Vol. 89 (2003) 355 – 368
Bowed String Simulation Using a Thermal Friction Model J. Woodhouse Cambridge University Engineering Department, Trumpington Street, Cambridge CB2 1PZ, UK.
[email protected]
Summary In the past, theoretical modelling of the motion of a bowed string has assumed that the frictional force due to the rosin on the bow was determined by the sliding speed only. Recently, it has been proposed that a better constitutive law would be to assume that the friction force is a function of the contact temperature. The predictions of these two models are compared, using the best available calibration data for the properties of the rosin and the instrument string. The main conclusion is that the thermal friction model predicts bowing behaviour which is more “benign”, in that the desired Helmholtz motion of the bowed string is established more reliably and more quickly than with the old friction model. The two models also predict different detailed behaviour of the frequency of the string oscillation as a function of normal force, the “flattening effect”. These predictions are amenable to direct experimental check, and it is hoped that measurements will soon provide evidence to test the predictions, discriminate between the models, and fine-tune the more successful model. PACS no. 43.75.De, 46.55
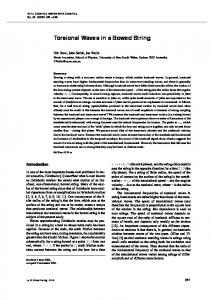
1. Introduction Much of the special quality of the violin derives from the complex and subtle range of vibration behaviour of a string excited by bowing. In recent decades, understanding of this behaviour has advanced steadily. Progress has been made by the development of increasingly complete theoretical models of the bowing process, and by comparing simulations based on these models with observations of real bowed strings. As a result many features of bowedstring motion have been explained qualitatively, and to a certain extent quantitatively [1, 2, 3, 4, 5, 6, 7]. One ingredient of these models which has remained largely unquestioned since the earliest work is the description of the interfacial friction between bow and string. It has been conventional to assume that the frictional force is governed by the speed of relative sliding between bow and string. If experimental measurements are made of the coefficient of friction of a rosin-coated surface during steady sliding at different speeds, results are obtained like those shown in Figure 1 [2, 8]. At very low sliding speeds the coefficient of friction is large, even exceeding unity. During sticking, when the relative velocity is zero, the coefficient of friction can take any value up to this limiting value. As sliding speed increases the coefficient of friction falls rapidly. Given results like these it is an easy step to suppose that during stick-slip oscillation, when the sliding speed Received 22 March 2002, accepted 11 October 2002.
c S. Hirzel Verlag EAA
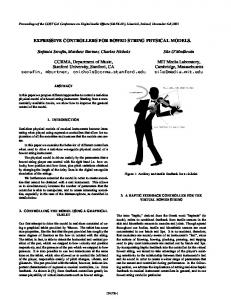
is varying rapidly, the friction force is still determined by the instantaneous value of sliding speed according to this steady-sliding relation. However, there is no obvious physical reason why this should be true, and recent measurements have shown decisively that in fact it is not true [8, 9]. If the force and sliding velocity are measured during stick-slip motion with rosin at the interface, the results can be plotted in the - plane. What is found is a hysteresis loop, a typical example being shown in Figure 2. The loop is traversed in the anticlockwise direction: at the end of sticking the friction force is high, and as sliding begins the force falls rapidly. During the return to sticking, though, the force remains quite low. No portion of this loop follows the steady-sliding relation of Figure 1, shown as a dashed line in Figure 2. It is immediately apparent that a different friction law is needed to account for this behaviour, and the main purpose of this paper is to explore alternative models. Based on a variety of evidence, it has been suggested [8] that the simplest plausible model is obtained by supposing that the friction force during sliding does not depend directly on variations of sliding speed, but rather on variations of temperature in the interfacial rosin layer. Rosin is a brittle solid at room temperature, but it softens and undergoes a glass transition at temperatures not much higher than this. This implies that the mechanical behaviour will be sensitive to temperature in the range just above normal ambient: in particular the shear strength of a rosin layer will decrease as temperature increases. The behaviour shown in Figure 1 is consistent with such a model: as will be seen in detail shortly, there is a monotonic relation between con-
355
ACTA ACUSTICA UNITED WITH ACUSTICA Vol. 89 (2003)
Woodhouse: Thermal friction model for bowing
1
1
Coefficient of friction µ
1.2
Coefficient of friction µ
1.2
0.8 0.6 0.4
0.6 0.4 0.2
0.2 0
0 0
0.05
0.1 0.15 0.2 Sliding velocity (m/s)
0.25
0.3
Figure 1. Coefficient of friction between rosin-coated PMMA surfaces, measured as a function of steady sliding speed, from reference [8]. Solid line: curve fit to the measured points, equation (2).
tact temperature and speed of steady sliding, which could account for the falling trend of the friction force with sliding speed. A thermal-based friction model of this kind immediately suggests a qualitative explanation of the hysteresis loop shown in Figure 2, because the dynamics of heat flow near the contact will inevitably produce a time lag between changes in sliding speed and changes in temperature. During sticking the contact region will cool by heat conduction into the bulk materials behind the contact. This will allow the shear strength of the interface, and hence the coefficient of friction, to reach a high value. Once sliding begins, the contact region will be heated by the work done against friction, the rosin layer will weaken, and the friction coefficient will fall. Now the dynamics of the vibrating system will mean that, in due course, the sliding speed reduces and sticking is re-established. If this process happens relatively quickly compared to the time scale of heat conduction, the contact region will still be warm and the friction force will remain low. During the ensuing period of sticking cooling occurs, allowing the cycle to repeat. A simple model based on this idea has been developed [8], and used with some success to reproduce the results of the measurements. These first measurements were made, not with a bowed string, but with a vibrator which behaved approximately like a harmonic oscillator. Subsequently, similar measurements have been made using a bowed string [9]. These showed qualitatively similar behaviour: in particular they showed similar hysteresis behaviour in the - plane. It is thus natural to use the proposed thermal model of rosin friction to carry out bowedstring simulations to see whether it is capable of reproducing features of the observations more successfully than the old “friction curve model”. That is the task of this paper. Although now known to be wrong in some respects, the friction-curve model has been remarkably successful
356
0.8
-0.15
-0.1
-0.05 0 Slider velocity (m/s)
0.05
Figure 2. Solid line: coefficient of friction between rosin-coated surfaces, one of PMMA and one of wood, as a function of sliding velocity during a stick-slip oscillation, from Reference [8]. The hysteresis loop is traversed in an anticlockwise direction. The “loops” during the near-vertical “sticking” portion of the curve are an artefact of the instrumentation, as described in Reference [8]. Dashed line: the steady-sliding relation of Figure 1.
in describing, at least qualitatively, many observed aspects of bowed- string behaviour. Two particular successes can be highlighted. First is the prediction of the region of parameter space within which the desired “Helmholtz motion” of the string is possible: this region was famously represented in diagrammatic form by Schelleng [1]. Second is the explanation of how the period of a Helmholtz motion can increase above the natural period of the string’s motion when the bow force is high, the so-called “flattening effect” [3, 10]. The calculations underlying both these predictions, of the minimum and maximum bow force for the Helmholtz motion and of the flattening effect, are explicitly built around the friction-curve model. It is not immediately obvious that the new thermal model of friction will reproduce either prediction. In particular, Schumacher [11] has pointed out that the thermal model may not be compatible with some observed details of the flattening effect. Both phenomena will be explored using simulation studies in this paper, and the predictions of the thermal model and friction-curve model compared. The long-term goal of this research is to construct a physically-based model of the bowed string, capable of predicting transient behaviour which agrees quantitatively with experimental measurements over a wide range of bowing gestures of musical interest. If this could be achieved, it would justify the use of simulation studies to answer “design” questions: how is the “playability” of a string on a given instrument influenced by the constructional details of the string, bow, bridge and instrument body, and also by the details of the player’s bowing gesture? Preliminary studies along these lines have given an idea of how such questions might be approached [6, 7, 12, 13], but all have used the old friction-curve model
Woodhouse: Thermal friction model for bowing
A CTA ACUSTICA UNITED WITH ACUSTICA Vol. 89 (2003)
so that the detailed conclusions must be regarded with some scepticism.
2. The simulation model 2.1. The thermal friction model In the steady-sliding measurement which produced the data of Figure 1, the geometry of the contact was that of two crossed cylinders of perspex (PMMA, polymethyl methacrylate) loaded together to give an approximately circular contact area. One of the cylinders was stationary, while the other moved across it carrying a layer of rosin. This rosin would be at ambient temperature on entry to the contact zone. As it moves into the contact zone frictional energy will heat the surface of the rosin layer, probably sufficiently that it sticks to the fixed cylinder. There would then be a layer of some thickness within which shearing motion takes place. This might be a relatively thick layer within which the deformation is best described as viscous flow, or it might be a thin interfacial layer better described by visco-plastic yielding of rosin in a semi-solid state. It was shown [8] that a model based on the latter possibility produced a more satisfactory match to the results of stickslip measurements, and the same model will be used here. The temperature at the sliding contact can be calculated by modelling the heat generation and transfer in the material surrounding the interface. No attempt is made to take detailed account of the variations of temperature, layer thickness and material properties within the contact region: the objective at present is to use the simplest model which incorporates dependence on temperature rather than on sliding speed. It is hoped that any major qualitative differences from the old friction-curve model will show up even in such a simplified model. The model is therefore formulated in terms of a single, averaged “contact temperature”, , a circular contact area of radius and a uniform layer thickness . (The contact temperature is measured relative to ambient temperature.) The rate at which heat is generated at the contact is given by the product of the frictional force and the sliding velocity. This heat input to the contact volume is balanced by three effects: conduction into the two neighbouring solids, convection with the rosin as cold material flows into the contact region while heated material flows out, and absorption in the contact volume, changing its temperature. The first of these effects can be represented in terms of a suitable Green’s function for the heat-diffusion problem, while the other two have simple closed-form expressions within the approximations used. The resulting governing equation for the time-varying contact temperature, with the three terms on the right-hand side in the order just described, is
(1) where is the friction force, is the relative sliding speed, is the density of rosin and is the “effective” specific heat capacity of rosin, including any contribution from
change of state. Details of the Green’s function are given in reference [8]. This model is suitable for time-stepping simulation once the time derivative is represented as a forward difference, and it is easily incorporated into the type of bowed-string simulation described in earlier references [2, 3, 5, 14]. The first task for this model, needed for calibration purposes, is to simulate the conditions of the steady-sliding experiment. This gives the contact temperature as a function of sliding speed, and once that is known the results for friction force shown in Figure 1 can be converted into a function of temperature which will then be used in bowing simulations. The underlying assumption, central to this simplest version of a thermal model of friction, is that the coefficient of friction depends only on temperature, not on any other state variables. That is the model to be explored in this paper. A convenient curve-fit to the measured steady-sliding friction results of Figure 1, shown as the solid line, is the function (2) where is the coefficient of friction and is the relative sliding speed. Using best estimates of the contact conditions and thermal properties appropriate to the measurement, the result shown in Figure 3 is obtained: the friction force falls approximately linearly in the temperature range from ambient up to about 40 above that, then flattens out to a constant level. Note that all temperatures quoted throughout this work will be relative to ambient – to convert them to Celsius, add 20 . The radius of the contact region and the thickness of the deforming layer are both hard to determine with very great reliability for the conditions of the experimental measurements. The parameters used here, specified in the caption of Figure 3, were chosen to be within the range of plausibility for the steady-sliding measurement, and also to produce the change of friction behaviour in roughly the right temperature range to accord with other measurements of rosin behaviour [8]. Fortunately, the exact choice is not in the end very critical for later simulations using the model. It was found in the earlier study that when the model was used to predict stick-slip motion the results for oscillator motion did not depend very sensitively on the choice: the only thing which changes is the absolute temperature. Much the same has been found with the bowed-string simulations to be described shortly. The underlying reason seems to be that the system tends to adjust its spread of temperature fluctuations into the range where the friction is varying most sensitively: high friction gives strong heating, and the contact continues to warm up until this effect is compensated by the decrease of friction coefficient. This kind of “self-buffering”, in a more extreme form, has been used to explain the frictional properties of ice skates and skis [15]. The next stage is to adapt the model for the different contact conditions relevant to bowing a string. Two cases can be distinguished: bowing with a normal violin bow, and “bowing” with a rosin-coated rod, as in many ex-
357
ACTA ACUSTICA UNITED WITH ACUSTICA Vol. 89 (2003)
Woodhouse: Thermal friction model for bowing
1.2
Coefficient of friction µ
1 0.8 0.6 0.4 0.2 0 0
10
20
30 40 50 60 Temperature above ambient
70
80
Figure 3. Coefficient of friction as a function of contact temperature (in C above ambient) deduced from the data of Figure 1 using the thermal model described in the text assuming a normal force of 3 N, a contact radius of 0.5 mm, a deforming layer thickness of 10 m, and thermal properties for PMMA as listed under “bow” in Table I. Table I. Parameter values used in simulations.
Density (kg/m ) Specific heat capacity (J/kg K) Thermal conductivity (W/m K)
String
Bow
Rosin
3000 1000 1.4 2050
600 1680 0.2 450
1010 250 0.113 170
Active layer thickness ( m) Contact radius at 1 N normal load ( m) Bowing speed (m/s)
1 250 0.05
perimental studies [3, 4]. The real bow has a large number of contacts between the string and individual hairs of the bow, while the rod has a single contact more like the steady-sliding test, but with different geometry and (perhaps) thermal properties. This distinction may influence the variation of contact area with normal force. For the rod, contact at very low forces will presumably follow the Hertzian law, with area proportional to . But once contact pressure become high enough that the rosin layer deforms plastically then the growth of the contact area with force may slow down when the material of the rod comes close to direct contact with the string material after cutting through the rosin layer. The real bow, on the other hand, is likely to react to increasing normal force by bringing more hairs into contact. This is reminiscent of the well-studied behaviour of contacting asperities between rough surfaces [16]. The result is likely to be that the real area of contact is approximately proportional to normal force. This in turn would mean that frictional force would be proportional to normal force, “Amonton’s law”, and it would make sense to speak of a coefficient of friction. This may not be the case for the rod-string contact. This paper will concentrate on the simpler problem of bowing with a rod, giving a single contact patch with the
358
string. The reason is that even this simple model will produce a number of predictions which are amenable to experimental test. It is relatively easy to conduct well-controlled experiments for this case, and it is hoped that such experiments will allow the friction model to be thoroughly tested and, perhaps, modified. After that it would be possible to incorporate that model into the more complicated simulations appropriate to a real violin bow with a distributed contact and allowing for bow-hair dynamics [17, 18], and a further round of experiments would then be undertaken to test the new predictions. Purely for simplicity, the simulations here will assume that the contact area scales linearly with the normal force, despite the doubts expressed above. This allows the concept of “coefficient of friction” to be retained, and the results of Figure 3 to be used to calibrate the model. However, it is expected that this functional dependence will need to be modified when experimental data is available, and perhaps more extensive steady-sliding measurements with a range of normal loads will be necessary for calibration. For the rod/string contact, it is necessary to make informed guesses at the effective contact size and thickness of the deforming layer in the rosin. Also, the effective thermal properties of the “string” and “bow” material have to be estimated. If the rosin layer is thin and most of it is involved in the shear deformation, then the appropriate values might be those of the substrate materials. On the other hand, if only the top fraction of a thick rosin layer is involved in heat generation, the heat diffusion rates may be determined mainly by the properties of rosin. These thermal properties only enter via the Green’s function of equation (1), and it was shown earlier [8] that this depends only on the thermal parameter (3) where is the thermal conductivity, is the thermal diffusivity, is the specific heat capacity and is the density. Values of this parameter must be chosen for the two contacting surfaces. For the simulations to be run here, the system is envisaged as a rosin-coated rod of perspex (PMMA), bowing a string whose outer layer is metal but which is thermally shielded by a transferred layer of rosin. Values of all relevant material properties have been chosen to be representative of this situation: they are listed in Table I. The thermal properties of the shielded string are taken, somewhat arbitrarily, as the geometric mean of values for a typical steel and values for a typical polymer. Some of these values are quite uncertain, and it is expected that they may have to be adjusted in the light of experimental data when this becomes available. 2.2. The string model Modelling of the dynamic behaviour of the string is subject to fewer uncertainties than the friction model. All the simulation results in this paper are based on modelling the best-understood musical string, a “Dominant” cello D string. For this particular string a reasonably complete set
Woodhouse: Thermal friction model for bowing
150
Frequency/mode number
149
148
147
146
145
0
5
10 15 Mode number
20
25
0
5
10 15 Mode number
20
25
1000
800
Q factor
of calibration data is available, covering transverse vibration frequencies and damping factors, torsional frequencies and damping factors, and bending stiffness. No allowance is made here for the coupling of the string to modes of an instrument body, but this choice is made purely for simplicity: the necessary modification to the reflection behaviour at the cello bridge could be included straightforwardly, as illustrated by earlier simulations of the “wolf note” [2, 3]. The open D string of a cello is tuned to 147 Hz. Empirically, the transverse modes have, very approximately, constant factors for a wide range of overtones. There are significant variations, mainly resulting from the frequency-dependent input admittance of the instrument body: measured results for a string on a particular cello are given in Figure 4b. As already stated, such effects of the instrument body are ignored here. The transverse string damping is simulated using the constant- reflection function described in an earlier work [19], using the numerical value , a reasonable average of the observed behaviour. Bending stiffness is also allowed for, using the stiff-string reflection function described earlier [5, see Appendix]. Appropriate versions of this reflection function are applied to both portions of the string, on the “bridge” and “nut” sides of the bow. The measured value of bending stiffness for this string is Nm . The torsional wavespeed at nominal string tension has been measured at 1060 m/s, and the first few torsional modes of the string have been shown to have constant factors of approximately 45 [19]. A suitable version of the constantreflection function is used to simulate this behaviour. Finally, the transverse wave impedance is 0.55 Ns/m, and the torsional impedance (measured tangentially at the string’s surface) is 1.8 Ns/m. The position of the bowed point on the string is denoted, as usual, by the dimensionless quantity , the fractional distance of the “bow” from the bridge. Results will be shown for a wide range of values of , in order to plot “Schelleng diagrams”. This raises an issue not previously addressed, of how accurately the stiff-string reflection function works over such a wide range. This was tested by using a modified version of the bowing simulation program to generate the free impulse response of the string at different values, then analysing these as if they were measured data to establish the frequencies and damping factors of the first 25 modes. Results are plotted in Figure 4, for at the extremes of the range of interest. It is clear from Figure 4a that the results for frequencies are very little influenced by the value of , and that they match the measured values well, so that this particular aspect of the accuracy of simulation need cause no concern. The measured frequencies show some significant perturbations caused by coupling of the string to the instrument body. Figure 4b shows that the desired “constant- ” behaviour is only achieved to rather modest accuracy: low modes give values fairly close to the intended value 500, but for higher modes the -factor decreases. Also, the value varies significantly with the value of . This is a result of the inherent limitations of the method when trying
A CTA ACUSTICA UNITED WITH ACUSTICA Vol. 89 (2003)
600
400
200
0
Figure 4. (a) Frequency normalised by mode number for the first 25 transverse modes of a Dominant cello D string as measured (plot symbols ‘o’) and as given by the string model described in the text for (‘+’) and (‘x’). (b) Corresponding data for the -factors of the same string modes. In both plots, every 5th symbol ‘x’ is missing because the corresponding mode has a node at this value of .
to simulate such a relatively high , and also of the filter which must be applied to the stiff-string reflection function, as described earlier [5] – throughout this work, an 8th-order Butterworth filter with cutoff at 0.4 times the Nyquist frequency was used. However, given the scatter of the measurements (arising from coupling to the cello body vibration), the results seem sufficiently accurate for the present purpose. For the lower -value of the torsional modes a much more accurate result is given by the simulation, as was shown in reference [19]. It should be noted that mode frequencies and -factors are not necessarily the best way to assess the accuracy of the various reflection functions used here. The bow-string interaction is sensitive to details of the temporal behaviour, which are only represented rather indirectly in the modal description. However, it is reassuring to note that direct observations of the pluck response of a string [9] show excellent agreement with the temporal details of an equivalent simulation using the stiff-string reflection function.
359
ACTA ACUSTICA UNITED WITH ACUSTICA Vol. 89 (2003)
Woodhouse: Thermal friction model for bowing
2.3. Bowed string simulation The complete simulation model can now be assembled. At each time step, several convolution integrals are performed. One is to calculate the current contact temperature using equation (1), from which the current value of limiting friction force can be deduced using the curve of Figure 3. Four convolutions with reflection functions give the amplitudes of the transverse and torsional waves incoming to the contact point from the two sides. These four are added together to give , the total incident velocity. Finally, the new values of velocity of the string at the contact point, and of friction force , are deduced from the fact that they satisfy simultaneously the two equations (4) and (5) where and are the impedances of the string to transverse and torsional waves respectively, is the normal is the temperature-dependent fricbow force and tion coefficient plotted in Figure 3. (If contact area were not assumed to scale linearly with normal force, equation (5) would be modified to reflect the alternative scaling assumed.) These equations are solved by the “Friedlander construction” [20], as illustrated in Figure 5. Notice that, whatever the value of , there is a unique and welldefined intersection of the stepped line representing equation (5) and the sloping line representing equation (4). This will lie on one of the horizontal portions of the friction relation during slipping, or on the vertical portion during sticking. There is no need for any numerical tricks to round off the vertical sticking portion of the curve, as was necessary in the simulations of the earlier oscillator model [8]. Once and have been found, the new outgoing amplitudes of transverse and torsional waves can be calculated in the usual way [2, 3, 14]. The process then repeats for the next time step. A first example of the output from this simulation program is shown in Figure 6. This shows the last two periodlengths after a simulation of length 0.4 s (i.e. 59 periodlengths at the nominal 147 Hz), the string having started at rest. It is reassuring to see that the new friction model has produced a version of the familiar Helmholtz motion (see e.g. [1, 2]), characterised by a single episode of slipping per cycle (shown by the waveform of surface velocity in Figure 6a) and an outgoing velocity wave which is a sawtooth wave (see Figure 6b). In fact, as will be shown later, the set of parameters chosen here place this run in the middle of the normal playing range in parameter space. Figure 6c shows the temperature variation at the contact associated with the vibration. The temperature varies during each cycle in the range 17–31 above ambient, a range which is broadly compatible with direct measurements of temperature rise during bowing reported by Pickering [21]. Finally, Figure 6d shows the path traced in the -
360
f µ(Τ) Ν
v
O
vb
vh −µ(Τ) Ν
Figure 5. The “Friedlander construction” for finding the values of and at a given time step as the intersection of two lines (shown ringed).
plane by the results. A hysteresis loop is clearly visible, traversed in the anticlockwise direction as expected from the earlier qualitative account of the time delay inherent in the thermal model, and as seen in measured results [9]. Notice that the effective coefficient of friction gets no higher than 0.77, much lower than the limiting coefficient of sticking friction from the steady measurement of Figure 1, because the contact temperature never falls below 17 above ambient. This value is similar to that shown in Figure 2. Also similar to that figure, no part of the hysteresis loops follows the steady-sliding curve, shown dashed. For comparison, Figure 7 shows the results of a simulation using the identical string model and bowing parameters, but using the friction-curve model in place of the thermal model. The assumed friction curve is the curve-fit to the measured results, equation (2). This model also predicts a Helmholtz motion under the assumed conditions, but the waveform details are quite different: the edges of the velocity pulse during slipping are steeper, and the amplitude of “Schelleng ripples” [1, 4] visible in the outgoing velocity waveform (Figure 7b) is larger than with the thermal model. The - plane (Figure 7c) this time shows all points lying on the assumed friction curve, as expected. The “missing” portion of the friction curve, at low sliding speeds, corresponds to the portion which is leapfrogged by the jumps resulting from the Friedlander construction [3, 20]. This case exhibits a high level of frictional hysteresis, indicated by the two sloping lines added to the plotted points. The fact that the left-hand line crosses the slipping portion of the friction curve near the highest slipping velocity for this motion shows that the case studied has a parameter set making it very close to the Schelleng maximum bow force. This issue will be explored further in section 4, when the reason for choosing this particular pair of waveforms for a comparison between the two friction models will be explained. Before proceeding any further with simulations, the question of convergence and choice of time step must be addressed. Numerical experiments have been made, varying the time step over a wide range for both friction models. The conclusion is that the thermal model is much more
Woodhouse: Thermal friction model for bowing
A CTA ACUSTICA UNITED WITH ACUSTICA Vol. 89 (2003)
32
0
30
Temperature above ambient (°C)
0.1
Velocity (m/s)
-0.1 -0.2 -0.3 -0.4 -0.5
(a)
26 24 22 20 18
-0.6 -0.7
28
0
2
4
6 8 Time (ms)
10
12
16 0
(c)
0.6
Coefficient of friction µ
Velocity to bridge (m/s)
6 8 Time (ms)
10
12
0.8
0.4 0.3 0.2 0.1
0.7 0.6 0.5 0.4
0 -0.1
4
0.9
0.5
(b)
2
0.3
0
2
4
6 8 Time (ms)
10
12
(d)
-0.6
-0.5
-0.4 -0.3 -0.2 Velocity (m/s)
-0.1
0
0.1
Figure 6. Helmholtz motion simulated using the thermal friction model as described in the text. (a) String velocity at the bowed point; (b) outgoing velocity wave towards the bridge; (c) contact temperature variation (in degrees above ambient); (d) force/velocity plane, together with the steady-sliding friction curve of Figure 1 (dashed line). This transient corresponds to the (10,10) point of Figure 9a, indexed from the lower left-hand corner.
“benign” than the friction-curve model, an important fact which will manifest itself in a number of ways later in this paper. For the parameter values used here, it was found that a time step of 20 s was sufficiently short to give wellconverged results for the thermal model. For the frictioncurve model matters are more complicated. As explained in earlier work [12], when the normal force is high enough to provoke hysteretic jumps in the friction force the predictions can exhibit sensitive dependence on initial conditions, and on noise from rounding errors. This means that no time step is short enough to guarantee convergence in every case. Experiments reveal that a time step of 5 s is short enough that the qualitative results are predicted robustly, even though individual transient details are not necessarily captured correctly. These two values of time step, for the respective models, are used throughout this paper. Figure 8 shows some examples of other waveforms simulated with the thermal model. All are qualitatively familiar, from observations and from earlier simulations, suggesting that the thermal model gives predictions which are at least generically plausible. In each case, waveforms of outgoing velocity are plotted. This waveform is propor-
tional to the transverse force exerted on the instrument bridge, which is significant because this is the waveform most readily measured in an experiment, using a piezoelectric force sensor built into the string’s termination. Figure 8a shows a “double-slipping” waveform, characteristic of a normal force somewhat too low to sustain Helmholtz motion and associated with what is described by violinists as “surface sound”. The waveform is periodic, but has two slips per cycle rather than one as in the Helmholtz motion, signalled by the two abrupt downward steps in the waveform. At even lower normal force, the number of slips per cycle increases, until at a sufficiently low normal force sticking no longer occurs at all. Below this force the state of steady slipping becomes stable, and the initial motion from the switch-on bowing transient simply decays away with time. When the normal force is too high for the Helmholtz motion, one of two things generally happens. The model may predict non-periodic “raucous” motion (not illustrated), or it may predict periodic (or nearly-periodic) motion with a period much longer than the natural period of the string. Such motions have been dubbed “anoma-
361
ACTA ACUSTICA UNITED WITH ACUSTICA Vol. 89 (2003)
Woodhouse: Thermal friction model for bowing
0.1 0
Velocity (m/s)
-0.1 -0.2 -0.3 -0.4 -0.5 -0.6 -0.7 -0.8
(a)
0
2
4
6 8 Time (ms)
10
12
(c)
0.6 0.5
Velocity to bridge (m/s)
0.4 0.3 0.2 0.1 0 -0.1 -0.2 -0.3
(b)
0
2
4
6 8 Time (ms)
10
12
lous low frequencies” or ALFs [11, 22, 23]. An example is shown in Figure 8b: in this case the period is approximately three times the natural string period (note the different time scale in this figure). These ALFs are occasionally used for deliberate musical effect, by sufficiently accomplished players (e.g. [24]). Finally, it can sometimes happen that, under conditions when a Helmholtz motion might have been expected, a periodic motion different from those shown so far arises at (or near) the string’s natural period. These “higher types” were analysed and classified by Raman in a monumental work early in the last century [25]. Higher types arise most often when the bowing position is not close to the end of the string, i.e. when is not small. A particularly common type was analysed by Lawergren [26], and dubbed by him “S motion”. A simulated example is shown in Figure 8c.
3. Schelleng diagrams For a more thorough and systematic comparison of the two friction models, it is necessary to compare the predictions over a range of parameter space rather than simply looking at individual cases. Various subsets of bowing parameter space have been examined in the past by systematic simulation [6, 7, 12, 13], but these have all concerned details of
362
Figure 7. Helmholtz motion simulated using the friction-curve model using identical parameters to Figure 6. (a) String velocity at the bowed point; (b) outgoing velocity wave towards the bridge; (c) force/velocity plane, together with lines indicating the jumps arising from the Friedlander construction. This transient corresponds to the (10,10) point of Figure 10a.
transient bowing gestures. For the present purpose, to examine whether and when the thermal model gives qualitatively different predictions from the friction-curve model, a simpler and better-understood parameter subspace seems appropriate: the Schelleng diagram. Schelleng [1] calculated formulae for the maximum and minimum bow forces between which the Helmholtz motion of the string is possible, and plotted the results in the plane of force against bowing position . Schelleng’s calculations, and their extensions to more realistic string models [6], are based explicitly on the friction-curve model, and it is natural to ask whether the thermal model predicts similar behaviour. Accordingly, the simulation programs were run for a grid of points covering the relevant range of this parameter plane. The points were chosen to be logarithmically spaced on both axes, since the standard Schelleng diagram is plotted on log-log axes to bring out the different powerlaw relations: Schelleng’s minimum bow force is proportional to , while his maximum force is proportional to . To present results in a useful form, it is also necessary to classify what kind of motion the string is executing at the end of the period of simulation. This was done in an earlier study [12], but because it is intended in later work to compare these computations with corresponding experimental results it is desirable that the classification method should use only information which could be mea-
Velocity to bridge (m/s)
Woodhouse: Thermal friction model for bowing
A CTA ACUSTICA UNITED WITH ACUSTICA Vol. 89 (2003)
0.25
0.35
0.2
0.3
Velocity to bridge (m/s)
0.15 0.1 0.05 0
0.25 0.2 0.15 0.1 0.05
-0.05 -0.1
0 0
5
10 Time (ms)
(a)
15
20
-0.05
(c)
0
5
10 Time (ms)
15
20
3
Velocity to bridge (m/s)
2.5 2 1.5 1 0.5 0 -0.5
(b)
0
5
10
15
20 25 Time (ms)
30
35
40
sured from a real string, so a new approach has been developed which is based entirely on analysis of the waveform of outgoing velocity towards the bridge, as plotted in Figures 6b, 7b and 8. The algorithm is described in the Appendix. Results are shown in Figure 9a, for the thermal friction model and a string which starts at rest (i.e. initialised with zero displacement and velocity everywhere). Different plotted symbols denote the outcome identified by the classification algorithm (see caption for details). For the cases which eventually produced Helmholtz motion, the transient length was also computed, and is plotted in Figure 9b. Corresponding results computed with the friction-curve model using otherwise identical parameters are shown in Figure 10. It is immediately apparent on comparing these figures that the region of Helmholtz motion is significantly bigger for the thermal model – in other words, this model gives a bowed string which is “easier to play” than that using the friction-curve model. The transient lengths tell a similar story. For each value of , the thermal model shows long transients at the lowest force for which Helmholtz motion occurs, as double-slipping motion takes a long time to give way to Helmholtz motion. For almost all values the transients shorten rapidly and consistently as force increases. By contrast, the friction-curve model shows gen-
Figure 8. Examples of other waveforms simulated using the thermal friction model: (a) double-slipping motion; (b) “anomalous low frequency” (note different time scale); (c) “S motion”. These waveforms correspond to the following points in Figure 9a: (a) (10,8); (b) (10,18); (c) (18,11).
erally longer transients and a more irregular pattern which would presumably appear confusingly inconsistent to a player. Figure 9a and, less clearly, Figure 10a show traces of the wedge-shaped region of Helmholtz motion predicted by Schelleng. Lines are superimposed on the figures, indicating the predicted slopes of and for the two force limits. The vertical positions of these lines are arbitrarily chosen, near the observed boundaries of Helmholtz motion in Figure 9a, so that only the slopes of the two lines should be regarded as having any theoretical significance. The immediate impression given by a comparison of the two figures is that Schelleng’s pattern appears more clearly with the thermal model, where it has no theoretical support as yet, than with the friction-curve model for which Schelleng’s limits were derived. The differences between the two models are sufficiently striking that it should prove straightforward to determine which is better supported by experimental results. Such a comparison would provide a key piece of evidence for the rival frictional theories. One possible reason for the non-appearance of Schelleng’s predicted boundary lines with the friction-curve model is that Schelleng’s limits apply to the maximum and minimum forces between which it is possible to maintain a Helmholtz motion, not necessarily to the region in which a particular bowing transient leads to a Helmholtz motion
363
Woodhouse: Thermal friction model for bowing
10
10
3
3
Normal force (N)
Normal force (N)
ACTA ACUSTICA UNITED WITH ACUSTICA Vol. 89 (2003)
1 0.3 0.1 0.03
0.3 0.1 0.03
0.01
0.01
0.03
0.05 0.07 0.1 Bow position β
0.2
0.3 0.4
Figure 9. (a) Schelleng diagram computed using the thermal friction model. Plotted symbols indicate the oscillation regime found at the end of each simulation run (of length 0.4 s): Helmholtz motion (square); multiple-slipping motion (x); decaying motion (dot); aperiodic motion (+); ALF (triangle); Raman “higher type” (star). Solid lines indicate slopes of and in this log-log plot, corresponding to Schelleng’s predictions for maximum and minimum bow force respectively. (b) Transient length (in number of periods) for the runs which showed Helmholtz motion in (a). The transients range up to 53 period-lengths.
rather than some other motion. To get closer to this situation, another set of simulations was carried out in which the program was initialised with a “typical” Helmholtz motion rather than started from rest. The results are shown in Figure 11 (for the thermal model) and Figure 12 (for the friction-curve model). There are many more squares in the plots, as one would expect. However, neither friction model gives results which match the slopes of Schelleng’s lines more accurately. A similar pattern of change is seen with both friction models. For a given the maximum force for Helmholtz motion is almost unchanged, but the minimum force is consistently lower, especially at larger values of . The result is that if one tries to fit a straight line to the minimum force threshold the slope is much steeper than the predicted , whereas in Figures 9
0.02
0.03
0.05 0.07 0.1 Bow position β
0.2
0.3 0.4
Figure 10. Results corresponding to Figure 9, obtained using the friction-curve model with otherwise identical parameters. The transients range up to 53 period-lengths.
10 3
Normal force (N)
0.02
364
1
1 0.3 0.1 0.03 0.01 0.02
0.03
0.05 0.07 0.1 Bow position β
0.2
0.3 0.4
Figure 11. Schelleng plot for the thermal model, as Figure 9a except that the string was initialised with Helmholtz motion rather than starting from rest.
and 10 the apparent slope was less steep than the prediction.
A CTA ACUSTICA UNITED WITH ACUSTICA Vol. 89 (2003)
10
10
3
3
Normal force (N)
Normal force (N)
Woodhouse: Thermal friction model for bowing
1 0.3 0.1
1 0.3 0.1
0.03
0.03
0.01
0.01 0.02
0.03
0.05 0.07 0.1 Bow position β
0.2
0.3 0.4
0.02
0.03
0.05 0.07 0.1 Bow position β
0.2
0.3 0.4
Figure 12. Schelleng plot for the friction-curve model, as Figure 10a except that the string was initialised with Helmholtz motion rather than starting from rest.
Figure 13. Schelleng plot for the thermal model, as Figure 9a except that the torsional impedance of the string was increased by a factor of to inhibit torsional motion.
The probable explanation for the steep slope lies in the “ripples” exhibited by waveforms such as Figures 6b and 7b. The ideal Helmholtz motion, which was the basis of Schelleng’s calculation, would show a perfect sawtooth wave. Schelleng’s argument started from this ideal waveform, and used it to calculate the fluctuating force at the bow during the sticking phase of the motion. When that additional force reaches the limit of sticking friction the Helmholtz motion must break down, and this is the minimum force criterion. In practice, ripples produce an extra component of force fluctuation, and will thus tend to raise the minimum force. Ripples tend to be bigger when the normal force is higher, because they are excited by the fluctuations of friction force during stick-slip transitions and these fluctuations can be expected to increase with higher normal force. Ripples are thus likely to have a bigger influence on minimum bow force at low . If the force threshold is raised above Schelleng’s prediction by an amount which increases at small , the result will be a steeper slope in the Schelleng diagram, as seen in the computed results. It is less obvious why Schelleng’s limits seem to work so well, at least qualitatively, for the thermal friction model. The argument outlined above for minimum bow force is still relevant, but to apply it quantitatively to this case it would be necessary to calculate the temperature variation from the assumed Helmholtz motion in order to find the appropriate value of limiting friction. This calculation has no simple closed-form answer, mainly because of the awkward form of the Green’s function , especially for the moving surface, the “bow”. Of course the temperature could be computed numerically from an assumed Helmholtz motion, but this would amount to a very similar calculation to what has already been done to determine the Schelleng diagram, and would not add much theoretical insight. Similar comments apply to the maximum bow force. Schelleng’s argument is based on the fact
that the Helmholtz corner, when it arrives at the bow at the end of the sticking phase, needs to produce a sufficient force jump to ensure a transition from sticking to slipping. For a given string model, and assuming ideal Helmholtz motion, the force jump from the Helmholtz corner will not depend on the friction model. However, to deduce a maximum bow force requires knowledge of the value of limiting friction, and hence again the temperature. The main conclusion from these results is that the thermal model produces more “benign” behaviour than the friction-curve model. This, in a sense, continues a progression in bowed-string modelling. The earliest model was the Raman/Friedlander model, which used the frictioncurve model together with an assumption of an ideal string. This produced results which were very badly behaved: indeed, Friedlander proved [20] that within this model all periodic solutions were unstable. When the rounded-corner model was introduced, first by Cremer [27] for periodic solutions and then by McIntyre and Woodhouse [3] for transients, much better behaviour was found, and stable periodic solutions were possible. However, the behaviour was still quite “twitchy”. The thermal friction model produces a further improvement in this regard. Empirically, the computed results seem to show that the phase lag inherent in the thermal model produces qualitatively similar effects to using broader reflection functions (i.e. more high-frequency damping). In particular, varying the thermal parameter makes changes in the waveforms which are very reminiscent of varying the amount of “corner-rounding”. Even without quantitative experimental data, the smoother behaviour of the thermal model seems more in accord with the experiences of string players. One significant manifestation of this smoother behaviour concerns the influence of torsional string motion. When the early bowed-string models, described above, were first used, they frequently exhibited instability. This
365
ACTA ACUSTICA UNITED WITH ACUSTICA Vol. 89 (2003)
4. Flattening Another bowed-string phenomenon which might provide useful evidence to discriminate between the different friction models is the “flattening effect”. If a Helmholtz motion is established on a string and the bow force is slowly increased, then the pitch of the note generally falls. An unacceptable level of this flattening can be a factor which in practice governs the highest useful bow force. The flattening effect was first explained in terms of the friction-curve model [3], as being a result of the hysteresis loop arising from the asymmetric jumps associated with the Friedlander construction, as indicated in Figure 7c. This explanation suggests that at low bow forces there might be no flattening, and that there will be a threshold of bow force when jumps in the - plane first become necessary, leading to a threshold bow force for flattening. It is not immediately apparent that the thermal model will predict flattening at all – there are no jumps in this model. However, it has already been seen that the model leads to a hysteresis loop in the - plane. Boutillon [10] has described an approach to the flattening effect based on harmonic balance, which suggests that any such hysteresis loop traversed in the anticlockwise sense should lead to flattening. This expectation is borne out by simulation results. The solid line in Figure 15 shows the per-
366
0.3
Velocity to bridge (m/s)
0.25 0.2 0.15 0.1 0.05 0
0
0.02
0.04 0.06 Time (s)
0.08
Figure 14. Initial transients of outgoing velocity waves towards the bridge (proportional to “bridge force”) for a matching pair of points from Figures 9a (solid line) and 13 (dashed line): the chosen point is the (10,10) point in the grid plotted in the Schelleng diagrams. The string started from rest in both cases.
6 5
Period extension (%)
was traced to the fact that subharmonic perturbations to the Helmholtz motion could grow [4]. To stop this, it was very important in those models to include the effect of torsional motion of the string, because torsional modes have much higher damping than transverse modes and this extra dissipation was sufficient to stabilise the subharmonics. This important role of torsion has become so familiar that it came as a surprise to find that the thermal friction model did not need this extra stabilising influence, and in fact displays behaviour remarkably insensitive to torsion [28]. Figure 13 shows results which are directly comparable to Figure 9a, the only difference being that the torsional impedance of the string has been increased by a factor of to inhibit any torsional motion. A few symbols are different between the two plots, but in general the similarity is very striking. Even more striking, perhaps, is the comparison shown in Figure 14. This shows the first few period-lengths of a typical transient (described in detail in the figure caption), with and without the modified torsional impedance. It is immediately apparent that torsion is having a very tiny influence here, and indeed one would guess that the entire significance of torsion in this model may be less than that of other factors which have been omitted or treated in an approximate manner. (Note that the waveform plotted in this figure is outgoing velocity, proportional to “bridge force”. States of sticking and slipping cannot be distinguished clearly from this waveform, apart from the initial sticking interval leading to the steep “ramp” seen in the first few ms of the plot. Helmholtz motion would appear as a sawtooth waveform, hints of which are beginning to form by the right-hand edge of the plot.)
Woodhouse: Thermal friction model for bowing
4 3 2 1 0 -1
0
0.2
0.4
0.6 0.8 1 Normal force (N)
1.2
1.4
1.6
Figure 15. Percentage flattening for Helmholtz motion as a function of normal force, for the thermal friction model (solid line), the thermal model with torsion inhibited (dashed line), and the friction-curve model (circles). In each case (the 10th value in the Schelleng grids).
centage period extension relative to the nominal period, for Helmholtz motion at (the 10th value in the Schelleng diagram grids). The period rises linearly with normal force until it has increased by about 2% (one third of a semitone), at which time large fluctuations occur as the vibration regime changes, signalling that the maximum bow force has been reached. The pattern contrasts with the corresponding results for the friction-curve model, plotted as circles. Here, a threshold for flattening is seen, followed by rather rapid period increase until, for this model, maximum bow force is reached at a much lower force around 0.7 N. Notice that the two models have very similar levels of flattening at the last of the plotted circles: these are
Woodhouse: Thermal friction model for bowing
the two cases whose waveforms were shown in Figures 6 and 7, since they give a close and fair comparison between the two friction models. It is now clear that Figure 7 did indeed show a case very close to maximum bow force for the friction-curve model, as remarked earlier. The dashed line in Figure 15 shows the results for the thermal model with torsion suppressed by increasing the torsional impedance as in Figures 13, 14. This follows the solid line closely at low normal forces, then jumps abruptly away at a force around 0.9 N. The lines than remain parallel until they both start large fluctuations at the same force around 1.4 N. This unexpected effect of torsion is not fully understood. What seems to be happening where the jump occurs is that the waveforms with and without torsion are just sufficiently different that for the no-torsion case a small second slip occurs. This changes the pattern of temperature variation, and hence the shape of the hysteresis loop, and hence the degree of flattening. The main conclusion from Figure 15 is that the two friction models predict quite different patterns of flattening, of a kind which one might hope to be able to discriminate clearly in experimental results. Such data as already exists [11, 29] shows that, at least sometimes, behaviour is seen which exhibits a threshold more reminiscent of the friction-curve model than the thermal model. However, none of that data is strictly comparable with the predictions here because the string properties were different. What is needed is a careful experiment using a Dominant cello string, bowed by a rosin-coated rod, which can be compared directly with the predictions here.
5. Conclusions The context of this paper is that models of the bowed string are reaching a sufficiently sophisticated state that it has become sensible to seek detailed, quantitative agreement with experiment. The target for the next few years is to make a definitive comparison between theory and experiment, and then fine-tune the theoretical model so that transient details are convincingly reproduced under a wide range of conditions. It will then be justified to return to the kind of systematic simulations described earlier [6, 7, 12], to do design studies in the computer to assess the influence on “playability” of various parameters governing the behaviour of the string, bow, bridge and body. It has been argued here that the main uncertainty may at present lie in the theoretical description of the frictional force which drives the string. A model in which the friction force is determined by temperature in the contact zone, rather than by sliding speed, has been proposed on the basis of experimental work on a different stick-slip oscillator. Results have been presented here to show some important consequences of this model when it is used in bowed-string simulations. Two particular aspects of behaviour have been highlighted, both of which lend themselves to relatively straightforward experimental test. One aspect is the “Schelleng diagram”, the region of steadybowing parameter space within which a Helmholtz motion
A CTA ACUSTICA UNITED WITH ACUSTICA Vol. 89 (2003)
is possible. The other is the “flattening effect”, whereby the pitch of a bowed note may fall as normal bow force is increased. The main effect noted in all the results presented here is that the thermal friction model is more “benign” than the older friction-curve model. Waveforms depend less critically on the precise details of the bowing gesture assumed, the Helmholtz motion of the string is elicited more readily, and the initial transients tend to be shorter and more regular in structure. As a related phenomenon, the computer simulations gave well-converged results with a longer time step than was necessary with the friction-curve model. Torsional motion of the string, necessary in earlier models to produce stable periodic motion with realistic parameter values, has only a very minor influence on behaviour with the new friction model. At least at a qualitative level, this more benign behaviour seems to match the experience of string players better than the more “jumpy” behaviour of the friction-curve model. Whether this impression will be vindicated by quantitative comparisons with experiments remains to be seen. The results on flattening are more equivocal. The thermal model predicts flattening which increases linearly with normal force. The friction-curve model predicts a threshold of force before flattening begins, and there is some evidence that this might be a more accurate description of what happens in practice. If that suspicion is confirmed by more careful measurements, it may point to a need for a friction model which combines elements of both models presented here. The evidence that temperature plays a role in the friction of rosin is very strong, but that does not mean that sliding speed may not also have a direct influence. Rosin is, after all, a viscoelastic mixture of organic materials, and it would not be surprising if it exhibited rate-dependent behaviour.
Appendix Automatic classification of vibration regimes The various vibration regimes described in section 2.3, some of which were illustrated in Figures 6, 7 and 8, can be classified with reasonable reliability by a method based only on the waveform of velocity sent out from the bowed point, which is proportional to the waveform of transverse force exerted by the string on the bridge of the instrument. The first stage of the process is to calculate the autocorrelation function of a few cycles of the waveform. This allows three cases to be distinguished: near-periodic waveforms at or close to the nominal period of the string, nearperiodic waveforms at other periods (e.g. ALFs), and nonperiodic waveforms (“raucous” motion). The next stage is further classification of the first group of these waveforms. If the motion has very small amplitude, decaying motion is diagnosed. Otherwise, the Helmholtz motion and the other periodic regimes to be identified are all characterised by sawtooth-like waveforms. The “ramp” slope of the sawtooth is determined kinematically by the bow speed and the bow position ,
367
ACTA ACUSTICA UNITED WITH ACUSTICA Vol. 89 (2003)
as was first realised by Raman [25]. Knowing these parameters, therefore, this slope can be subtracted, leaving a staircase-like waveform. The effect of Schelleng ripples can be reduced by applying a moving average with period times the string’s period. A histogram of the sampled values of this staircase is now calculated, which will exhibit peaks corresponding to each ramp section of the original waveform. If the result shows just one large peak per period, the motion is classified as Helmholtz. Other patterns of peaks can be analysed to reveal multiple-slipping motion, S-motion, and other Raman “higher types”. The exact details involve choosing threshold values for the various tests, and these were fine-tuned by trial and error. The resulting algorithm seems to perform robustly on all unambiguous waveforms. Naturally the result is less robust near boundaries between different regimes, where it is often not clear what the “correct” classification should be. For the purposes of the Schelleng diagram calculations this classification routine was executed every five nominal period-lengths, so that the length of the transient before Helmholtz motion became established could be found where appropriate. Acknowledgement It is a pleasure to acknowledge useful discussions on this material with Ken Johnson, Bob Schumacher, Julius Smith, Stefania Serafin and Paul Galluzzo. References [1] J. C. Schelleng: The bowed string and the player. J. Acoust. Soc. Am. 53 (1973) 26–41. [2] L. Cremer: The physics of the violin. MIT Press, Cambridge MA, 1985. [3] M. E. McIntyre, J. Woodhouse: Fundamentals of bowedstring dynamics. Acustica 43 (1979) 93–108. [4] M. E. McIntyre, R. T. Schumacher, J. Woodhouse: Aperiodicity in bowed-string motion. Acustica 49 (1981) 13–32. [5] J. Woodhouse: On the playability of violins. Part I: reflection functions. Acustica 78 (1993) 125–136. [6] J. Woodhouse: On the playability of violins. Part II: minimum bow force and transients. Acustica 78 (1993) 137– 153. [7] R. T. Schumacher, J. Woodhouse: Computer modelling of violin playing. Contemporary Physics 36 (1995) 79–92. [8] J. H. Smith, J. Woodhouse: The tribology of rosin. J. Mech. Phys. Solids 48 (2000) 1633–1681. [9] J. Woodhouse, R. T. Schumacher, S. Garoff: Reconstruction of bowing point friction force in a bowed string. J. Acoust. Soc. Amer. 108 (2000) 357–368.
368
Woodhouse: Thermal friction model for bowing
[10] X. Boutillon: Analytical investigation of the flattening effect. J. Acoust. Soc. Amer. 90 (1991) 754–763. [11] R. T. Schumacher: Measurements of some parameters of bowing. J. Acoust. Soc. Am. 96 (1994) 1985–1998. [12] R. T. Schumacher, J. Woodhouse: The transient behaviour of models of bowed-string motion. Chaos 5 (1995) 509– 523. [13] A. Askenfelt, K. Guettler: The bouncing bow: an experimental study. J. Catgut Acoust. Soc. 3 (1998) 3–8. [14] M. E. McIntyre, R. T. Schumacher, J. Woodhouse: On the oscillations of musical instruments. J. Acoust. Soc. Amer. 74 (1983) 1325–1345. [15] F. P. Bowden, T. P. Hughes: The mechanism of sliding on ice and snow. Proc. Royal Soc. London A 172 (1939) 290– 298. [16] K. L. Johnson: Contact mechanics. Cambridge University Press, 1985. See Chapter 13. [17] R. Pitteroff, J. Woodhouse: Mechanics of the contact area between a violin bow and a string, Part II: simulating the bowed string. Acustica - acta acustica 84 (1998) 744–757. [18] R. Pitteroff, J. Woodhouse: Mechanics of the contact area between a violin bow and a string, Part III: parameter dependence. Acustica - acta acustica 84 (1998) 929–946. [19] J. Woodhouse, A. R. Loach: The torsional behaviour of cello strings. Acustica - acta acustica 85 (1999) 734–740. [20] F. G. Friedlander: On the oscillations of the bowed string. Proc. Cambridge Phil. Soc. 49 (1953) 516–530. [21] N. C. Pickering: The bowed string. Ameron, Mattituck, New York, 1992. [22] R. J. Hanson, A. J. Schneider, F. W. Halgedahl: Anomalous low-pitched tones from a bowed violin string. J. Catgut Acoust. Soc. 2 (1994) 1–7. [23] K. Guettler: Wave analysis of a string bowed to anomalous low frequencies. J. Catgut Acoust. Soc. 2 (1994) 8–14. [24] M. Kimura: How to produce subharmonics on the violin. J. New Music Research 28 (1999) 178–184. [25] C. V. Raman: On the mechanical theory of vibrations of bowed strings. Indian Assoc. Cult. Sci. Bull. 15 (1918) 1– 158. [26] B. Lawergren: On the motion of bowed violin strings. Acustica 44 (1980) 194–206. [27] L. Cremer: Der Einfluß des Bogendrucks auf die selbsterregten Schwingungen der gestrichenen Saite. Acustica 30 (1974) 119. [28] S. Serafin, J. O. Smith, J. Woodhouse: An investigation of the impact of torsion waves and friction characteristics on the playability of virtual bowed strings. Proc. 1999 IEEE Workshop on Applications of Signal processing to Audio and Acoustics, IEEE Press, New York, 1999, W99/1–4. [29] C.-A. Faure, X. Boutillon: Determination et etude experimentale de la frequence d’oscillation d’une corde frott´ee. C. R. Acad. Sci. Paris 317 (1993) 1377–1382.