Dr. Gregory S. ParneU received his Ph.D. in Engineering-Economic Systems from ...... Wiggins, James, John Klotz, Richard Meeks, Barbara Wooten, John ...
United States Military Academy West Point, New York 10996
BRAC 2005 Implementation Decision Support Tools OPERATIONS RESEARCH CENTER OF EXCELLENCE TECHNICAL REPORT No. DSE-TR-0409 DTIC #: ADA426284 Lead Analyst Major John Harris, M.S. Assistant Professor of Systems Engineering Senior Investigator
Gregory S. Parnell, Ph.D. Professor of Systems Engineering Department of Systems Engineering Analysts Cadet Sean Gardner Cadet Brent Hoops Cadet Randy Mounts Approved by
Colonel William K. Klimack, Ph.D. Associate Professor and Acting Head, Department of Systems Engineering
August 2004 The Operations Research Center of Excellence is supported by the Assistant secretary of the Army (Financial Management & Comptroller)
Distribution A: Approved for public release; distribution is unlimited.
BEST AVAILABLE COPY
BRAC 2005 IMPLEMENTATION DECISION SUPPORT TOOLS Lead Analyst Major John Harris, M.S. Assistant Professor of Systems Engineering, Department of Systems Engineering
Senior Investigator Gregory S. Pamell, Ph.D. Professor of Systems Engineering, Department of Systems Engineering Analysts Cadet Sean Gardner Cadet Brent Hoops Cadet Randy Mounts OPERATIONS RESEARCH CENTER OF EXCELLENCE TECHNICAL REPORT No. DSE-TR-0409 DTIC #: ADAXXXXX
Approved by Colonel Bill Klimack, Ph.D. Associate Professor and Acting Head, Department of Systems Engineering
August 2004 The Operations Research Center of Excellence is supported by the Assistant Secretary of the Army (Financial Management & Comptroller) This Research was sponsored by the Deputy Assistant Security of the Army (Infrastructure Analysis)
Distribution A; Approved for public release; distribution is unlimited.
11
Abstract This project was a West Point Department of Systems Engineering cadet research project sponsored by the Deputy Assistant Secretary of the Army for Installation Analysis who, in coordination with the Assistant Chief of Staff for Installation Management's Base Realignment and Closure (BRAC) Division, requested three related but distinct project tasks. The first task was a historical analysis of the Army's BRAC implementation performance. The second task was to develop a "BRAC Installation Complexity Matrix" which would be used by BRAC 2005 implementation planners to assess the difficulty at each installation of realigning missions, closing the base, and disposing of excess property. The third task was to develop BRAC 2005 implementation performance measures. To perform these tasks, we reviewed reports on past BRAC rounds, interviewed key stakeholders, and collected data on past BRAC rounds. Based on our research, we identified possible hypotheses about factors that influence installation complexity. We then analyzed the data using descriptive statistics and regression analysis to determine the validity of the hypotheses. We used our research to develop a BRAC 2005 Installation Complexity Model. The model was implemented as a decision support tool using Logical Decisions software and Excel. Based on our research and historical data analysis, we also developed performance measures to assess BRAC 2005 implementation progress.
ni
About the Author(s) Major John K. Harris received his M.S. in Systems Engmeering from the University of Virginia. He holds a B.S. from the United States Military Academy in Operations Research. He is currently an Assistant Professor at the United States Military Academy at West Point. He teaches system simulation, computer aided systems engineering, and engineering economics.
Dr. Gregory S. ParneU received his Ph.D. in Engineering-Economic Systems from Stanford University. He is the Class of 1950 Chair of Advanced Technology and a Professor of Systems Engineering at the United States Military Academy at West Point. He teaches decision analysis, systems design, multiple objective decision analysis, engineering economics, and operations research. His research and consultmg involves decision and risk analysis, systems engineering analyses, resource allocation, research and development (R & D) portfolio analysis, infrastructure analysis, and system architecture analysis.
Second Lieutenant Sean Gardner graduated from the United States Military Academy in May 2004 with a B.S. in Engineering Management. He was commissioned in the US Army as a Field Artillery Officer.
Second Lieutenant Brent Hoops graduated from the United States Military Academy in May 2004 with a B.S. in Engineering Management. He was commissioned in the US Army as a Field Artillery Officer.
Second Lieutenant Randy Mounts graduated from the United States Military Academy in May 2004 with a B.S. in Engineering Management. He was commissioned in the US Army as an Infantry Officer.
IV
Acknowledgements There were several individuals who significantly contributed to the success of this research project. Our project sponsor, Dr. Craig College, Deputy Assistant Secretary of the Army (Infrastructure Analysis), fiinded the project and provided valuable insight and guidance. Additionally, COL Douglas Baker, Dkector of the Army BRAC Office and COL Bill Tarantino from the Total Army Basing Study (TABS) Group ensured we had access to key stakeholders and the resources necessary to complete the project. Mr. Rob Dow (from the TABs office), Mr. Bill O'Donnell (from the BRAC Office), and Mr. Joe Matore (from the TABS office) were instrumental in providing background on BRAC implementation issues, identifying key experts, providing BRAC historical data, and arranging our interviews and panel discussions. In addition, they provided timely, valuable feedback on project deliverables and wise counsel on project management.
Disclaimer The views expressed in this paper are those of the authors and do not reflect the official policy or position of the United States Military Academy, the United States Army, the Department of Defense, or the U. S. Government.
V
Executive Summary Introduction This project was a West Point Department of Systems Engineering cadet research project sponsored by the Deputy Assistant Secretary of the Army (Infrastructure Analysis) and supported by the Assistant Chief of Staff for Installation Management's Base Realignment and Closure (BRAC) Division. The Army has the identified two BRAC 2005 implementation goals: 1) close or realign 60% of BRAC 2005 installations within three years and 2) achieve disposition of 60% of BRAC excess property within six years. The purpose of the project was to provide management tools to help the Army meet these goals. Project Tasks The project involved three related tasks. The first task was the analysis of Army historical BRAC implementation performance. The second task was to develop a "BRAC Installation Complexity Matrix" which would help BRAC 2005 managers assess each installation's challenges to realign missions, close the base, and dispose of excess property. The third task was to recommend BRAC 2005 implementation performance measures. Methodology To complete these tasks, we collected data on past BRAC rounds through research, stakeholder interviews, and meetings. We identified possible hypotheses and analyzed the hypotheses using statistical analysis. With our research data, we used affmity diagramming to group the complexity factors and organize the performance measures. We developed the BRAC Installation Complexity Model using multiple objective decision analysis. The final model was implemented using Excel software. The performance measures were organized using four categories: responsibility, planning, implementation, and completion. Data Analysis The data analysis phase provided an assessment of the Army's historical BRAC record and allowed us to analyze the effects of individual factors on BRAC implementation performance. In past BRAC rounds, the Army did not meet the BRAC 2005 strategic goals for installation closure and property disposition. Small data sets, non-continuous data, and qualitative factors limited our ability to statistically identify the complexity drivers. However, we used our data analysis insights to develop the complexity model.
VI
BRAC 2005 Installation Complexity Model RAND'
originated the idea of a BRAC installation complexity matrix. Using characteristics that assess
the challenges of realigning units, closing installations, and disposing of excess property; the matrix would assess the relative difficulty for each installation and provide an overall assessment of the BRAC 2005 implementation challenges. Using our affinity diagramming process, we identified 38 measures and aggregated these to 10 measures. Using these measures, our model used multiple objective decision analysis to evaluate installation complexity on a scale of 0 to 10. We tested our model using three BRAC installations that have been closed. BRAC 2005 Performance Measures We used our research, an engineering management approach, and affinity diagramming to develop BRAC 2005 performance measures that can be used to manage implementation. We grouped the performance measures into four categories: responsibility, planning, implementation, and completion. Conclusion If accepted by key stakeholders, the complexity matrix and performance measures can provide usefiil management tools to help meet Army senior leaders meet their BRAC 2005 implementation goals. The BRAC 2005 Implementation Complexity Model can be a useful tool for BRAC implementation planning and resource allocation decisions. In addition, the performance measures can help Army leaders achieve BRAC implementation success. Areas for Further Research We identified three major areas for future work: •
BRAC Historical Data Analysis. Although there was not sufficient data for standard statistical analysis, there may be other approaches that might we useful; for example Bayesian Networks and Neural Networks. The success of these methods may depend on the ability to capture important nonquantitative data including political, organization, and personnel factors.
•
BRAC 2005 Implementation Complexity Model. The aggregated BRAC Installation Complexity Model should be vetted with key Army stakeholders. The complexity functions and weights need to be
' Lachman, Beth, Ellen M. Pint, and David Oaks, Lessons Learnedfrom the Implementation ofPrevious BRAC Decisions, RAND, Arroyo Center, AB-745-A, August 2003.
vn
refined. The model should be tested and validated using BRAC 1995 data. Once completed, the model will be ready for use in summer 2005. •
BRAC 2005 Implementation Performance Measures. The performance measures should also be reviewed with key Army stakeholders. In addition, the performance measures should be implemented with four perspectives: installation. Installation Management Agency region, Major Command, and Army.
A web-based system would be ideal to allow managers to view BRAC implementation
progress at any of the four perspectives.
Vlll
Table of Contents ABSTRACT
"I
ABOUT THE AUTHOR(S)
IV
ACKNOWLEDGEMENTS
V
DISCLAIMER
V
EXECUTIVE SUMMARY
VI
TABLE OF CONTENTS
IX
LIST OF FIGURES
12
LIST OF TABLES
12
CHAPTER 1 INTRODUCTION
1
1.1 Backsround
^
1.2 Tool to Assess BRACInstallation Complexity
2
1.3 Need for Better BRA C Imvlementation Performance Measures
3
1.4 Study Tasks
3
1.5 Study Methodolosv 1.6 Overview
^
CHAPTER 2 RESEARCH AND INTERVIEW FINDINGS
6
2.1 Research 2.2 Stakeholder Interviews
"
CHAPTER 3 BRAC HISTORICAL DATA ANALYSIS
9
3.1 Historical Installation Closure and Disposition Times
9
3.2 Historical Acreage Disposal Time
1"
IX
3.3 Identification of Closure and Disposal Time Drivers
12
CHAPTER 4: AFFINITY DIAGRAMMING
14
4.1 Introduction to Affinity Diasrammins
I'*
4.2 Illustrative Example Affinity Diaeram
14
CHAPTER 5: STRATEGIC OBJECTIVES
16
5.1 Current Strategic Objectives
1"
5.2 New Stratesic Objectives
1"
CHAPTER 6: BRAC 2005 INSTALLATION COMPLEXITY MODEL
18
6.1 Need for An Installation Complexity Model
18
6.2 Complexity Model Uses
^°
6.3 Complexity Model Development
^^
6.4 Initial Complexity Model with Thirty Eight Measures
19
6.5 Asereeated Complexity Model with Ten Measures
20
CHAPTER 7: BRAC 2005 PERFORMANCE MEASURES
25
7.1 Introduction
^^
7.2 An Eneineerine Management Approach
^^
7.3 Performance Measures
^"
CHAPTERS: CONCLUSIONS
27
8.1 Conclusions
27
8.2 Areas for Future Work
^^
BIBLIOGRAPHY.
29
APPENDIX A: LIST OF ABBREVIATIONS
30
APPENDIX B: STAKEHOLDER INTERVIEWS
31
APPENDIX C: AFFINITY DIAGRAMMING
32
APPENDIX D: COMPLEXITY FUNCTIONS FOR THE AGGREGATED INSTALLATION COMPLEXITY MODEL
35
DISTRIBUTION LIST
37
REPORT DOCUMENTATION PAGE - SF298
38
XI
List of Figures Figure 1.1 BRAC acres disposed (Actual vs. Hypothetical Expected Performance)
2
Figure 1.2 BRAC 2005 Implementation Methodology
5
Figure 3.1 Comparative Raw Acreage Transfer (each round normalized to year zero)
11
Figure 3.2 Comparative Percent Acreage Transfer (each round normalized to year zero)
11
Figure 4.1 Strategic Objectives.
14
Figure 4.2 Affinity Diagram for Objective 4.1.1.
15
Figure 5.1 Modified Strategic Plan
16
Figure 6.1. Complexity Function for MEC
21
Figure 6.2. Complexity Function for Mission Type
22
Figure 6.3. Complete Aggregated Complexity Model.
23
Figure 6.4: Summary Model of the Aggregated Complexity Model.
24
List of Tables Table 1.1 RAND Complexity Matrix Example
3
Table 3.1 Number and Percent of Installations Closed and Disposed in each BRAC round
9
Table 3.2 Total time to dispose of 60% and 80% of the total acres in each round
10
Table 3.3 Prior BRAC Rounds Data Analysis Hypotheses and Findings
12
Table 7.1 Performance Measure and Strategic Obiective Crosswalk.
26
xu
Chapter 1 Introduction 1.1 Background Major Base Realignment and Closure (BRAC) studies are requested by the Secretary of Defense and legislated by Congress. BRAC Commissions are appointed by the President to review DoD recommendations and make their own recommendations to Congress and the President. Prior BRAC rounds were in 1988, 1991, 1993, and 1995. At the request of the Secretary of Defense, Congress enacted legislation in 2002 for a BRAC round to be completed in 2005. Accordmg to current plans, the BRAC Commission will be appointed in the spring of 2005 and the new BRAC list will be signed into law by the President in May 2005. The primary reason to realign units and close installations is the potential economic savings. "Closure" of an installation means that all the active Army missions at an installation have been transferred (realigned) or deactivated. "Disposal" or "disposition" refers to transferring the ownership of an installation's facilities and land to a public or a private organization. The realignment of units from an installation and disposition of an Army installation is a difficuh task, especially if many units are involved and significant environmental cleanup is required. If the units are realigned to another installation, the Army must ensure the units maintain maximum combat readiness while caring for the well being of its soldiers and their famiHes. Compounding the challenge is the impact of installation closure on civihan employees and local communities. Also, the property will be transferred to federal organizations, state organizations, non-profit organization, or civiUan developers. These organizations have different concerns and timelines. The quicker the Army completes the tasks associated with closing an installation and disposing of the property, the sooner the Army receives the projected economic benefits. In prior BRAC rounds, the Army's BRAC Office (BRACO) tasked with the mission of closing and disposing of Army installations initially used the time to close an installation as the main performance measure. BRACO later used acreage as a more meanmgfiil performance measure. For instance, if an installation has a total of 100,000 acres and all but one acre is disposed, then the installation has not completed disposition. However, more than 99% of the total acres of that installation are disposed and most of the economic savings have been realized. Thus acreage has become the primary performance measure. BRAC 2005 involves new challenges and a greater expectation for improved implementation performance. The BRAC 2005 Strategic Plan developed by The Army Basing Study (TABS) office for Dr. Craig College, Deputy
1
Assistant Secretary of the Army (Infrastructure Analyses), set a goal to 1) close or realign 60% of BRAC 2005 installations within three years or less and 2) achieve disposition of 60% of BRAC excess property within six years or less.
.♦■
.♦:
BRAC historical data shows lengthy disposal times.
5
10
15
20
25
Time in Years after BRAC Decision
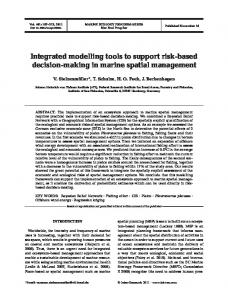
Figure 1.1 BRAC acres disposed (Actual vs. Hypothetical Expected Performance) Figure 1.1 shows the challenges that the Army faces in the next round of BRAC. The line on the right shows the cumulative history of all the previous BRAC rounds. On average, it has taken the Army over 8.2 years to dispose of 60% of the total acreage from the prior BRAC rounds. Approximately 10% of the total acres have not been disposed. The line on the left shows a hypothetical expected performance that would support the Army's acreage disposal objectives for BRAC 2005.
To meet the Army's goals. Army leaders must understand the unique
challenges of each installation and develop a management plan to achieve BRAC implementation success.
1,2 Tool to Assess BRAC Installation Complexity The idea of an installation complexity matrix originated from Beth Lachman, Ellen M. Pint, and David Oaks in their Rand Report on Lessons Learned from the Implementation of Previous BRAC Decisions (Lachman et al., 2003). The BRAC installation complexity matrix would help decision makers assess the degree of difficulty in realigning units, closing bases, and disposing of installations. Table 1.1 shows an example of RAND's matrix. The left hand side of the matrix Ust installation characteristics that would make BRAC implementation more difficult.
To illustrate the concept, Rand assessed two installations from pervious BRAC rounds. Cameron Station was an example of an installation that was relative easy to close and transfer to commercial developers. Fort Ord is an example of an installation that has been extremely challenging. This evaluation could be made by a qualitative method (colors), quantitative method (numerical scales) or combined method (quantitative scales summarized into qualitative categories). Key characteristics of Cameron Station the installation Number of jurisdictions that Low base touches? Economic dependence of Low the community on the installation? IVHIitar/ and ^^^^^^^^^^^^^^^H populations? ^^^^^^^^^^^^^^^| Diverse stakeholders with Low interest In the propert/? Amount of UXO on the 1 ow (None) property? Environmental issues?
Low
Number of acres?
Low
Fort Ord
IHHHA Medium Low
Table 1.1 RAND Complexity Matrix Example
1,3 Needfor Better BRAC Implementation Performance Measures Many Army leaders realized that acreage transferred was a lagging indicator of BRAC implementation success. They believed that BRAC 2005 implementation leaders must identify performance measures that would help Army leader's better focus on the key milestones that would enable timely realignment of units and disposal of Army facilities and installations.
1,4 Study Tasks This project was a West Pomt Department of Systems Engineering cadet research project sponsored by the Deputy Assistant Secretary of the Army (Infrastructure Analysis) and supported by the Assistant Chief of Staff for Installation Management's Base Realignment and Closure (BRAC) Division. Our study sponsors requested that we accomplish three interrelated tasks. •
Analyze the BRAC Closure Performance Record. This first task involved analyzing the historical data on realignment, closure, and disposition. The purpose of the analysis was to provide insights to support the following two tasks.
•
Develop an Installation Complexity Matrix. This task involved identifying the characteristics that determine an installation's closure and disposition difficulty and then develop an installation complexity model to help assess how difficult each mstallation will be to close and dispose.
•
Recommend BRAC 2005 Implementation Performance Measures.
The fmal task involved
reviewing historical BRAC performance measures and the current TABS strategic plan and then developing measures for BRAC implementation progress.
1.5 Study Methodology In order to accomplish the three tasks, we used the methodology shown in Figure 1.2. In Step 1, we collected data and conducted research on past BRAC rounds. We also interviewed several key Army leaders and had panel meetings with personnel involved in previous BRAC rounds. Step 2 was the data analysis to assess past BRAC implementation performance. To the extent possible, we used statistical analysis techniques. In Step 3, we used affinity diagramming to identify strategic objectives and to organize the data for the installation complexity model and the BRAC implementation performance measures.
Step 4 was the refinement of the new BRAC 2005
implementation strategic objectives based on our affinity diagramming. Step 5 was the development of installation complexity models. After research and interviews were conducted and the drivers of prior BRAC rounds were assessed, then the installation complexity model could be developed to provide a management tool that would help decision makers assess the degree of difficulty m mission realignment, installation closure, and property disposal. Finally, Step 6 was the identification of BRAC 2005 Implementation Performance Measures. An engineering management approach was taken to develop the measures. Performance measures were developed in four areas: 1) Responsibility, 2) Planning, 3) Implementation, and 4) Completion.
1. Perform Research and Interview Stakeholders.
2. Analyze BRAC Historical Data.
3. Perform Affinity diagramming^
• Data collection • Hypotheses • Descriptive Statistics • Regression Analysis
• Strategic objectives • Installation complexity factors • Implementation performance measures
4. Develop New Strategic Objectives.
5. Develop Installation Complexity Matrix
6. Identify BRAC 2005 Performance Measures
• Strategic Plan for the Army Implementation of BRAC 2005 • Research
• Most significant factors to assess installation realignment, closure, and disposition challenges
• Reports • Interviews • Meetings
' Responsibility ' Planning ' Implementation ' Completion
Figure 1.2 BRAC 2005 Implementation Project Methodology
1.6 Overview Chapter 2 provides the research and interview findings. Chapter 3 provides the analysis of BRAC historical data. Chapter 4 describes the affinity diagramming process we used to organize our research data and interview findings. Chapter 5 describes the revised BRAC 2005 strategic objectives. Chapter 6 describes the development of the BRAC 2005 Installation Complexity Model. Chapter 7 describes the development of the BRAC 2005 Implementation Performance Measures. Finally, Chapter 8 summarizes our conclusions and identifies areas for future research.
Chapter 2 Research and Interview Findings
We began our project by conducting research on the BRAC lessons learned and interviewing key stakeholders and subject matter experts.
2.1 Research Our research included previous BRAC implementation reports by the Army and studies by RAND and the General Accounting Office. The documents we reviewed are included in the bibliography. One of the key reports we reviewed, was the RAND report that suggested the Installation Complexity Matrix concept (Lachman et al., 2003).
2.2 Stakeholder Interviews We interviewed senior Army leaders, BRAC implementation project managers, and subject matter experts on the BRAC process to include envu-onmental and legal experts. Additionally, we interviewed several analysts who have written BRAC analysis reports. Appendix B provides a list of the stakeholder interviews and meetings. Dr. Craig College, DASA (lA), identified the two BRAC 2005 implementation goals: 1) close or realign 60% of BRAC 2005 installations within three years or less and 2) achieve disposition of 60% of BRAC excess property within six years or less. Dr. College recognized that the Army needed a management tool to assess installation complexity to help manage resources to meet the two challenging goals. The Deputy Assistant Chief of Staff for Installation Management (ACSIM) and the Director of the BRAC Office (BRACO) noted that acreage has been the dominant performance measure for assessing BRAC implementation performance. They also stated that in BRAC 2005 the law has changed so the Army would be able to sell the property to local developers instead of executing no cost conveyance which is essentially giving the land away. However, the Army remains responsible for the bills for environmental clean-up. Additionally, the Deputy ACSIM pointed out that the number of communities involved in the Local Reuse Authorities (LRA) was an indicator of the
difficulty in transferring the bases' assets and land. A LRA is local organization consisting of local businesses and citizens who are responsible for planning a base's reuse (ICMA, 2002). Fort Ord is an example of an installation with a long disposition time and the LRA participants had very differing views on how the community should use the land. The ensuing debate added to the time to dispose of the installation. Finally, the some senior leaders noted that to realign a mission and dispose of an mstallation costs money, but the Army has not always provided sufficient funding to expedite installation cleanup and disposal. Mr. Patrick O'Brien, Director, Office of the Secretary of Defense (OSD) Office of Economic Adjustment emphasized that all branches of service need to do a better job of involving the communities surrounding an installation selected for realignment and closure. An interview with Beth Lachman and David Oaks, analysts fi-om the RAND Corporation, proved to be very beneficial. They suggested looking at the number of congressional districts, the percentage of employment that an installation provides, and consider the resale values of the installation as well as the resale value of key assets on the installation are all critical factors. They additionally pointed out that installations that aheady have privatized utilities may be easier to resell since it aheady meets state utility requirements. They also suggested the use of a complexity matrix to use as a decision tool to show the challenges in realigning and closing an installation. Since BRAG implementation requires many unique skills and knowledge, BRAC project managers identified a need for project managers training, a "BRAC 101." Additionally, they stated that one of the key success factors was a stable transition team. They also suggested one common document to identify the environmental characterization of an installation. They believed that the BRAC project managers should assist the formation of a LRA and development of their reuse plan. It is important to note that the BRAC Office does not control how quickly a LRA is established or how quickly it develops its reuse plan; but, these two steps are on the critical path in the disposition process. The BRAC Office environmental panel supported the environmental characterization issues brought up by the project managers. They emphasized the difficulties of disposing an installation viith Munitions of Explosive Concern (MEC), formerly referred to as Unexploded Ordnance (UXO), as well as ground water plumes, per chlorate, arsenic and other contaminants. Several of the people we interviewed, the project mangers panel, and the environmental subject matter experts panel all emphasized that 1) an early environmental baseline characterization was essential to develop the clean up
plan, 2) early funds need to be programmed and budgeted, and 3) an early start to Military Construction were critical to the success in implementing realignment, closure, and disposition. From our interviews, we learned that many stakeholders and subject matter experts had strong beliefs about the major factors that increase acreage disposition times. For instance, many people stated four installation factors tend to increase disposal time: 1) larger size (more acres), 2) larger facilities (square footage), 3) presence of MEC, and 4) low property values. Our next task was to determine if the data from the four previous BRAC rounds supported these beliefs.
Chapter 3 BRAC Historical Data Analysis In this chapter, we discuss Step 2 of our methodology, the analysis of the data we obtained by data collection, research, and stakeholder interviews. Our objective in this chapter was twofold. First, we assessed past BRAC implementation performance relative to the BRAC 2005 goals. Second, we attempted to determine what drivers most influenced the historical performance of BRAC implementation. Our raw data was mostly provided by the Army's BRAC office and the primary analysis tool was statistical analysis using Microsoft Excel. In die end, we were able to gain an accurate assessment of past performance, but were not able to statistically identify specific factors that significantly drove the implementation process.
3,1 Historical Installation Closure and Disposition Times We used two key objectives from the BRAC 2005 Strategic Plan (discussed in our interview with Dr. College) as our measures for evaluating past rounds. These objectives are to close 60% of the identified installations within 3 years and to dispose of 60% of BRAC excess property within 6 years of BRAC mitiation. In Table 3.1 below, we see that these objectives have never been met in past BRAC rounds. The shortest time to dispose an installation was just over 3 years, while the average time to dispose an installation is 8.2 years. Furthermore, there are installations from the 1988 BRAC list that are still not closed resulting in a disposition time of over 15 years and counting. The BRAC 2005 implementation team faces a difficult challenge. They must fmd ways to significantly improve past performance.
BRAC Round 1988 1991 1993 1995 Cunnulative
# Closed 3 #of yrs Installations 28 6 4 33 71
0 0 1 11 12
% of Total Inst. In Round 0% 0% 25% 33% 17%
Median Closure Time 5.59 3.80 4.10 3.45 4.38
% of Total # Inst. In Disposed Round 6vrs. 43% 12 50% 3 50% 2 52% 17 48% 34
Table 3.1 Number and Percent of Installations Closed and Disposed in each BRAC round
3,2 Historical Acreage Disposal Time As we noted in Section 1.1, past measures of disposition progress have been primarily based upon the number of excess acres disposed. Table 3.2 shows a summary by round of the time to achieve 60% and 80% disposal of the excess acreage. Again, the goal is to achieve 60% disposition within 6 years. As the third column indicates, this has only happened once, and that was for a round that had very few acres. The last column shows that the Pareto effect applies to acreage disposition. For each round, nearly, if not more than, half of the acreage in each round may be disposed by disposing of one or two installations. Therefore, as a general rule, the BRAC 2005 implementation team should focus on disposing of the largest parcels of land first. However, it is important to remember that the real focus should always be on the dollar savings potential. BRAC Round
Total BRAC Acreage
Years to 60% Disposal
Years to 80% Disposal
Drivers
1988
87,997
12
12
Jefferson Proving Ground (50,385)
1991
34,535
15
23
Two Ft. Ord parcels (14,773)
1993
2,664
6
6
Tooele Army Depot (1,621)
1995
133,750
8
8
Sierra Army Depot (57,633)
Table 3.2 Total Time to Dispose Of 60% And 80% of the Total Acres in Each Round Figure 3.1 shows the historical (and projected) disposition data per BRAC round in excess acres while Figure 3.2 shows the disposition data in percentage of excess acres for each of the rounds over time. The data is normalized to time zero based on the date the BRAC round was signed into law. The arrows show the current year. Any data points beyond the arrows shown for each round represent planned disposals. Therefore, that data is still subject to change. The BRAC 1995 story would be much different without the significant acreage disposal in year 8 (2003). It is interesting to note that senior DoD and Army leadership focus on acreage transfer "inspired" the significant progress in 2003.
10
Comparative Acreage Transfer (Raw) 140CX)0
■H-it
X-*:
120000 "§ 100000 o & 5 80000
-1988 -1991 O^"-^*
^ Q
60000
m
40000
-1993 -1995
•-*=
20000
15
30
25
20
Time in Years
Figure 3.1 Comparative Raw Acreage Transfers (Each Round Normalized To Year Zero) Comparative Acreage Transfer (Percent) 100.00% 90.00%
oa 80.00% 0) 5 70.00%
ith nrore i^jare focta^ lake longer Starting Square Footage lnuenlcr/\«. A*jal OoELreTirre iDdoee. Seme EPA Regans have lon^r dspoGilion times Seme MoCOtV/b have Icn^r dsposrtontimts. The type of inslallaticn iprpBias Ihe dosue time.
EPARegonvs.
A*BI
Dspositicn Time
MOCOMCVnervs. Actuei Dspositicn Time Installaticn Type vs
AAJBI
OosLreTlnne
R^ = Q14(rerTrMng one outlier R^ = Q32) R^=Q12 R= = Q87 R= = QUJULi (ocnpletEd dspoeitons) 1^ = Q07 (vrcng hypott-easO No suflident correlation. TRADCX; Dspositionstake less lime 1han ethers. A*riristrative and indjslnal installations take kncer to dose ihan odTers Fanrily hn ring locations are qjcker to dspose tiTsn cfrier installation Ivpes
The type of installaticn irrpactsihe dspositicn Installation Type \«. A^ILBI Dspositicn Time time. The type of installation inrpactstiTe actual oostiD Installaticn Type vs. ASjal CosttoDspositior IVbjor iraining areas cost mere for dsposal. dsposiUon SLper1lrdsitBshaveH(/)Br etviiuiiBildl ocets Fk pnrfijTd Site vs Aaual ErvircrrraTtal Cost Si rRTflrd sites incLT mere erMrcrmerrlal costs. assoaalEd vvilh them
Table 3.3 Prior BRAC Rounds Data Analysis Hypotheses and Findings
12
We were not able to identify single factors that drove closure time, disposition time, or total costs. The only significant correlations were the expected correlation of MEC acres to clean-up cost (R = 0.87) and of MEC acreage to disposition time (R^ = 0.32). We also did a multivariable regression analysis with the data, but found this difficuh because of holes in the data and small sample sizes. Many qualitative factors could be represented in the multiple regression models such as EPA region, number of congressional districts near the installation, or Major Command (MACOM) owner. For example, we suspect that having spent munitions of explosive concern (MEC) present could easily combine with other factors to extend and compHcate costs and disposition time.
Of past
installations, however, only 12 actually had MEC present. Therefore, it is very difficuh to combine that data with another factor like the EPA region because then we only have 12 data points to spread across 10 EPA regions. Other political, organizational (e.g., availability of funds for BRAC implementation actions), and personnel factors are difficuh to categorize and may ultimately drive the BRAC implementation process. Therefore, we were not overly surprised to see only weak correlations based on statistical analysis. Our research and interviews showed that the BRAC implementation is very compHcated. There are qualitative factors such as personnel assignments, organizational structure, political, and local community impacts that may have had an impact on BRAC performance. We also found that each installation is very unique and any historical BRAC analysis should involve someone who is famiHar with the history of each individual installation. Based on our statistical data analysis conclusions, the idea of an installation complexity model that uses both qualitative and quantitative factors from our research, interviews, and data analysis to assess an installations level of difficulty to implement the BRAC decisions seems to be an appropriate management tool.
13
Chapter 4: Affinity Diagramming In this chapter, we discuss Step 3 of our methodology. We used affinity diagrams to identify the strategic objectives, group the complexity factors, and develop BRAC implementation performance measures.
4.1 Introduction to Affinity Diagramming An affinity diagram is a technique that collects large amounts of language data (ideas, opinions, issues) and organizes them into groupings based on their natural relationships. The affinity process is an excellent technique for a team of people to work creatively to identify new relationships^. It may be used in situations that are unknown or unexplored, or in circumstances that seem confusing or disorganized, such as when people with diverse experiences form a new team, or when members have incomplete knowledge of the area of analysis. In its simplest form, the affmity process can be used to group ideas of a few individuals generated by brainstorming. In a more complex form, the affinity process can be used to group ideas generated by thorough research and interview process that we have used for our project. In our application, we use affinity diagrams to develop the strategic objectives, the complexity factors, and the implementation performance measures.
4.2 Illustrative Example Affinity Diagram The data we obtained from our research (including the Strategic Plan), interviews, and data analysis was first grouped into five strategic objectives. Strategic Goal 4.1 Effective and Effidenf implementation of BI^C 2005 t.;V
.-'-
1
1
4.1.1 Maximize Army unit readiness during transfer
4.1.2 Reduce the time and cost for closure and riiRrvKitinn
"
.
4.1.3 Support joint actions
1
1
4.1.4 Support community reuse and reduce economic Impact
4.1.5 Sustain the well being of soldiers, civilians, and their families
Figure 4.1 Strategic Objectives.
"Affinity Diagrams", Module 4, The Tools of Total Quality, http://www.hq.navy.mil/RBA/text/tools.html
14
Next, we describe the affinity diagrams for the first objective, 4.1.1 Maximize Unit Readiness during Realignment. (The rest of the affinity diagrams are provided in Appendix C. Affinity Diagramming. Due to size, objective 4.1.2 is divided into 4.1.2 a. with environmental and 4.1.2 b. without environmental). We grouped the data in each objective into two categories: complexity factors and implementation performance measures.
The
complexity factors (light green) were then binned in to similar groupings. For example, the left hand side of Figure 4.1 shows one of the groupings - mission alignment complexity which has three complexity factors.
For the
perfonnance measures, we binned the measures into four groups: responsibility, planning, implementation and completion. We selected these bins since they reflect a logical time sequencing of the perfomiance measures. The orange measures are from the BRAC 2005 Strategic Plan. The light blue measures were obtained from our research. Strategic Goal 4.1 Effective and Efficient implDmcniaiion of BRAC 2005
4.1.1 fvlaxJmize Army unit readiness during transfer Performance Measures
hactors
Missions readiness performance measures
Missions realignment complexity Responsibility Typo of missions being realigned
Number of people being realigned
Planning
Establish MACOM, IMA, BRACO, OEA. RC. and ASA(l&E) responsibiltiea
1.5 Personnel realignment policies in place while continuing mission (30 Apr 05) 1,4 a ID RC installation specific needs and expectations (30 Sepi 05)
Privatized support functions
12 a Plans complete for phasing out base ops and support services (31 May 06) Implementation
Completion
Percent of mission realignments on schedule to complcic.
Percent of mission realignments complete.
Figure 4.2 Affinity Diagram for Objective 4.1.1.
15
Chapter 5: Strategic Objectives In this chapter, we discuss Step 4 of our methodology - developing strategic objectives. We begin by discussing the cun-ent BRAC 2005 Strategic Plan and then we describe the strategic objectives we developed using the affinity diagramming process described in the previous chapter.
5. / Current Strategic Objectives The objectives in the current strategic plan are shown in the Figure 5.1. The boxes in white are not in the strategic plan. We added them to show the strategic plan as a hierarchy of objectives. As we mentioned in the previous chapter, the boxes in orange were used in the affinity diagramming process.
4.1 Effective and Efficient imptementatJon of BRAC 2005
1.1 Planning to itnptementation transition for TABS office (31 May 05)
1.2 Plans and execution
1.2 a Plans complete for phasing out base ops and support services (31 May 06)
1.3 Effective implementation of joint sen/ice recommendations (31 Dec 05)
1.4 ID RC needs and process
1.4 a ID RC installation specific needs and expectations (30 Sept 05)
1.5 Personnelrealignment policies in place while continuing mission (30 Apr 05)
1.6 Reuse planning
1.6 b Establish process to work with communilies for reuse (30 Apr 05)
1.7 Process and criteria for welfare of all soldiers, civilians, and families during BRAC 2005 (30 Jun 05)
1.2 b 60% '05
closure or
1.4 b EstabUsh a process to accomplish RC objectives such that disruption of Army personnel is minimized {30 Sept 05)
realignment
w!U^in3years 1.2 c 60% '05 disposition within 6 years
1.6 c PSan for environmental clean-up (31 May 06)
1.6 a Plans for disposal options and strategies (31 Mar 05)
Figure 5.1 Modified Strategic Plan
5.2 New Strategic Objectives Figure 4.1 displayed the new strategic objectives that we developed using the affinity diagramming process. In this section we describe each of the objectives.
16
•
4.1.1 Maximize Army Unit Readiness During Transfer. This strategic objective focuses on maximizing mission readiness dxiring the realignment of an active (or reserve) unit from one post to another. With the current operations tempo of the Army, it is critical that each realigning unit be able to maintain imit readiness and have the ability to perform its mission, if called upon, during the transfer period.
•
4.1,2 Reduce the Time and Cost for Closure and Disposition. This strategic objective focuses on timely completion of the BRAG actions to enable the Army to obtain the projected savings as soon as possible. However, due to variety of reasons discussed previously, base closure and disposition is a time consuming and costly process. This objective includes the two major cost drivers: enviroimiental cleanup and unexploded ordnance disposal.
•
4.1.3 Support Joint Actions. This strategic objective is to be able to implement Army BRAC 2005 actions that support joint BRAC actions. This is a new element in BRAC 2005 that has not been a significant factor in previous rounds.
•
4.1.4 Support Community Reuse and Economic Impact. This strategic objective was emphasized by DoD's OEA. In our interview with Mr. 0'Brien^ he stressed the importance of community impact and stated it was imperative that services help the communities plan for community reuse of excess property to mitigate the impact of the BRAC actions on the local communities.
•
4.1.5 Sustain the WeU Being of Soldiers, Civilians and Their Families.
This strategic objective is
to maintain, if not enhance, the well being of the soldiers, civilians, and their families who are involved in the BRAC process. Next, we will discuss how we used the five strategic objectives and the complexity factors from our affinity diagramming exercise to develop the complexity model.
Mr. Patrick O'Brien, Director, DoD Office of Economic Analysis, Interview, 2 March 2004.
17
Chapter 6: BRAC 2005 Installation Complexity Model The idea for an installation complexity model was first identified by RAND. The RAND Complexity Matrix was described in section 1.2. This chapter describes our implementation of a BRAC 2005 Installation Complexity Model.
6A Need for an Installation Complexity Model Once DoD forwards the Army recommendations to the BRAC Commission's, the Army will need to assess the challenges to perform the BRAC actions and meet the Army closure and disposition goals. Depending on the number and types of installations impacted by BRAC, this may be a daunting task.
The BRAC installation
complexity matrix would help BRAC decision-makers assess the degree of difficulty in realigning units, closing bases, and disposing of installations.
6.2 Complexity Model Uses We have identified the following potential uses of the BRAC 2005 Complexity Model: •
improve senior leaders' understandings of the unique challenges of each installation,
•
provide senior leaders an overall assessment of the difficulty of BRAC 2005 implementation,
•
help senior leaders assign the most experienced or best-performing personnel to the most challenging
installations, •
provide senior leaders a basis for allocating existing resources across installations,
•
help explain the need for additional resources on extremely challenging installations, and
•
identify the need for traming programs for installations that have difficult challenges and
inexperienced BRAC implementation personnel. Until we know the number and types of installations on the BRAC Hst it is difficuh to predict which of tiiese uses will be the most important. Next, we discuss our mstallation complexity model development approach.
18
6.3 Complexity Model Development In order to develop the BRAC 2005 installation complexity model, we had to decide what measures would be used to evaluate the difficulty of BRAC actions.
We developed the measures from our research, interviews,
meetings, and data analysis. As described in Chapter 4, we performed affinity diagramming to group the potential measures from our research and interviews to identify the most important complexity measures. Our research effort focused on section 4.1 of the Strategic Plan for the Army Implementation of BRAC 2005: Effective and Efficient Implementation of BRAC 2005. After conducting our research, we developed a new set of strategic objectives (Figure 4.1) that we described in chapter 5. We used each of these five objectives to organize both the complexity measures and the implementation performance measures. This enabled us to group similar complexity measures and similar performance measures. At the conclusion of our affinity diagramming, we had developed thirty eight complexity measures. These ranged from the type of mission being realigned or closed to the quantity of lead-based paint at an installation.
6.4 Initial Complexity Model with Thirty Eight Measures We used multiple objective decision analysis to develop our complexity model (Kirkwood, 1997). We input all thirty eight measures into Logical Decisions. The thirty eight measures are listed in Appendix C. One of the Logical Decisions views is a measure scoring matrix (which is similar to RAND's complexity matrix but without colors) with installations on one dimension and complexity measures on the other. The matrix is filled in with the measure scores for each installation. Using Logical Decisions we developed a complexity function for each measure and assigned weights to each measure. The complexity fiinctions are value functions that map an installation's score into a complexity number. We scaled each complexity function from 0 (no complexity) to 10 (very complex). Using the additive complexity (value) model (complexity is the sum-product of the weight times the complexity of each measure), we can then provide an overall quantitative evaluation of installation complexity (0 to 10). Logical Decisions is a very useful tool because an analyst can compare a single measure from various installations, perform sensitivity analyses, and other analyses (e. g., Monte Carlo simulation) that can not be
19
obtained with a simple matrix. However, Logical Decisions is a more complex decision aid that requires more imderstanding of multiple objective decision analysis, which is a limiting factor.
6.5 Aggregated Complexity Model with Ten Measures Many of the thirty eight measures that we developed can be aggregated into fewer measures. In addition, some of the complexity measures are less important than others or have less variation between installations. The weight assigned a complexity measure depends on the importance of the measure and the variation between installations. Therefore, we were able to identify the broadest and most important measures and narrow the thirty eight down to ten. For example, we assumed that the presence of any of the ten contaminants will drive up the estimated environmental clean-up cost, so these ten measures would aggregate to one estimated envirormiental clean-up cost measure. While an expanded model using all 38 measures may be more thorough, the aggregated model is more understandable and serves our purposes well as a useful tool for BRAC implementation decision-makers. The ten measures are listed below under the appropriate strategic objective. In addition, we identify the units used for the complexity measures: 4.1.1 Maximize Army Unit Readiness 1. Type of Mission Realigned (constructed scale) 4.1.2 Reduce the Time and Cost for Closure and Disposition 2. Estimated Closure and Disposition Cost ($ milHons) 3. Acres to be Disposed (acres) 4. Appraised Land Value ($ millions) 5. Estimated Environmental Clean-up Cost ($ millions) 6. MEC Acres (acres) 4.1.3 Support Joint Actions 7. Type of Joint Mission Coming to an Installation (constructed scale) 4.1.4 Support Community Reuse and Reduce Economic Impact 8. Urban/Rural (population density) 9. Unemployment Rate (percentage) 4.1.5 Support the Well-Being of Soldiers, Civilians, and their Families
20
10. Number of People Relocated (number of people) We implemented this model is Logical Decisions and in Excel. We developed complexity functions for each of the ten measures. The models are identical but the Excel model is simpler to understand and use. We will describe the Excel model in this paper. In order to develop a more xmderstandable and usable model, we converted the aggregated model from Logical Decisions to Microsoft Excel. Like the Logical Decisions model, the Excel model uses multiple objective decision analysis.
For each complexity measure, we looked at the maximum and minimum scores possible for any
installation, and then developed a function that represented the relative complexity across the range of these scores. For instance, the presence of MEC at an installation will increase the disposition difficulty; however, after that initial MEC is identified, the difficulty will continue to increase but at a much more gradual pace resulting in a diminishing returns fimction. Figure 6.1 below is an example of the complexity function we used for MEC acres. Reduce the Time and Cost for Closure and Disposition MEC Acres 1 iftcres'-.-. ■ X ••' ConoKixhy 0 0 10000 8 20000 8.5 30000 9 40000 9.5 50000 10 Evaluation Measure descriptbn. Evaluation measure sources: 1 Type of evaluation measure
1? Evaluation Measure
0
100OO
20000
1
30000
40000
50000
MEC Acres
Figure 6.1 Complexity Function for MEC Whenever possible we developed the complexity function using our data analysis insights. Our interviews, meetings, panels, and research also played a pivotal role ia developing these functions. For the complexity function to support the type of mission realigned, depots and labs have a small complexity score based on our data analysis. Some stakeholders and subject matter experts believed that depots and labs were difficult to dispose; however, our data analysis did not support this hypothesis. Thus, the depots and labs in Figure 6.2 had a resulting lower complexity value. All ten complexity functions were developed in a similar fashion as the two shown in Figure 6.1 and 6.2. (See Appendix D for a complete list.)
21
Maximize Army Un It Readiness Evaluation Measure Mission Minor Trainina AC Minor TrainlnaRC Houslna Depot RDT&E / Labs Malor Trainina AC Major Training RC Medical Administration Industrial Transport lEvaluation Measure descriotion.
j Type of Mission Realigned Compiexi^ X 1 1.5 2 1.5 3 2.3 4 2.5 2.7 5 6 3 7 3 3.5 8 4.3 9 4.5 10 11 10 )
Figure 6.2 Complexity Function for Mission Type Figure 6.3 displays the foil Excel implementation of the Aggregated Complexity Model. The model is divided into several sections: •
The top section of the model provides the qualitative value model and the weights. This includes the five strategic objectives shown in the Function row, the local weights for the fonctions, the evaluation measures, the local weights for the evaluation measures, and the global weights. The global weights sum to 1.0 and are the product of the local weights above them. The weights used in the model are based on our analysis.
•
The next section describes the complexity fonctions. The complexity value (0 to 10) is shown in the second column and the levels that map to the complexity values are show in the subsequent columns. The constructed scales have qualitative levels.
•
Next is the raw data. These are the notional scores for three installations that have been closed in previous BRAC rounds. We used these installations to demonstrate the model. Installation scores are typed into the matrix. The complexity values are calculated using the scores, the complexity fonctions, and the weights.
•
V(x) is the complexity value for the installation score in the section above. The complexity value is obtained using the complexity fonctions and a macro ValuePL (Kirkwood, 1997). ValuePL looks up exact scores and uses linear interpolation between scores to calculate the complexity value.
•
The fmal section shows the color coding of the complexity values. Red is 7-10 (high complexity), yellow is 4-6 (medium complexity), and green is 0-3 (low complexity). We used the conditional formatting coloring feature in Excel to automatically convert the numbers to colors.
22
Levels and Complexity
(see complexity function for qualitative values)
Function
Maximize Army Unit Readiness
Support Joint Actions
Support the Weil-Being of Soldiers, CiviBans, and Itieir Families
Weight (local)
0.03
0.03
0.08
0.7 Closure and Disposition Activities
Evaluation Measure
Type of Mission Realigned
Type of Joint Mission Coming to an Installation
Number of People Relocated
Weioht (local)
1
1.00
1.00
Estimated Closure and Disposition Cost 0.21
0.14
0.20
0.24
0.50
0.60
0.14
01
0.14
0.17
0.08
0.08
0
200
0
0
10000
0
8000
3
5000
0.03
0.03
0.08
None
0
0
Minor Training RC Housing
Minor Trainiig AC Minor Training RC
10000
160 120
Depot RDTSE/LabS
Dtpot RDT&E/Ubs
20000
80
Major Training AC Major Training RC Medical Administration Industrial Transport
Major Training AC Major Training RC Mdical Administration Industnal Transport
Ft Ord Cameron Slalion f
Color
0.20
Minor Training AC
Red River Ft. Ord Cameron Station
V(x) Value
Appraised Land Value
0 1 2 3 4 5 6 7 8 9 10
MaiorTratninaAC
None None
Administration
None
30000
50 100 150 200 250
50000
40 0
40 80 120 160 200
Urban/Rural
Unemployment Rate •
500 10000 30000 50000
100 0
6 9 12 15
600
8 97
2000 20000
27 250
1000 25000
5 50
50 100
26000
200
169
600
100
20
2
6370.73
2 ■■
•
..:
4 6
1 1
2000 20000
27 260
1000 26000
5 50
60 100
25000
474 9 3828
8 97
9
1
200
159
500
100
20
2
6370.73
2
3 3
0 0
0 4
3 10
0 8
10 8
6 8
0 9
6 6
8 8
0
0
8
0
3
3
0
4 ."
Ft Ord Cameron Station
20000 60000 100000
MEG Acres
474.9 3828
-
X Score
Acres to be Disposed
Weigtit (global)
40000
0.16
Environmental Closure Estimated Environmental Clean-up Cost
015
FtOrd Cameron Station
Support Community Reuse and Reduce Economic Impact
Reduce the Time and Cost for Closure and Disposition
■Hi -
.
.
■■ 9P%ii^A-'g
■■■■■Hj^^m^^
600
3 ^.-
1 ■•■■^.-■•-^
—
BiL p
Figure 6.3 Complete Aggregated Complexity Model. Figure 6.4 is the same as the above model except that it is condensed to remove the weights, complexity levels, scores, and complexity value calculations from the users view. Late in our project, we had a suggestion to create two models: one for closure and one for disposition. Instead, we grouped those strategic objectives that support closure and those that support disposition. This explains why they are not in numerical order used in the strategic objectives.
23
Disposition
C losure M easu res Rjxticn
Nfexm^Am/ LMftadiBss
RirrntJoirt AJions
BaliHtion Nteasire
TjpedMssicn Hsalioned
T^ofJdnt MssJcnCtmrejto an installafcn
FtedHver
caor
R.ad
SoMefS, Qviliars,anci frer fstrUm MntEfof Fteople fflcxHted
Measures
Ffelce tte Tims artj Cbst fa QcEUB and Dspostcn
EsSrraled aosuEand CSspoaSon
Ares to be Dspassd
/Appraised
Btirreted BMtamsrtal Oean-LpCbst
A3BS
Sflxxt Ccmrarity Rase arc ftdjce Bxnoiic Impact
Utai/Rial
1■ isniws* HB^^^B^^^^^HlB «»'!jifiM,i
Uharplcyirent Rale
Total
( .
Camsran SHicn
Figure 6.4 Summary Model of the Aggregated Complexity Model. We used our data analysis insights to help develop the weights. For instance, our regression analysis showed that MEC acreage was very likely to drive up enviromnental costs (R" = .87), so MEC acreage was weighted more than any other measure because we did not have those kind of results for any other measure. Our data also showed that transport missions were the most difficult to dispose of while a depot or a lab was easier. Since this was contrary to some comments made during our interviews, we weighted the measure "mission to be realigned" lower than most of the other measures. During our research process, many people also emphasized some measures as being more important than others, so this also influenced the weights we assigned. The Excel tool is simple to use but still uses the mathematical rigor of multiple objective decision analysis to perform the complexity calculations in a mamier that is transparent to the user.
24
Chapter 7: BRAC 2005 Performance Measures This chapter describes the BRAC implementation performance measures we developed in the 6* step of our methodology.
7.1 Introduction We used an engineering management approach to performance measures and the affinity diagramming process to identify a full set of implementation performance measures.
7.2 An Engineering Management Approach We used an engineering management approach to develop a set of leading and lagging metrics that would allow BRAC implementation to be assessed and managed from Presidential decision to completion. We developed a four phase measurement measure approach consisting of the following types of performance measures: •
Responsibility: In the first phase, all agencies involved with the BRAC would be made aware of there responsibilities, a chain of command established, and one individual placed in charge of each key process.
•
Planning: Once the responsible organizations have been identified, all planning should be performed by these organizations. For example, we should establish MILCON needs, funding and timelines. The intent is that all plans would be ready for implementation before the BRAC implementation process begins.
•
Implementing: This is the management and tracking phase. For example, we would be tracking the acreage transferred, time lines, and percent of budget spent. If we are not on track with our plan, then these metrics would be able to identify the problem in time to develop proper courses of action to put the process back on track.
•
Completion: These are the lagging metrics that would allow for after action reviews and measure the overall success of the BRAC process.
25
7.3 Performance Measures Table 7.1 provides a listing of the major performance measures for each of the five strategic objectives for each performance measure category. The full listing of measures is in Appendix C. The measures in black are already established in the current BRAC 2005 strategic plan and the measures in blue are proposed measures for the revised BRAC 2005 Strategic Plan. Sustain the Well Support Community Being of Soldiers, Reuse and Reduce Civilians, and their Economic Impact families
Performance Objective Performance Measures
Reduce the time and Maximize Unit Readiness cost for closure and During Transfer disposition
Responsibility
Responsibilities for Transition from Responsibilities are Community interface joint actions planning phase to established within the established for MACOM, IMA, BRACO, implementation phase established for MACOM, IMA, MACOM, IMA, within the TABS OEA,RCandASA(I&E) BRACO, OEA, RC office (31 MAY BRACO, OEA, RC agencies with respect to unit and ASA (I&E). and ASA (I&E). 2005). readiness.
Planning
Ensure disposal strategies and Personnel realignment property disposal policies in place prior to start plans that maximize of BRAC process. (30 APR BRAC objectives are 05) in place (31 MAR 2005)
Number of missions transfers Implementation on schedule.
Completion
Support Joint Actions
Joint action schedules developed by 31 DEC 2005.
Plan in place to accomplish RC objectives such that Plan in place for community reuse. (30 disruption of Army personnel is Apr 05) minimized. (30 SEPT 05)
Joint action transfers on schedule to complete.
LRA is organized and Number of people with assignments or in place, ready to successfiiUy begin BRAC process. transferred. (31 DEC 2005).
Base transition coordinator is in place and ready to begin (July 2005).
Number of mission transfers BRAC acres disposed complete.
Personnel responsibilities established for MACOM, IMA, BRACO, OEA, RC and ASA (I&E).
Number ofjoint action transfers complete
Number of reuse plans executed.
Number of people reassigned.
Table 7.1: Performance Measure and Strategic Objective Crosswalk. This section has described the development of the revised strategic objectives and the four phase measurement approach that we recommend be used into a revised BRAC 2005 Strategic Plan. The next step will be to meet with the BRAC stakeholders to coordinate finalize these measures.
26
Chapters: Conclusions In this final chapter, we summarize our conclusions and identify areas for future research.
8.1 Conclusions From our research, we learned that the BRAC 2005 implementation team has a daunting challenge to meet the BRAC 2005 objectives to realign units, close installations and dispose of excess property. The historical record shows that the shortest time to dispose of an installation was just over 3 years and the average time to dispose an installation was 8.2 years. There are still installations from the 1988 BRAC Ust that have not completed disposal. We learned that the BRAC historical data is not sufficient to statistically predict the time to realign, close, and dispose of an installation. Since not all factors apply to each installation the data sets are small. In addition, many political, organizational and personnel issues may have contributed to the historical BRAC performance. However, through our research, interviews, panel meetings, and data analysis, we were able to identify key factors that increase the time to dispose of an installation. More importantly, we were able to incorporate these factors into an installation complexity model that can be used as a management decision tool to help identify the most challenging installations for BRAC 2005 implementation. The installation complexity matrix has several purposes. 1) It can provide senior leaders an overall assessment of the difficulty of BRAC 2005 implementation. 2) It can improve the understanding of the unique challenges of each installation. 3) It can be used as management tool to help assign personnel to the most challenging installations. 4) It can provide a basis for allocating existing resources. 5) It can help explain the need for additional resources. 6) It can identify the need for traming programs. In addition, we used an engineering management approach and affmity diagramming to develop BRAC 2005 performance measures that can be used to manage implementation.
27
8.2 Areas for Future Work Finally, we describe three major areas for future work: •
BRAC Historical Data Analysis. Although there was not sufficient data for standard statistical analysis, there may be other approaches that might we useful; for example Logistic Regression, Linear Discriminant Analysis, Bayesian Networks'* and Neural Networks. The success of these methods may depend on the ability to capture important non-quantitative data including poHtical, organization, and personnel factors.
•
BRAC 2005 Implementation Complexity Model. The aggregated BRAC Installation Complexity Model should be vetted widi key Army stakeholders. The complexity functions and weights need to be refined. The model should be tested and validated using BRAC 1995 data. Once completed, the model will be ready for use in summer 2005.
•
BRAC 2005 Implementation Performance Measures. The performance measures should also be reviewed with key Army stakeholders.
In addition, to provide visibility to senior Army leaders, the
performance measures should be implemented with four perspectives: installation. Installation Management Agency Region, Major Command, and Army. A web-based system would be ideal to allow managers to view BRAC implementation progress for any of the four perspectives. A follow-on West Point cadet capstone research project is planned for Academic Year 2004-2005 to focus on the last two areas.
" LTC Pamela Hoyt's Dissertation, George Mason University, focuses on Bayesian Nets and is using our BRAC data set.
28
Bibliography "Affinity Diagrams", Module 4, The Tools of Total Quality, [online]. www.hq.naw.mil/RBA/text/tools.html [accessed March 2004]. Army BRACO After Action Review: 1988 - 2001. Report. Army BRAC Office, Strategic Plan for the Army Implementation ofBRAC 2005 Washington, D.C., 2004. BRAC Lessons Learned and Other Reference Document Compilation: Summary ofKey Lessons Learnedfrom Prior BRAC Rounds. Presentation, 15 January 2004. Dell, Robert, BRACAS (Base ReaHgnment and Closure Action Scheduler), Presentation, 3 February 2004. Dell, Robert, Telephone Interview, 10 February 2004. DoD Base Reuse Implementation Manual - OEA. December 1997 G8 ofStationing Criteria, Evaluation Metrics, Presentation, 09 January 2003. Holman, Barry, Military Training: DoD Approach to Managing Encroachment on Training Ranges Still Evolving, General Account Office Report, GAO-02-727T, May 2002. Holman, Barry, Progress in Completing Action from Prior Realignments and Closures, General Account Office Report, GAO-02-727T, April 2002. '"Joint Bases' Is the Name of the Game in BRAC '05," National Defense, 01 March 2003. Kirkwood, Craig W., Strategic Decision Making: Multiobjective Decision Analysis with Spreadsheets, Belmont, CaHfomia: Duxbury Press, 1997. Lachman, Beth, Ellen M. Pint, and David Oaks, Lessons Learnedfrom the Implementation ofPrevious BRAC Decisions, RAND, Arroyo Center, AB-745-A, August 2003. Lachman, Beth, Frank Camm, and Susan A. Resetar, Integrated Facility Environmental Management Approaches, RAND, Arroyo Center, MR-1343, 2001. Logical Decisions for Windows, www.logicaldecisions.com McMillen, Jacen and Daniel Pickett, ICMA Base Reuse Handbook: A Navigational Guide for Local Governments, Second Edition, International City/County Management Association, 2002. O'Brien, Patrick, Director, DoD Office of Economic Analysis, Interview, 2 March 2004. "Rumsfeld Requests 'Integrated' Basing Strategy for Next 10 Yeais," Inside the Pentagon, 27 March 2003. Wiggins, James, John Klotz, Richard Meeks, Barbara Wooten, John Schaefer, and Eddie Uyekawa Closure and Realignment Savings Are Significant, but Not Easily Quantified General Account Office Report, GAO/NSIAD-96-97 April 1996.
29
Appendix A: List of Abbreviations ACSIM BRAC BRACO D DASA (lA) DTIC DOD E EPA
ASSISTANT CHIEF OF STAFF FOR INSTALLATION MANAGEMENT BASE REALIGNMENT AND CLOSURE BASE REALIGNMENT AND CLOSURE OFFICE DEPUTY ASSISTANT SECRETARY OF THE ARMY (INFRASTRUCTURE ANALYSIS) DEFENSE TECHNICAL INFORMATION CENTER DEPARTMENT OF DEFENSE ENVIRONMENTAL PROTECTION AGENCY
GAO
GOVERNMENT ACCOUNTING OFFICE
IMA
INSTALLATION MANAEMENT AGENCY
LRA M MACOM MEC MODA
LOCAL RESUSE AUTHORITY MAJOR COMMAND MUNITIONS OF EXPLOSTV^ CONCERN MULTIPLE OBJECTIVE DECSION ANALYSIS
O
OEA ORCEN
DOD OFFICE OF ECONOMIC ANALYSIS OPERATIONS RESEARCH CENTER
SE SEDP
SYSTEMS ENGINEERING SYSTEMS ENGINEERING DESIGN PROCESS
TABS U
THE ARMY BASING STUDY
uxo
USMA
UNEXPLODED ORDANCE UNITED STATES MILITARY ACADEMY
30
Appendix B: Stakeholder Interviews
NAME Dr. Craig College COL Douglas Baker, Mr. Larry Beach, and Mr. Bill O'Donnell Mr. Patrick O'Brien, COL Wendall Taylor, and Mr. Frank Barton Mr. Barry Holman COL Tarantino, Joe Martore, Rob Dow Ms. Beth Lachman and Mr. David Oaks Dr. Rob Dell Mr. Mark Jones Ms. Janet Menig, COL Himsl Mr. John Nerger Mr. Rick Newsome Project Managers Panel Environmental Panel
Organization DASA lA ACSIM (BRACO) OSD OEA GAO TABS Office RAND NPS BIC ACSIM ACSIM ASA-ESOH ACSIM (BRACO) ACSIM (BRACO)
31
Appendix C: Affinity Diagramming strategic Goal 4.1 Effective and Efficient Implementation of BRAC 2005
4.1.1 Maximize Army unit readiness during transfer
Complexity Factors
Performance Measures
1
Missions readiness performance measures
Missions realignment complexity
Responsibility
Establish MACOM, IMA, BRACO, OEA, RC, and ASA(I&E) responsibilties.
Type of missions being realigned
1.5 Personnel realignment policies in place while continuing mission (30 Apr 05)
Planning
Number of people being realigned
1.4 a ID RC installation specific needs and expectations (30 Sept 05)
Privatized support functions
1 SL a Plans complete for phasing out base ops and support services (31 May 06)
Implementation
Percent of mission realignments on schedule to complete.
Completion
:
Percent of mission realignments complete.
Strategic Goal 4.1 Effective and Efficient Implementation o( B RAC 2005
4.1.2 Reduce the tme and cost for closure and disposition
Compiexily Factors
Closure and Disposition complexity Acres to be transferred
Closure and Disposition performance measures
Responsibility
SFtobe transferred
Planning Estimated closure and disposition costs
Implementation Number of Privatized utilities (gas, trasfi, sewage, water, electric) Number of government fiousinq units Value of land
I
Estimated MILCON
1.1 Planningio Impiementation transiiion for ■ TABS office f31 May OSj
1,6 a Provide guidance for dtsposai strategies and develop property di^josal plans diatmaxirruze BRAC ob)ectivas{31 Mar05)
Base transition coordinator in piaci 1.2 c 60% "05 disposition wittiJn 6 years ;
Estimated personnel costs Estimated managerial/care taker costs
Performance Measures
1.2 b 60% 'CS closure or realignment within 3 yeats
Completion
Actual closure Transfer of utilities
Actual closure
1.6 c Plan for environmental clean-u (31 May 06) BTC/Transition team experience MILCON fomis submitEe