Adv. Geosci., 27, 71–77, 2010 www.adv-geosci.net/27/71/2010/ doi:10.5194/adgeo-27-71-2010 © Author(s) 2010. CC Attribution 3.0 License.
Advances in Geosciences
Building an integrated modeling framework for assessing land-use change and its consequences for areal water balance in mountainous Southwest China A. Wahren1,2 , K. Berkhoff3 , S. Herrmann3 , and K.-H. Feger1 1 Institute
of Soil Science and Site Ecology, Dresden Water Center, TU Dresden, Faculty of Forest, Geo and Hydro Sciences, 01735 Tharandt, Germany 2 Dr. Dittrich & Partner Hydro-Consult GmbH, 01728 Bannewitz, Germany 3 Leibniz Universit¨ at Hannover, Institute of Environmental Planning, 30419 Hannover, Germany Received: 10 February 2010 – Revised: 9 May 2010 – Accepted: 13 May 2010 – Published: 7 September 2010
Abstract. The opening up of China’s industry towards market orientation has a distinct impact on natural resources as well as on social structures. The example of rubber introduction in Yunnan province (SW China) shows the mutual interdependencies between economy, natural resources, and social structures. We assess the impacts of rubber introduction and possible development paths in the study area. An integrated modeling framework (NabanFrame) is developed for the catchment of the Naban River (size 270 km2 ), a tributary to the Mekong River. NabanFrame comprises an agroeconomic, ecological, and social model. Altogether they interact with a land-use change model via defined interfaces. Effects on the water cycle are considered by additionally integrating the spatially distributed rainfall-runoff and water balance model AKWA-M® in the model framework. Therefore, a reasonable parameterization is needed to assess the land-use changes on areal water fluxes. The authors conclude that the chosen hydrological model is able to assess the impacts of land conversion (from forest to rubber plantations) on catchment hydrology and address further adaptations to be implemented in the hydrological model.
1
Introduction
Yunnan province in South-West China features an unique natural scenery, as well as an enormous biological and cultural diversity. It is a mountainous area (550–2300 m a.s.l.)
with a high morphological energy. Over the past years, the southern part of Yunnan (study area: Naban National Natural Reserve NNNR, ≈22◦ 090 N; 100◦ 400 E; Xishuangbanna region) developed rapidly with regard to infrastructure and economic performance. Balancing the fast growth and the natural and cultural heritage is nowadays, from our point of view, the most important challenge for the region. It is therefore essential that land-use planning for this area takes into account the complexity of the economic, social, and ecological processes. The overall aim of the integrated project “Living Landscapes China” (LILAC, 2009) is to develop scenarios of sustainable land-use by using strategic tools and provide these to the local planning authorities. Economists, ecologists, hydrologists, and sociologists from Germany and China are jointly working together to develop an integrated model based on a geographic information system (GIS). The model should be able to predict the economic, social and ecological effects of different land-uses, within a landscape context. The changes in land-use distribution, especially the fast growing number of rubber plantations, have a distinct link to water fluxes in catchment hydrology. Rubber is not an indigenous plant in the research area. Given that background a spatially distributed hydrological model (AKWA-M® : M¨unch, 2004; Wahren et al., 2007) is implemented into the existing model framework (NabanFrame) to assess effects of predicted/planned land-use alterations. To assess the consequences of the well-founded future land-use scenarios on areal water balance reasonable model parameterizations are needed.
Correspondence to: A. Wahren (
[email protected]) Published by Copernicus Publications on behalf of the European Geosciences Union.
72 2
A. Wahren et al.: Integrated modeling framework to assess land-use change Methods and material
2.1
NabanFrame integrated modeling framework
The NabanFrame modeling framework (Berkhoff and Herrmann, 2009a) has been developed to produce land-use maps for different scenarios of land-use change. Furthermore, the land-use changes are evaluated in a disciplinary impact assessment. The central model within the framework is the CLUENaban land-use change model. It serves as interface between all applied models. The model framework consists of in total five models. An agro-economic model (based on GAMS) calculates income optimization based on empirically collected data. The social model investigates institutional influences on land-use, and an ecological model (based on FRAGSTATS) evaluates the biodiversity related to land-use changes. Initially, NabanFrame did not comprise a hydrological model. It was added later in the modeling process. The reason for the additional integration of a hydrological model is based on the results from interviews with local farmers showing that the expansion of rubber appears to have severe hydrological impacts. Thus, the hydrological model (AKWA-M® ) contributes more to the impact assessment phase of NabanFrame and does not deliver input data for the land-use change model. Figure 1 gives an overview about the different phases of model application (Data integration, Land use mapping, Imact Assessment) within NabanFrame. CLUENaban is based on the CLUE-S model (Verburg et al., 2002). CLUENaban simulates land-use change using empirically quantified relations (logistic regression) between land-use and its driving factors (“location factors”). Competition between land-use types is modeled according to location suitability, neighborhood settings, conversion elasticity, and a demand-related iteration variable. The allocation of land-use types is done according to the probability of a site for a certain land-use type. In Sect. 3.1 the setup of CLUENaban is described, and we present first results of modeling the status quo in the study area with CLUENaban. We do not address the impact assessment which will be done in the second step of NabanFrame (cf. Fig. 1). 2.2 2.2.1
Hydrological modeling Hydrological model AKWA-M®
Field research in the study area led to the conclusion that water availability and quality are important factors affecting the farm land management decisions. Therefore, the present NabanFrame modeling framework was extended with the spatially distributed hydrological model AKWA-M® . The model is based on a water balance model based on the hydrological response unit (HRU) concept which was developed by Technische Universit¨at Dresden (AKWA: Golf and Luckner, 1991; M¨unch, 2004). In recent years, it has been Adv. Geosci., 27, 71–77, 2010
Fig. 1. The NabanFrame modeling framework.
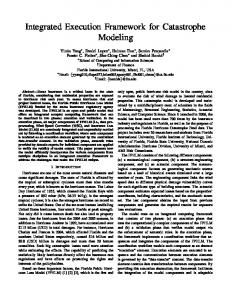
advanced by Dr. Dittrich & Partner Hydro-Consult GmbH (M¨unch et al., 2007; Wahren et al., 2007). This water balance and rainfall-runoff model simulates the water balance and flood runoff in watersheds and transforms the different processes from individual sites to a larger area (in ideal cases: catchments). It contains physically based components (runoff generation), which represent the site specific land-use conditions in their spatial distribution, as well as a conceptual background (runoff concentration) concerning the geological and hydro-morphological characteristics of a whole river basin or a subcatchment. To parameterize the model, spatial information (geology, soil, land-use/vegetation type, elevation/morphology, river network – Fig. 2) and climate data (precipitation, www.adv-geosci.net/27/71/2010/
A. Wahren et al.: Integrated modeling framework to assess land-use change
Mekong Naban
Nan Mu Ga
Man Dian
Fig. 2. River network of the study area in SW China (NNNR, 2006 – red: water divide of the Naban river catchment).
temperature, sunshine duration, humidity, and wind speed) are required. The spatial information is combined by means of overlaying GIS-maps with the relevant information. The result of the overlay is a map defining hydrological response units (HRUs). For the processes of calibration and validation measured river discharge data or additional information like soil moisture, evaporation measurements etc. can be used. For the model framework the hydrological model delivers information on water availability for each individual HRU in the study area. Water availability can be used as a location factor in the CLUENaban land allocation model. The main task for the hydrological model is to evaluate the impacts of land-use changes on the hydrological cycle in the postprocessing module (Impact assessment) of NabanFrame. 2.2.2
Climate
The Naban Watershed is located in the warm-humid subtropical zone. The monsoon influenced area has a distinct rainy season (May to October) and dry season (November– April). The annual precipitation is ≈1500 mm (station Jinghong), where 1200 mm occur in the wet season. The precipitation in the dry season is dominated by fog. The average temperature is 22 ◦ C and the annual average evapotranspiration is ≈1000 mm. 2.2.3
Soil
While most of the spatial information (river network, digital elevation model) already was prepared to develop the land-use maps, the development of a detailed soil map for the NNNR-region is a present task of our project team. In a www.adv-geosci.net/27/71/2010/
73
field campaign soil samples were collected for all relevant altitudes and land-use types. For the initial investigations and to design the hydrological model only very general soil information was available from field observations, oral information and from Zech at al. (2002). The soils are compact Alisols/Acrisols and Ferrasols with laterite iron concretions. Due to the distinct change between the wet and the dry season a seasonality of the physical soil parameters can be assumed. The high clay content leads to swelling and shrinking of the soil (generating macropores), while the dried top-layer during the dry season can become hydrophobic. In the natural forest the soil has a thin organic top-layer which is missing on the recently established rubber plantations. The soils in the valleys along the river are very deep. Thus, a large amount of water can be stored in these soils. This means for river discharge, that runoff generated in the higher areas can be retained the valley aquifer. 2.2.4
Land-use and water
The important land-use types in the NNNR region are forest (e.g. secondary forest, rubber, bamboo), shifting land (dryland), irrigated land, tea, and settlements. Less important are grassland, bareground, and water bodies. To model the areal water balance it is necessary to understand the water fluxes of the sites (HRU) and the runoff concentration in the catchment. For the catchment it can be stated, that especially in the dry season portion of the runoff generated upstream is consumed along the river course by infiltration (cf. Sect. 2.2.3) and evaporation. During the wet season the artificial water management (paddy rice) retains water in the catchment. The main focus of the LILAC project is to assess the impact of rubber. Rubber plantations can change the water balance and affect the microclimate in the study area. An indication for these changes is the fact that the number of cloudy days decreased in Jinghong city of Xishuangbanna from 166 days (average) in 1950 to 91 days (average) in 1980 which is attributed to the expansion of rubber plantations (Wu et al., 2001). Hence, it is plausible to anticipate that the mentioned changes in land-use may have modified the water balance and cycling (soil water supply, evapotranspiration, groundwater recharge). As a consequence, plant production and runoff, and thus, also soil erosion in the rainy season may have been subject to distinct changes. Replacing natural or secondary forests by rubber plantations means changing the multi-layer evergreen mixed broadleaf stands into monocultural deciduous forest in some cases without any ground vegetation. This procedure involves several risks: it is commonly accepted that monocultures are more vulnerable to calamities (insects, fungal diseases, etc.). Additionally, the rubber tree is not a native species in the study area. During the dry season this tropical plant sheds its leaves, which reduces fog interception and canopy drip (Guardiola-Claramonte et al., 2008). Another Adv. Geosci., 27, 71–77, 2010
74
A. Wahren et al.: Integrated modeling framework to assess land-use change
Table 1. Data (location factors) used in the CLUENaban land-use change model. Location factor
Data source
Original data type
Elevation Distance to road Distance to collective land Distance to river Exposition Designation as state land Designation as collective land Distance to village Available labour per ha non-forest village area Lahu ethnic group Akha ethnic group Farm types Protected areas Conversion rules for single land-use classes
ASTER satellite data Roads digitized from analogue map Vector layer Vector layer ASTER satellite data Vector layer Vector layer Villages digitized from IKONOS satellite imagery Household interviews, local statistics Household interviews Household interviews Household interviews National regulation Laws and regulations
Raster layer Raster layer Raster layer Raster layer Raster layer Vector layer Vector layer Raster layer Table Table Table Table Vector layer Description (text)
effect which may result from the not site-adapted plant is the so-called “leaf flushing paradox”. As a tropical plant the rubber tree starts to flush the leaves around the equinox ≈6 to 8 weeks before the rainy season starts. Hence, the root water demand is the highest when the climatic water supply is the lowest (Guardiola-Claramonte et al., 2008). The lacking ground vegetation can lead to erosion and decrease the stand stability.
3
First results
Table 2. Comparison of modeled and observed land-use type areas. Land-use type Dryland Irrigated Shifting Rubber Tea Settlement Forest
3.1
ROC (relative operating characteristic) 0.87 0.89 0.86 0.97 0.89 excluded (considered to be stable) 0.94
Land-use change modeling (CLUENaban)
The model was run for the time period 1996–2006, because at that time rubber production increased rapidly. A reliable land-use map (supervised classification based on IKONOS/SPOT satellite imagery (Berkhoff and Herrmann, 2009b) was available for the year 2006. We started with a basic model run that comprised only three physical location factors: elevation, distance to river, exposition. But physical factors alone could not explain the highly differentiated land-use pattern (dry land, irrigated land, shifting land, rubber, tea, settlement, forest) in the study area. Thus, we integrated additional socio-economic data (Table 1). The data described in Table 1 were all integrated into CLUENaban, either as location factors (drivers of land-use change) or as accompanying rules regarding the conversion of land-use types. Figure 3 presents the result of the model run. In China, collective land and state land are distinguished. Farming usually is restricted to collective land. This land designation turned out to be the most important factor for the land-use types dry land, irrigated land, and rubber (disAdv. Geosci., 27, 71–77, 2010
tribution of collective land and state land can be taken from Fig. 3). All land-use types were influenced by the ethnicity of village inhabitants, because they have different land-use traditions. Ethnic traditions are the most important location factor for tea production. The ROC (relative operating characteristic: Pontius and Schneider, 2001) method is a quantitative measurement to validate a land-cover change model. ROC values can range from 0.5 (complete random) to 1 (perfect fit). Values >0.7 are generally considered acceptable, values >0.8 good. Values of the CLUENaban model run range from 0.86 (shifting) to 0.97 (rubber), thus proving a good result of the model run. Table 2 lists the ROC values for the different land-use types. Dry land has the lowest ROC value, but the spatial distribution in Fig. 3 corresponds quite well with the observation. Dry land and shifting land were separated in the model run, but in reality they often are mixed because they are both agricultural land. The spatial pattern of the modeled dry land/shifting area is in good agreement with the observed www.adv-geosci.net/27/71/2010/
A. Wahren et al.: Integrated modeling framework to assess land-use change
75
Modelled
Observed
3.2
Hydrological modeling
The model calculations are in an early state. The lab examination of the soil samples have provided preliminary results. According to our own field investigations and the information from the scientific literature (e.g. Werner et al., 2006; Jiang, 1988; Guardiola-Claramonte, 2008) a first model parameterization was done to describe the difference between a secondary forest plot (SF) and a rubber plantation (RP). Table 3 shows the monthly average water balance components for both sides.
www.adv-geosci.net/27/71/2010/
0
160%
100
140%
200
120%
300
100%
400
80%
500
60%
600
40%
700
20%
P
SF
P [mm]
180%
800
RP 2009
2008
2007
2006
2005
2004
2003
2002
2001
2000
1999
1998
1997
1996
1995
1994
1993
1992
900 1991
0% 1990
land-use map. Only in the southern part of the study area forest is allocated in the model run despite dry land and shifting land. Further investigations will show if there are special regulations in this area that force the allocation of agricultural land. Irrigated land is allocated well along the rivers and only on collective land. In the eastern part of the study area it sometimes appears in areas that are rubber in reality. Both of them are strongly related to land dedicated as collective land. Rubber is modeled very appropriately, which is also reflected by a high ROC value of 0.97. Tea production areas are mainly allocated in the western part. The general agreement between modeled and observed tea areas is good. The most western tea plantation in the observed landuse map will be verified by ground truth data. We mistrust the land-use classification in this case. Settlements were not considered in the model run because we assumed their extent to be stable. The forest area was modeled very well (ROC 0.94).
Soil Storage [% AWC]
Fig. 3. Comparison of model results and the observed land-use map for the year 2006. In the observed map, the delineation of state land and collective land is added.
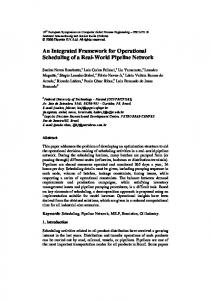
Fig. 4. Comparison of model results from AKWA-M® : soil water storage of secondary forest (SF) vs. rubber plantation (RP).
The elevation for the calculated sites is 800 m asl and the soil is a silty clay Acrisol (2 m deep, porosity 54 %, field capacity 50 %, wilting moisture 36 %). The differences in the model between the two land-use types are: – A thinner organic top-layer for the RP (1 cm in comparison to SF 5 cm). – The content of organic matter in the mineral top layer for SF is higher than for RP. – The first two points result a different soil storage for the two sides (SF: field capacity (FC) = 976 mm and plant available soil water (AWC) = 289 mm; RP: FC = 952 mm and AWC = 271 mm). Adv. Geosci., 27, 71–77, 2010
76
A. Wahren et al.: Integrated modeling framework to assess land-use change
Table 3. Comparison of modeled water balance components from rubber plantation (RP) and secondary forest plot (SF).
Precipitation P [mm]
Jan
Feb
Mar
Apr
May
Jul
Aug
Sep
Oct
Nov
Dec
Wet Season
Dry Season
Year
27
28
54
84
174
185
265
244
186
127
80
49
1181
323
1503
Actual Evapo-transpiration (ETR [mm])
SF RP
54 62
45 44
57 93
85 109
127 119
128 116
105 97
109 100
97 88
92 83
68 62
61 58
657 601
370 448
1027 1049
Groundwater recharge (GWR [mm])
SF RP
2 2
0.5 0.2
0.3 0
0.3 0
14.7 7.4
25 12.1
124 103
130 132
87 91
43 49
26 29
11 13
424 394
41 44
465 438
Soil storage SSFC [% FC] FCSF =976 mm FCRP =952 mm
SF RP
96 96
93 92
91 88
91 84
91 82
94 86
97 92
100 99
100 99
101 100
100 99
98 98
97 93
95 93
96 93
Soil storage SSAWC [% AWC] AWCSF =289 mm AWCRP =271 mm
SF RP
86 86
76 72
70 59
69 44
69 35
79 52
90 73
100 95
101 98
101 100
98 98
94 94
90 75
82 75
86 75
– RP sheds its leaves in February and starts flushing the leaves at equinox (SF is evergreen). – RP’s roots can take up deep soil water during the leaves are growing (SF roots stay constant). – The land-use types have vegetation specific parameters (e.g. SF has a higher leave area index (LAI) than RP). From Table 3 it becomes obvious that the actual evapotranspiration (ETR) from the RP is higher than SF’s ETR from January to April. This period is in the dry season. Additionally, the rubber plant consumes water from the deeper soil layers before the rain season starts (cf. Sect. 2.2.4). For that reason and because of the smaller soil storage in total RP buffers the dry season worse than the SF. Although RP’s groundwater recharge from November to April is a bit higher than SF’s GWR, there is still some outflow from the forest site during the driest periods March and April due to the site adapted consumption of the endemic plants. This is underlined by Fig. 4 showing the monthly run of the soil water content in relation to the plant available soil water at field capacity (AWC). 4
Jun
Conclusion and outlook
The authors are in the initial phase of implementing the hydrological model into the framework approach (social, economic, and ecological based land-use prognosis). We have shown that AKWA-M® was able to assess the impact of land-use conversion from forest to rubber on water fluxes at the site-scale. Other state-of-the-art research (decrease of dripping water from fog due to the fall of leaves) will be implemented into the parameterization of the hydrological model soon to increase the physically founded background of the hydrological model for the NabanFrame modeling framework. Adv. Geosci., 27, 71–77, 2010
The benefits of the integrated modeling approach are: – Combination of heterogeneous data of different disciplines (ranging from empirical data to satellite imagery). – Linkage of different scientific approaches. – Evaluation of land-use changes from different perspectives. – Spatially explicit results of future development: – land-use change maps, – impact assessment of scenarios. Hydrology provides spatially distributed soil water availability for the initial state (2001) and for the present state for the modeling framework. Hydrological consequences resulting from the recent changes in land-use can be assessed and present observations can be explained. The next step is to upscale results which have been gained for individual sites to the catchment scale. The assessment of the future prognosis from the NabanFrame model with regard to site and catchment hydrology will lead to an improvement of sustainable land-use planning support. With NabanFrame, we present an integrated modeling approach for decision support in land-use planning. The evaluation in the post-processing phase of NabanFrame covers the ecological, agro-economic, social, and hydrological impacts of land cover changes, and is also able to consider climate information. Acknowledgements. This work is funded by the German Federal Ministry of Education and Research (BMBF) under promotional reference 0330797 (LILAC – “Living Landscapes China” http://lilac.uni-hohenheim.de/). Edited by: A. Wahren, F. Tavares Wahren, and K.-H. Feger Reviewed by: N. K¨oplin and another anonymous referee
www.adv-geosci.net/27/71/2010/
A. Wahren et al.: Integrated modeling framework to assess land-use change References Berkhoff, K. and Herrmann, S.: Modeling land use change: A GIS based modeling framework to support integrated land use planning (NabanFrame), in: Advances in GIScience (Lecture Notes in Geoinformation and Cartography Series), edited by: Sester, M., Bernard, L., and Paelke, V., Springer, Berlin, Heidelberg, 2009a. Berkhoff, K. and Herrmann, S.: Combined IKONOS/SPOT land use map 2006/07: Classified from IKONOS-2 (1 m, scene ID 2007102804172390000011625752), and SPOT5 (10/20 m, scene ID 5 258-306), 2009b. Guardiola-Claramonte, M., Troch, P. A., Ziegler, A. D., Giambelluca, T. W., Vogler, J. B., and Nullet, M. A.: Local hydrologic effects of introducing non-native vegetation in a tropical catchment, Ecohydrology 1, 13–22, 2008. Golf, W. and Luckner, K.: AKWA – ein Modell zur Berechnung aktueller Wasserhaushaltsbilanzen kleiner Einzugsgebiete im Erzgebirge, Acta Hydrophysica, 32, 5–20, 1991 (in German). Jiang, A.: Climate and natural production of rubber (Hevea brasiliensis) in Xishuangbanna, southern part of Yunnan province, China, Int. J. Biometeorol., 32, 280–282, 1988. M¨unch, A.: AKWA-M® – Teilfl¨achen basiertes Wasserhaushaltsund Hochwassermodell, Dr. Dittrich & Partner Hydro-Consult GmbH, Bannewitz, 2004 (in German). M¨unch, A., Dittrich, I., and Wahren, A.: The Effects of Changes in Tree Species Composition and of Afforestation on Water Budget and Flood Dynamics Calculated with AKWA-M® , Ore Mountains, in: Progress in Hydro Science and Engineering, edited by: Feger, K. H., Wang, Y., Bernhofer, C., and Seegert, J., Dresden Water Center, Dresden, 3, 331–337, ISBN: 978-3-86780-074-7, 2007.
www.adv-geosci.net/27/71/2010/
77
NNNR: Naban River Watershed National Nature Reserve, in: Xishuangbanna Nabanhe National Natural Reserve, edited by: Yunnan Provincinal Environmental Protection Bureau, available at: http://www.nbh.gov.cn/ReadNews.Asp?ID=84\ &BigClassID=3\&SmallClassID=3 (last access: 7 February 2010), 2006. Pontius, R. G. and Schneider, L. C.: Land-cover change model validation by an ROC method for the Ipswich watershed, Massachusetts, USA, Agr. Ecosyst. Environ., 85, 239–248, 2001. Verburg, P. H., Soepboer, W., Veldkamp, A., Limpiada, R., Espaldon, V., and Mastura, S. S. A.: Modeling the spatial dynamics of regional land use: The CLUE-S model, Environ. Manage., 30, 391–405, 2002. Wahren, A., Schw¨arzel, K., Feger, K. H., M¨unch, A., and Dittrich, I.: Identification and model based assessment of the potential water retention caused by land-use changes, Adv. Geosci., 11, 49–56, doi:10.5194/adgeo-11-49-2007, 2007. Werner, C., Zheng, X., Tang, J., Xie, B., Liu, C., Kiese, R., and Butterbach-Bahl, K.: N2 O, CH4 and CO2 emissions from seasonal tropical rainforests and a rubber plantation in Southwest China, Plant Soil, 289, 335–353, 2006. Wu, S. L., Liu, H. M., and Liu, L. Y.: Rubber cultivation and sustainable development in Xishuangbanna, China, Int. J. Sust. Dev. World, 8, 337-345, 2001. Zech, W. and Hintermaier-Erhard, G.: B¨oden der Welt: Ein Bildatlas, Spektrum Akademischer Verlag, Heidelberg, Berlin, 120 pp., 2002 (in German).
Adv. Geosci., 27, 71–77, 2010