Building Detection Using Local Gabor Features in Very High Resolution Satellite Images ¨ Beril Sırmac¸ek and Cem Unsalan Computer Vision Research Laboratory Department of Electrical and Electronics Engineering Yeditepe University ˙Istanbul, 34755 TURKEY e-mail:
[email protected]
Abstract—Building detection from very high resolution satellite imagery is an important task for land planners. However, manually locating buildings from these images is a difficult and time consuming process. Therefore, researchers focused on building detection using automated image processing and computer vision techniques. The main problems here are as follows. Buildings have diverse characteristics and their appearance (illumination, viewing angle, etc.) is uncontrolled. On the other hand, buildings often have similar cues like parallel edges and roof corners that can be merged. In this study, we propose an automated approach for building detection based on Gabor filters and spatial voting. We extract features (representing buildings) using Gabor filter responses. Using these features, we form a spatial voting matrix to detect buildings. We tested our algorithm on very high resolution grayscale Ikonos satellite images and obtained promising results.
I. I NTRODUCTION Satellite images give valuable information to monitor urbanization and building construction. Land planners and government agencies need to update their maps, but doing this manually is very time consuming. Although more details are visible with the improved resolution of satellite images, the building detection is still difficult. Main reasons are the denseness and the complexness of the scene. Therefore, many researchers focused on developing robust building detection algorithms in satellite images. Bellman and Shortis [1] used Support Vector Machines to classify wavelet coefficients as a building or non-building object. Selvarajan and Tat [5] used wavelet filter banks in two levels. In the first level, they constructed an edge map. In the second level, they constructed a region of interest map by using local intensity variations. In a previous study, we introduced a graph theoretical method to detect buildings using SIFT keypoints [6]. In that study, we provided a detailed literature review on automated building detection. We benefit from local descriptors to detect buildings. Local descriptors are popular tools in object recognition. they are robust to occlusion and global geometric deformations. We benefit from Gabor transformation in extracting local features. Gabor features are widely used in various important computer vision tasks. Kyrki et al. [3] proposed a simple Gabor feature space for invariant object recognition applications. Some
researchers used Gabor filters to detect man-made structures in satellite images. Idrissia et al. [2], extracted edges of man-made structures (buildings and roads) using Gabor filters together with the NDVI (Normalized Difference Vegetation Index) in SPOT5 images. Comparing their edges of two image sequences taken from same region, they detected changes. In this study, we present a novel method to detect buildings in panchromatic Ikonos satellite images. We use a Gabor filter set to detect building properties in the image. We assume locations of these properties as features and generate descriptor vectors for each feature point. Each descriptor gives a vote to a voting matrix. Using voting matrix, we detect locations of buildings in a robust manner. We provide experimental results of our algorithm using panchromatic Ikonos satellite images. II. D ESCRIPTOR E XTRACTION Local cues can help to detect buildings with different characteristics (like shape, size and intensity). In order to extract these cues, we design a specific Gabor filter set. Our filters respond to building edge shapes in different directions. Sometimes, small details (such as trees or bushes) can be falsely detected as a building cue. Therefore, before using our Gabor filter set, we first preprocess the given image with a median filter having 5x5 window size to eliminate these false alarms. Then, we filter the image with our Gabor filter set. Since Gabor filter responses will be high for image regions having similar characteristics with the filter, we assume locations of local maximums as feature locations. After extracting feature locations, we generate descriptor vectors for each of them to find building centers. Here, we pick Adana8 test image from our dataset as a sample. Next, we describe extraction of feature locations and generation of descriptor vectors on our sample image. A. Gabor Filtering Gabor filter responses can exhibit desirable characteristics of spatial locality and orientation selectivity since they are optimally localized in spatial and frequency domains [8]. Mathematically a two dimensional Gabor filter G(x, y) can be defined as the product of a two dimensional Gaussian and
a complex exponential function. The two dimensional Gabor filter function can be defined as G(x, y) =
1 U2 + V 2 exp (− ) exp (j2πf U ) 2πσg2 2σg2
(1)
U = (x cos(ϕ), y sin(ϕ))
(2)
V = (−xsin(ϕ), y cos(ϕ))
(3)
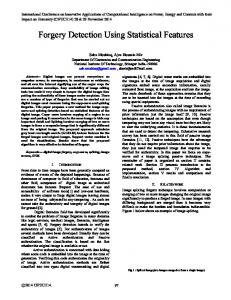
equal to threshold value which is obtained by Otsu’s automatic thresholding method on R(x, y) filter response. We provide a sample result on local feature extraction in Fig. 1. In this figure, Adana8 test image is given in the left side. Locations of extracted features are shown in the right side.
where
In Eqn. 1, f is the central frequency of the complex exponential signal, ϕ is the direction of the Gabor filter, and σg is the scale parameter. It is possible to detect specific edge types by fixing these parameters. The central frequency f is used to handle gray level variations to detect building edges. It is quite logical to get a central frequency close to the inverse of edge thickness. If the thickness is not consistent, some edges can be removed permanently. In this case, by changing σg it is possible to support the variability of thickness of edges. In this study, we fix ϕ and σg parameters after extensive experiments on a large Ikonos image dataset. Therefore, we filter image with a set of Gabor filters (with σg = 1.5, and f = 0.65) in which filter responses are very similar to building edges in Ikonos satellite images. To cover differently oriented building edges, we pick ϕ = {0, π/6, 2π/6, 3π/6, 4π/6, 5π/6} radians. Hence, we filter the same image with six differently oriented Gabor filters. For other types of images (such as Quickbird) these parameters should be adjusted wrt. the spatial resolution at hand. By convolving our N × M size test image I(x, y) with a Gabor function from our filter set, we can evaluate their similarity. We define the Gabor response at point (x0 , y0 ) as R(x0 , y0 ) =
N X M X
I(x, y)G(x0 − x, y0 − y)
(4)
x=1 y=1
The Gabor filter response R(x, y) obtained from Eqn 4 can emphasize edge-oriented characteristics of image I(x, y). B. Feature Extraction After filtering the image I(x, y) in six directions, we obtain six different R(x, y) Gabor filter responses. Since filter response have higher values for image regions which are similar to filter shape, we extract local maximum points in each filter response to detect building properties. In R(x, y) Gabor filter response, a point (xk , yk ) is detected as a local feature if it satisfies the inequality R(xk , yk ) > R(x, y) where p (x − xk )2 + (y − yk )2 < ra . We assume ra = 4 pixels in this study. In other words, if (xb , yb ) coordinate has highest vote in R(x, y) filter response in its four pixels proximity, then it is labeled as a feature location. In order to eliminate weak features, we use a control threshold. If R(xk , yk ) < ξa , then feature in (xk , yk ) location is eliminated. Here, ξa is
Fig. 1. Original Adana8 test image and locations of extracted features (left and right sides respectively).
C. Generating Descriptor Vectors Detecting locations of features that have similar characteristics to building textures, we search for a stable descriptor vector in order to describe them. For each feature point, we extract three descriptors as; location of the feature (xk , yk ) k = 1, ..., K, possible distance of the building center from feature location (Lk ), and dominant orientation (βk ). That means, for the kth feature, descriptor vector is defined as Fk = ((xk , yk ), Lk , βk ). Here, Lk is assumed as the half length of the edge which generates feature in (xk , yk ) location. To calculate the edge length, we apply Otsu’s thresholding method to the magnitude of the Gabor filter response [4]. We apply connected components analysis to group thresholded pixels [7]. Edge length will be the sum of pixels in the connected group. At this step, we also eliminate some weak local features by their edge length. Dominant direction βk is calculated using the orientation of Gabor filter which generates feature in (xk , yk ) location. We know that (xk , yk ) is extracted, if it is on a building edge which is lying perpendicular to the filtering direction. In the filter response, we obtain parallel edges near the building edge because of shape of the Gabor filter. Edge with highest value generates the feature in location (xk , yk ). If the building is brighter than its background, second highest edge is located close to the building center. Let’s assume center of the edge with second highest value appears in (xsk , yks ) location. We define the dominant direction βk as the direction of a line connecting (xk , yk ) to (xsk , yks ). This also shows the direction of the building center. Since our buildings are generally bright compared to background, dominant direction calculation seems reasonable. Here we have to note that, our system is not able to detect a dark building. For the Adana8 test image, dominant orientations for each local feature is given in the right side of Fig. 2. Vectors are plotted on a blank image in order to increase visibility. As can be seen in this figure, feature orientations (extracted on
building edges) are directed from the building edge to the building center. Since all building features are directed towards the building center, we can detect buildings by giving votes to the estimated building center. We describe this method next.
Fig. 3. (right).
Fig. 2. Original Adana8 test image (left) and descriptor vectors are shown on a blank image (right)
III. B UILDING D ETECTION As we extract local features and their descriptor vectors, we use them to generate a voting matrix. To detect a building, we should detect its properties (like edges and corners) that can be merged in one center. In other saying, we should find closely located features having descriptor vectors directed to the same location (building center). Therefore, we generate a voting matrix such that each descriptor votes to possible building location and its certain proximity. We detect building locations by finding maximum votes in this voting matrix. Assume that, we have K features in given test image with coordinates (xk , yk ) k = 1, ...K. First, we calculate possible building locations using descriptor vectors, Fk = ((xk , yk ), Lk , βk ). For the kth feature, possible building location is (x∗k , yk∗ ) which is Lk pixels away from (xk , yk ) location in βk direction. In order to generate the voting matrix, we give a vote to each (x∗k , yk∗ ) k = 1, ..., K location. Since we have K features, there will be K possible building centers with coordinates (x∗k , yk∗ ) k = 1, ..., K. We form the voting matrix as
V (x, y) =
K X k=1
µ ¶ (x − x∗k )2 + (y − yk∗ )2 1 exp − (5) 2πσk2 2σk2
Here σk is the parameter for voting proximity for each local feature. This means, we give the maximum vote to the possible building center in (x∗k , yk∗ ) k = 1, ..., K coordinates. We also give vote to its neighboring locations in decreasing order (using a Gaussian function). For Ikonos images, we pick σk = 5 × Lk . We multiply the weight of the feature by five to add some tolerance for voting. In the first column of Fig. 3, we give the voting matrix V (x, y) for Adana8 test image. After finding the voting matrix, we locate buildings by detecting local maximums of the voting matrix, V (x, y). Possible building locations are the points where votes make a maximum (where probability is maximum) in V (x, y). We detect the (xb , yb ) location from V (x, y) as a possible building
Voting matrix for Adana8 test image (left) and detected buildings
location if it satisfies inequality V (xb , yb ) > V (x, y) where p (x − xb )2 + (y − yb )2 < rb . In this study, we assume rb = 10 pixels for Ikonos images. In other words, if (xb , yb ) coordinate has highest vote in V (x, y) voting matrix in its 10 pixels proximity, then it is labeled as a building location. But sometimes false features may cause local maximums in voting matrix and that leads to false alarms in detection results. To avoid this problem, we use a control threshold ξb . If V (xb , yb ) < ξb (if there is not enough vote), then (xb , yb ) is not detected as a building location. Here ξb is an adaptive threshold value that is calculated using Otsu’s automatic threshold selection method. Detected buildings for Adana8 test image is given in the second column of Fig 3. IV. E XPERIMENTAL R ESULTS We tested our automatic building detection algorithm on 19 high resolution panchromatic Ikonos images taken from Adana, Turkey. These test images include urban regions and buildings with different characteristics. In Figs. 4 and 5, we provide some detection results of our algorithm. In our test image dataset, our method detected 529 of 600 buildings correctly. Unfortunately, if false features are located closely, sum of their votes generated a local maximum point in voting matrix. We could not prevent detection of these false local maximums as buildings. As a result, we obtain T P as 88.17% and F P as 14.33% for 600 buildings. Here, TP (True Positive) represents buildings which are correctly labeled by our system and FP (False Positive) represents buildings which are detected by our system as a mistake. Considering diverse characteristics of buildings in our test image dataset, these results are consistent. V. C ONCLUSIONS AND F UTURE W ORK In this study, we present a novel approach for building detection in panchromatic Ikonos satellite images based on Gabor features. Using a Gabor filter set, we extract local features that represent building properties. After constructing descriptor vectors for each feature location, we use these descriptor vectors in forming a spatial voting matrix. Then, by detecting local maximum votes in this voting matrix, we detect building locations in the given image. We test our algorithm on several Ikonos satellite images. They include buildings with
Fig. 4. Adana1 , Adana2 , Adana3 , and Adana4 test images (first column) and detected buildings (second column).
diverse characteristics. Experimental results on our dataset show that, our method can be thought as the first step for a robust automated building detection system. ACKNOWLEDGEMENT ˙ This work is supported by Istanbul B¨uy¨uks.ehir Belediyesi under project Projem ˙Istanbul. R EFERENCES [1] C. J. Bellman and M. R. Shortis, “Building recognition using wavelet analysis and support vector machines,” in Proceedings of SSC2003, 2003. [2] M. Idrissa, V. Lacroix, A. Hincq, H. Bruynseels, and O. Swartenbroekx, “SPOT5 images for urbanization detection,” in Proceedings of Advanced Concepts for Intelligent Vision Systems, 2004. [3] V. Kyrki, J. Kamarainen, and H. Kalviainen, “Simple gabor feature space for invariant object recognition,” Pattern Recognition Letters, vol. 25, no. 3, pp. 311–318, 2004. [4] N. Otsu, “A threshold selection method from gray-level histograms,” IEEE Transactions on System, Man, and Cybernetics, vol. 9, no. 1, pp. 62–66, 1979.
Fig. 5. Adana7 , Adana12 and Adana13 test images (first column) and detected buildings (second column).
[5] S. Selvarajan and C. Tat, “Extraction of man-made features from remote sensing imageries by data fusion techniques,” in The 22nd Asian Conference on Remote Sensing, Singapore, 2001. ¨ [6] B. Sırmac¸ek and C. Unsalan, “Urban area and building detection using SIFT keypoints and graph theory,” IEEE Transactions on Geoscience and Remote Sensing, In Press. [7] M. Sonka, V. Hlavac, and R. Boyle, Image Processing, Analysis and Machine Vision, 3rd ed. CL Engineering, 2007. [8] M. Vetterli and J. Kovacevic, Wavelets and Subband Coding, 1st ed. Prentice Hall, 1995.