Damaged Building Detection in Aerial Images using Shadow Information ¨ Beril Sırmac¸ek and Cem Unsalan Computer Vision Research Laboratory Department of Electrical and Electronics Engineering Yeditepe University ˙Istanbul, 34755 TURKEY e-mail:
[email protected]
Abstract—Automatic detection of damaged buildings from aerial and satellite images is an important problem for rescue planners and military personnel. In this study, we present a novel approach for automatic detection of damaged buildings in color aerial images. Our method is based on color invariants for building rooftop segmentation. Then, we benefit from grayscale histogram to extract shadow segments. After building verification using shadow information, we define a new damage measure for each building. Experimentally, we show that using our damage measure it is possible to discriminate nearby damaged and undamaged buildings. We present our experimental results on aerial images.
I. I NTRODUCTION Natural disasters such as earthquakes or hurricanes may cause a great damage to a region. Although these disasters are inevitable, it is still possible to minimize the problems afterwards. After an earthquake or a hurricane, the road network may be damaged. Therefore, the region may not be accessible using ground transportation. It is also highly possible that the communication network to be damaged. These deficiencies may limit the information flow from the disaster region. However, it is utmost important for rescue planners to get reliable information from these regions to effectively guide their resources. To get reliable information from a disaster region, one possible solution is sending an aerial surveillance system. This system may collect aerial images from the disaster region. Although the images may be of use for rescue planners, it is still hard to manually locate damaged buildings in these images. With the same reasoning, automatically locating the damaged buildings after a military airstrike is utmost importance to military personnel. This information may give insight on the success of the airstrike. Therefore, automatic damaged building detection from aerial or satellite images is an important problem in remote sensing. Satellite and aerial images have different properties that make it hard to develop generic algorithms for damaged building detection. These images differ in scale (resolution), sensor type, orientation, quality, and ambient lighting conditions. In addition to these difficulties, buildings may have complicated structures and can be occluded by other buildings or trees. One has to consider both aspect, structural, and deterministic cues to construct a solution to this challenging problem. In order to
handle these problems, we propose a novel building damage detection system in this study. Our aim is to automatically locate the damaged buildings from aerial images in a fast manner. This information may be invaluable for both rescue planners and military personnel. In related literature, some researchers used the shadow information to detect buildings. Huertas and Nevatia [3] used the relationship between buildings and shadows. They first extracted corners from the image. They labeled these corners as either bright or shadow. They used the bright corners to form rectangles. Shadow corners confirm building hypothesis for these rectangles. McKeown et al. [4] detected shadows in aerial images by thresholding. They showed that building shadows and their boundaries contain important information about building heights and roof shapes. Zimmerman [11] integrated basic models, and multiple cues for building detection. He used color, texture, edge information, shadow and elevation data to detect buildings. His algorithm extracts buildings using blob detection. Tsai [7] compared several invariant color spaces including HSI, HSV , HCV , Y IQ, and Y Cb Cr models for shadow detection and compensation in aerial images. Vu et al. [9] also used shadows to model buildings. They showed that shadow information can be used to estimate damages and changes in buildings. Chen and Hutchinson [1] developed a system to detect damages using bitemporal grayscale satellite images. First, they compared two images to detect pixel based changes. Then, they extracted object based changes by a probabilistic approach. In this study, we assume that the damaged region is not imaged beforehand. Therefore, it is not possible to compare two images (as in standard change detection algorithms) to detect damaged buildings. We have to detect the damaged buildings using just one image (obtained after the earthquake or the airstrike). Our method depends on detecting building rooftops and shadow information from color aerial images. In order to extract the building rooftops we benefit from invariant color features. In our previous studies, we were able to locate the building rooftops in a reliable manner [6]. Here, we extract shadow segments by automatically thresholding the grayscale image. As we extract both information in a robust manner, then we group rooftop and shadow segments using image
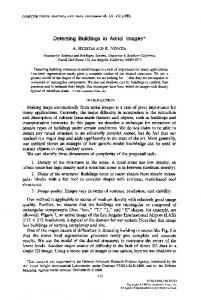
processing techniques. The ratio of the rooftop region to its shadow region gives insight on the height of the building under consideration. Since we have many buildings in a given region, they also give insight on the actual ratio for the undamaged buildings. After obtaining this information, we locate damaged buildings. We tested our damaged building detection system on aerial images and obtained reasonable results. II. B UILDING D ETECTION We consider color aerial images in RGB color format. Our first aim is to detect buildings and their shadows automatically. Then, we will use this information to define a measure to estimate the degree of damage. We provide a sample test image in Fig. 1.
Fig. 1.
unity for red colored objects independent of their intensity values. Similarly, it has a value of minus unity for green colored objects in the image. Therefore, the red rooftops (of buildings) can be easily segmented using ψr . Since most buildings have red rooftops in the test region, this invariant is of great use to detect buildings. To segment out the red rooftops automatically, we benefit from Otsu’s thresholding method [5]. In order to detect shadow segments automatically, we use grayscale histogram of image. First, we smooth this image with a median filter. Since, shadows generally appear in the darker regions of an image, we choose the first local minimum in the histogram as the threshold value. We extract shadow segments by thresholding the grayscale image with this automatically calculated threshold value. Using this method, we obtain the rooftops and shadow segments as in Fig. 2.
Istanbul1 test image from our aerial image dataset.
As can be seen in Fig. 1, there are only undamaged buildings in this region. We benefit from color invariants and grayscale information to extract rooftop and shadow segments from this test image. We explore them next. A. Detecting Rooftop and Shadow Segments
Fig. 2.
Building rooftop and shadow segments in Istanbul1 test image.
In Fig. 2, blue segments represent detected shadows and red segments represent detected red rooftops in the Istanbul1 test image. We provide the detection results on a blank image to increase visibility of segments.
Color invariants help to extract color properties of objects without being affected by imaging conditions. Imaging conditions can be counted as, the illumination of the environment, the surface properties of the object, the highlights or shadows on the object, and the change of the angle of view. Gevers and Smeulders [2] proposed several color invariants. We extract the color information in the aerial image using a specific color index based on our previous study [8]. There, we used multispectral information from satellite images as the red and near-infrared bands. Here, we follow the same strategy to define a color invariant, but with the red and green bands of the color aerial image as: µ ¶ R−G 4 (1) ψr = arctan π R+G
B. Estimating the Illumination Direction In previous approaches, the illumination direction is provided to the system manually [10]. We assume that the illumination direction can be estimated if a connected rooftop and shadow region couple can be located in the image. We consider the illumination direction as the vector originating from the center of the rooftop region to ending at the center of the shadow region. Based on this definition, for the rooftop and shadow couple, if center of the rooftop region is at (xb , yb ), and the center of the shadow region is at (xs , ys ), then the illumination angle θ is: µ ¶ |yb − ys | θ = arctan (2) |xb − xs |
where R stands for the red band and G stands for the green band of the color image. This color invariant has a value of
The quadrant θ lies is also important. We can adjust θ according to its actual quadrant as:
θ π−θ θ= π+θ 2π − θ
III. M EASURING THE D EGREE OF DAMAGE if if if if
xs xs xs xs
> xb , ys < xb , ys < xb , ys > xb , ys
< yb < yb > yb > yb
(3)
We pick a sample building in the Istanbul1 test image and provide its illumination direction in Fig. 3. We zoom into a small part of the image to magnify illumination direction.
As we obtain the rooftop and shadow segments, we define a measure to determine the degree of damage. For this purpose, we calculate the ratio of rooftop and shadow areas for each building as: N (5) M where N is the area of the rooftop segment and M is the area of the corresponding shadow segment. Since shadow and rooftop areas are larger for undamaged buildings, this ratio gives similar results. But if the building is decayed or if there is a structural damage on it, its shadow region will be smaller which leads rooftop to shadow ratio to have higher values. Again, to note here, we do not have image of the test region taken beforehand. Therefore, this ratio gives important information about the degree of damage using a single image. r=
IV. E XPERIMENTAL R ESULTS Fig. 3. image.
Automatically calculated illumination direction of Istanbul1 test
In Fig. 3, the yellow arrow indicates the automatically detected illumination direction. As can be seen, the arrow is directed from the red rooftop segment to the center of shadow segment. C. Verifying the Building Appearance If the rooftop (of a building) to be detected is not red, then our color invariant ψr may not be sufficient to detect it from the aerial image. To detect such rooftops (hence buildings), we have to look for other cues. Since we determined the illumination angle θ in Eqn. 3, this information may be of help to verify red rooftops as well as infer non-red rooftops. To do so, we introduce a hypothesis test such that; if we detect a shadow somewhere in the image it should originate from a building. Therefore, we use the illumination direction information to estimate the possible building location. The illumination angle and direction is calculated using the red rooftop and shadow couples of other buildings (in the image) as we have introduced in the previous section. We assume that, the building should be in the opposite direction of the illumination vector. We locate a 30×30 window on this center. We call this region as the estimated building segment. The formula to calculate estimated building location as: (xe , ye ) = (xs + d cos θ, ys + d sin θ)
In this section, we provide two test images, one containing undamaged buildings (Istanbul1 ) and the other containing damaged buildings (Istanbul2 ). Detected buildings in Istanbul1 test image are given in Fig. 4. Damage measures, r, of these buildings are calculated as follows. On the upper side only first three buildings are detected, and their damage measures are calculated as 1.94, 1.79, and 2.26 respectively. For the buildings lying horizontally in the center of the image, damage measures are calculated as 1.79, 1.79, 2.34, 2.38, 2.70, 2.35, 2.31 respectively. Finally, for the building on the lower left side of the image, the damage measure is calculated as 2.23. It can be seen that the obtained damage measures of these buildings are very similar. Mean of these damage measures is calculated as µ = 2.17. Since the user knows that all of these buildings are healthy, the degree of the damage on other buildings can be estimated by comparing their damage measures with the µ value.
(4)
where, (xs , ys ) is the location of the shadow center. (xe , ye ) represents the coordinates of the estimated building center. d is the possible distance that a building can be located. In this study, we use this distance as 17 pixels considering the size of the buildings in our test images.
Fig. 4. Detected buildings in Istanbul1 test image. (Undamaged building measures are calculated on these detected buildings.)
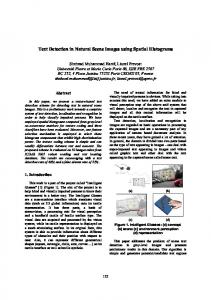
After calculating the damage measures for the undamaged building set (selected by the user), we use the Istanbul2 image that contains damaged buildings in order to test our algorithm as given in Fig. 5. For the building which is on the upper left side of this test image, damage measure is 1.6. The second building on the upper side could not be found by our system, so damage degree could not be measured. For the building on the upper left side of the image, the damage measure is obtained as 1.6 again. By comparing with µ, we can say that these two buildings are undamaged. For the building on the lower left side of the image, the damage measure is calculated as 2.78. This result is also similar to damage measures of undamaged buildings, and that indicates this building is also undamaged. On the lower side of the image, damage measures of last three buildings are calculated as 7.75, 4.22, 4.67 respectively. These values are very high compared to µ. Therefore, these values can give an idea to user about the damage in these buildings.
Fig. 5.
Detected buildings in Istanbul2 test image.
V. C ONCLUSIONS In this study, we present a novel method for automatic damaged building damage detection from color aerial images. We first extract building rooftops using invariant color features. Then, we extract the shadow information using grayscale histogram. We locate neighboring building and shadow regions. We use these couples to determine the illumination direction and verify building appearance. Finally, we define a measure to estimate damage degree using rooftop and shadow segments
for each building. Test results on real aerial images indicate the possible use of our method in practical applications. We are still working on improving our damaged building detection system. We believe that proposed system will be of great use for both disaster management and military applications. R EFERENCES [1] Z. Chen and T. Hutchinson, “A probabilistic classification framework for urban structural damage estimation using satellite images,” Urban Remote Sensing Joint Event 2007, pp. 1–7, 2007. [2] T. Gevers and A. W. M. Smeulders, “Pictoseek: Combining color and shape invariant features for image retrieval,” IEEE Transactions on Image Processing, pp. 102–119, 2000. [3] A. Huertas and R. Nevatia, “Detecting buildings in aerial images,” Computer Vision, Graphics and Image Processing, vol. 41, pp. 131– 152, 1988. [4] R. B. Irvin and D. M. McKeown, “Methods for exploiting the relationship between buildings and their shadows in aerial imagery,” IEEE Transactions on Systems, Man, and Cybernetics, vol. 19, no. 1, pp. 1564–1575, 1989. [5] N. Otsu, “A threshold selection method from gray-level histograms,” IEEE Transactions on Systems, Man, and Cybernetics, vol. 9, pp. 62– 66, 1979. ¨ [6] B. Sırmac¸ek and C. Unsalan, “Building detection from aerial images using invariant color features and shadow information,” in Proceedings of International Symposium on Computer and Information Sciences ISCIS’2008, 2008, pp. –. [7] V. J. D. Tsai, “A comparative study on shadow compensation of color aerial images in invariant color models,” IEEE Transactions on Geoscience and Remote Sensing, vol. 44, no. 6, pp. 1661–1671, 2006. ¨ [8] C. Unsalan and K. L. Boyer, “Linearized vegetation indices based on a formal statistical framework,” IEEE Transactions on Geoscience and Remote Sensing, vol. 42, pp. 1575–1585, 2004. [9] T. Vu, M. Matsouka, and F. Yamazaki, “Shadow analysis in assisting damage detection due to earthquake from quickbird imagery,” Proceedings of the 10th international society for photogrammetry and remote sensing congress, pp. 607–611, 2004. [10] G. Zhou, W. Chen, J. Kelmelis, and D. Zhang, “A comprehensive study on urban true orthorectification,” IEEE Transactions on Geoscience and Remote Sensing, vol. 43, no. 9, pp. 2138–2147, 2005. [11] P. Zimmermann, “A new framework for automatic building detection analyzing multiple cue data,” in International Archives of Photogrammetry and Remote Sensing IAPRS’2000, vol. 33, 2000, pp. 1063–1070.