structure is basically the probing pad structure surround the device for probing ... to carry out in order to exclude the parasitic came from the open-pad structure.
CHU Chun San, December 18, 2004
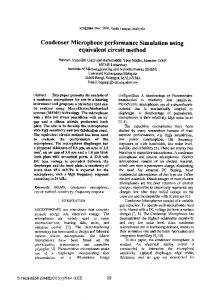
ADS Application Notes Wireless Communication Laboratory Department of Electrical and Electronic Engineering Hong Kong University of Science and Technology
Building Varactor Physical Equivalent Circuit Model from the extracted S-parameters of device measurement results
CHU Chun San, December 18, 2004
Introduction This application note describes the procedure of building a physical equivalent circuit model of a varactor from its extracted S-parameters measured with network analyzer. A varactor is a kind of voltagecontrolled capacitor that is commonly used in VCO. Other than the capacitance value, Q-factor is also an important figure of merit to describe the performance of a varactor. As a result, a varactor model need to represent accurate capacitance and Q-factor value which should be as close as the measurement results.
Modeling procedures In order to build a varactor physical equivalent circuit model, it need to first obtain the measured Sparameter of the varactor from the network analyzer. After extracted and plotted the extracted capacitance, Q-factor and resistance from the measurement results, we can than find out appropriate value for the elements in the equivalent circuit. The detailed procedures to build a varactor physical equivalent circuit model are shown below step by step. 1. Open ADS program. Choose “File Æ New Project” to open a new project.
2. In the new schematic of the project, push the “Datasheet” button to open a datasheet in order to import the measured S-parameter files.
CHU Chun San, December 18, 2004
Datasheet Option
3. After opened the Datasheet window, choose “File Æ Import Æ Import dataset using the instrument server” to import the S-parameter file.
CHU Chun San, December 18, 2004 4. In the dataset window, before importing the measured S-parameter file. It is needed to choose the appropriate file type first. In the example, the file type of the S-parameter file is “ICCAP”.
5. Then push the “Browse” button to select the S-parameter. After selected the file, in the space under “Dataset Name”, make a name for the file which is a reference name that will be used in parameter values extraction. In this example, the file name is “V12_CV”. After typing the name, push “Read File”
CHU Chun San, December 18, 2004
6. After read in the the file of measured S-parameter of both the varactor and open-pad. The open-pad structure is basically the probing pad structure surround the device for probing purpose. Before using the varactor S-parameter file to extract capacitance, Q-factor and resistance, De-embedding procedure is needed to carry out in order to exclude the parasitic came from the open-pad structure. The follow equations are used to perform four purposes: (1) De-embedding; (2) Extract capacitance; (3) Extract Q-factor; (4) Extract resistance. Where S0 is the measured varactor Sparameters. Sop is the S-parameters of open-pad structure. Qd is the extracted Q-factor. Cd is the extracted capacitance. Rd is the extracted resistance.
Eqn S0=V12_CV..s_vs_f_MEAS_s_23.S(1,1) Eqn S00=S0 Eqn Z00=stoz(S00) Eqn Y00=stoy(S00) Eqn Sop=VPAD_CV..s_vs_f_MEAS_s_15.S(1,1) Eqn Yop=stoy(Sop) Eqn Y_deemb=Y00-Yop Eqn Z_deemb=ytoz(Y_deemb) Eqn Qd=-im ag(Z_deemb)/real(Z_deemb) Eqn Cd=im ag(Y_deemb)/(2*pi*V9_CV..s_vs_f_MEAS_s_21.freq) Eqn Rd=real(Z_deemb)
7. The following three graphs show the extracted capacitance, Q-factor and resistance respectively from 0.1 GHz up to 5 GHz at a given bias voltage –5.1V. 3E-12
25 20
2E-12
Qm
Cm
15 1E-12
10 5
0
0 -1E-12
-5 0
1
2
3
freq, GHz
4
5
0
1
2
3
freq, GHz
4
5
CHU Chun San, December 18, 2004
30 25
Rm
20 15 10 5 0
1
2
3
4
5
freq, GHz
8. Now, it is the time to build the varactor physical equivalent circuit model. In which the extracted capacitance, Q-factor and resistance should be appear as close as to the trend that shown in previous graphs. The model for a varactor and its components values are shown below:
R R4 R=12810 Ohm
L R L1 R1 Term L=0.094722048 nH R=0.1 Ohm Term1 R= Num=1 Z=50 Ohm
C C3 C=2.912 pF
R R2 R=1.293352 Ohm
R R3 R=5.25 Ohm C C1 C=0.18 pF
C C2 C=23.9528 pF
9. The following equations are used to obtain the capacitance, Q-factor and resistance value from the equivalent circuit as shown above after simulation.
Eqn Ym=stoy(S) Eqn Zm=ytoz(Ym) Eqn Cm=imag(Ym)/(2*pi*freq) Eqn Qm=-imag(Zm)/real(Zm) Eqn Rm=real(Zm)
CHU Chun San, December 18, 2004 10. The following 3 graphs compared the measurement results with the simulation results to see if the model described above is valid to represent the actual extracted capacitance, Q-factor and resistance. 25
3E-12
20
Qd[14,::] Qm
Cd[14,::] Cm
2E-12 1E-12 0 -1E-12
15 10 5 0 -5
-2E-12 0
1
2
3
4
5
0
1
2
3
4
5
freq, GHz
freq, GHz
30
Rd[14,::] Rm
25 20 15 10 5 0 0
1
2
3
4
5
freq, GHz
11. It can be seen that the varactor model gave an accurate representation of the actual varactor measurement results. It should be noted that in order to give an accurate varactor model for other bias voltages, different components values in the equivalent circuit should be used.
Conclusion The procedures starts from extracting device parameters, building physical model and verifying modeling results with actual measurement results are presented. It can be seen that with the powerful multifunctional simulation tool ADS, one stop solution includes measurement data extraction, model simulation and result verification can be done easily and highly reduced the development cycle time.