JOURNAL OF APPLIED PHYSICS
VOLUME 90, NUMBER 12
15 DECEMBER 2001
Bulk electronic structure of SrTiO3 : Experiment and theory K. van Benthema) and C. Elsa¨sser Max-Planck-Institut fu¨r Metallforschung, Seestrasse 92, D-70174 Stuttgart, Germany
R. H. French DuPont Corporation Central Research, E356-384, Exp. Street, Wilmington, Delaware 19880-0356
共Received 5 April 2001; accepted for publication 10 September 2001兲 Valence electron-energy loss spectroscopy 共VEELS兲 in a dedicated scanning transmission electron microscope, vacuum ultraviolet spectroscopy and spectroscopic ellipsometry, and ab initio band structure calculations in the local density approximation have been used to determine the optical properties and the electronic structure of SrTiO3 . Assignments of the interband transitions in the electronic structure of bulk SrTiO3 have been determined quantitatively by comparison of VEELS spectra with vacuum ultraviolet spectra and with the ab initio calculated densities of states. The experimentally determined indirect band gap energy is 3.25 eV, while the direct band gap energy is 3.75 eV. The conduction bands in SrTiO3 correspond to the bands composed of mainly Ti 3d t 2g and e g states, followed at higher energies by the bands of Sr 4d t 2g and e g states, and free electron like states dominating at energies above 15 eV. The upper valence band 共UVB兲 contains 18 electrons in dominantly O 2p states, hybridized with Ti and Sr states, and has a bandwidth of 5 eV. The interband transitions from the UVB to the Ti 3d bands and to the Sr 4d bands give rise to the transitions spanning from the indirect band gap energy of 3.25 eV up to 15 eV. The lower valence band contains 12 electrons in Sr 4p and O 2s states which are separated by 2 eV, while having a bandwidth of 5 eV. The interband transitions from the Sr 4p to the Ti 3d and Sr 4d bands give rise to transition energies spanning from 15 to 24 eV. Interband transitions from the O 2s band to the conduction bands appear at 26 eV. A very narrow band at ⫺33 eV below the top of the valence band is composed of Sr 4s and Ti 3p states and contains eight electrons. © 2001 American Institute of Physics. 关DOI: 10.1063/1.1415766兴
I. INTRODUCTION
Materials crystallizing in perovskite structures are important for a wide range of applications. These include use as dielectric materials in capacitors, as oxygen ion conductors in sensors, as substrates for high T c superconductors, or as piezoelectric materials in actuators.1– 6 A thorough understanding of most of these properties requires the knowledge of the electronic structure of the bulk material. A combined theoretical and experimental approach towards this is presented in this work for the simplest perovskite structure, cubic SrTiO3 . For the analysis of the electronic band structure and the interband transitions we performed valence electron energy-loss spectroscopy 共VEELS兲 in a dedicated scanning transmission electron microscope.7–12 We also performed vacuum ultraviolet 共VUV兲 spectroscopy8 –10,13 and spectroscopic ellipsometry,8 –10 and ab initio band structure calculations in the local density approximation14,15 to determine the electronic structure and optical properties of bulk SrTiO3 . Assignments of the interband transitions were determined quantitatively by comparison of VEELS spectra with VUV spectra and with the ab initio calculated densities of states. Furthermore, the results of the optical spectroscopy methods are compared to results of the VEELS. By this combination of different methods a rather complete understanding of the a兲
Author to whom correspondence should be addressed; electronic mail:
[email protected]
0021-8979/2001/90(12)/6156/9/$18.00
6156
electronic structure of SrTiO3 in the valence electron regime becomes achievable. In the future, this will help us to interpret quantitatively the electronic structure of defects in SrTiO3 , e.g., grain boundaries16 and metal/SrTiO3 interfaces. II. METHODS A. Vacuum ultraviolet spectroscopy and spectroscopic ellipsometry
1. Sample preparation
The optical spectroscopy measurements were performed on undoped and 0.14 wt % Fe-doped SrTiO3 single crystals, which were grown by the Verneuil method.17 The crystals of 10⫻10⫻0.5 mm3 size were heat treated for 2.5 h at 950 °C in an oxygen atmosphere in order to anneal oxygen vacancies, and then were diamond polished in a 共100兲 surface orientation. 2. Spectroscopic ellipsometry
Spectroscopic ellipsometry was performed with a Woollam 193/DUV instrument, which covers an energy range from 1.13 to 6.67 eV 共1100–186 nm wavelengths兲, and employs MgF2 polarizers and analyzers instead of the more common calcite optics. The spot diameter at the sample is 2 mm. The instrument measures the ellipsometric parameters ⌿ and ⌬, defined by Eq. 共1兲 © 2001 American Institute of Physics
Downloaded 21 Dec 2001 to 52.128.30.10. Redistribution subject to AIP license or copyright, see http://ojps.aip.org/japo/japcr.jsp
J. Appl. Phys., Vol. 90, No. 12, 15 December 2001
tan共 ⌿ 兲 e ⌬•i ⫽
RP , RS
van Benthem, Elsasser, and French
6157
共1兲
where R P /R S is the complex ratio of the p- and s-polarized components of the reflected amplitudes. Ellipsometric measurements were conducted using light incident on the front surface of the film. This sample configuration requires the back surface of the quartz substrate to be roughened mechanically to eliminate the depolarizing effects of back-surface reflections in the substrate. Front side ellipsometric measurements on samples in this configuration were obtained with light incident at angles of 60°, 70°, and 80° relative to the sample’s surface normal directions. 3. Vacuum ultraviolet spectroscopy Data acquisition. The VUV spectrophotometer, whose details have been discussed previously,18,19 utilizes a laser plasma light source and iridium reference mirrors. The energy range of the instrument is from 1.7 to 44 eV, or from wavelengths of 700–28 nm, which extends beyond the air cutoff of 6 eV and the window cutoff of 10 eV. The wavelength resolution of the instrument is 0.2–0.6 nm, which corresponds to energy resolutions of 16 meV at 10 eV and 200 meV at 35 eV. Data analysis. VUV reflectivity measurements were performed in order to determine the complex dielectric function ⑀ ⫽ ⑀ 1 ⫹i ⑀ 2 , which is accessible after a fast Fourier transform-based Kramers–Kronig dispersion analysis20–22 of the reflectivity data. From the dielectric function, the interband transition strength J cv is calculated according to
m 20
E2 i 共 ⑀ 2 共 E 兲 ⫹i ⑀ 1 共 E 兲兲 , J cv⫽J cv1 ⫹iJ cv2 ⫽ 2 2 e ប 82
共2兲
where m 0 is the electron mass, e its charge, and E the energy. J cv1 ⫽Re关Jcv兴 corresponds to the joint densities of states. The effective number of electrons n eff contributing to transitions up to the energy E can be calculated using the oscillator strength, or f-sum rule,23,24 evaluated for J cv1 : n eff共 E 兲 兩 Jcv1 ⫽
4v f m0
冕
E
0
J cv1 共 E ⬘ 兲 dE ⬘ , E⬘
共3兲
where v f is a characteristic volume of material, corresponding in the present work to one chemical formula unit of SrTiO3 which has a volume of 59.55 Å3. B. Transmission electron microscopy „TEM…
1. Sample preparation
As starting material 0.14 wt % Fe-doped SrTiO3 single crystals were used, which were grown by the Verneuil method. The TEM specimen preparation was similar to the procedure described by Strecker et al.25 Ion beam thinning was performed using a Gatan Pips at 3.5 kV acceleration voltage for Ar⫹ ions and a tilt angle of 6° of the incoming beam with respect to the specimen surface. After perforation the specimen was further ion milled at 2.0 kV with the same tilt angle to remove most of the damage of the specimen surfaces. In order to decrease contamination effects during electron beam illumination the specimens were heat treated
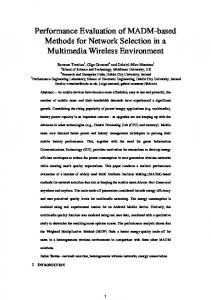
FIG. 1. Valence electron energy-loss spectrum of bulk SrTiO3 , the extracted zero-loss peak, and the corresponding single-scattering spectrum after Fourier-log deconvolution 共SSD兲. The specimen thickness was t/⌳ ⫽2.475. ⌳ denotes the inelastic mean free path.
inside the microscope’s airlock for 20 min prior to insertion into the microscope. This procedure considerably reduced the growth of carbon contamination layers on electron irradiated areas. The specimen thickness ranged from 2.0 to 2.5 times the value of the inelastic mean free path ⌳ to minimize influences of surface plasmons and effects by contamination or beam damage due to specimen preparation. 2. Data acquisition
The VEELS measurements were performed with a Gatan parallel electron energy-loss spectrometer 共PEELS766兲 attached to a VG HB501 UX dedicated scanning transmission electron microscope operating at 100 kV. The beam current was reduced to less than 1 nA in order to improve the energy resolution to 0.6 eV full width half maximum of the zeroloss peak. The electron probe size was smaller than 1 nm. Spectra were acquired using a dispersion of 0.095 eV/ channel in order to record spectra up to an energy-loss of 90 eV. The convergence semiangle was chosen to be equal to the collection semiangle, which was given to be 6.5 mrad by the PEELS aperture of 2 mm. Therefore the energy-loss functions had to be corrected because of the large convergence angle, which was done by the CONCOR program.23 All spectra were corrected for dark currents of the photodiode array. Significant influences of detector gain variations on the analyzed data were not observed. Data acquisition with the PEELS detector was performed with the Gatan DigitalMicrograph 3.3 Spectrum Imaging software using a Macintosh PowerPC. Since the dynamic range of the detector is 16 bits, the simultaneous acquisition of the zero-loss peak and the plasmon-loss peaks with good signal to noise ratio became possible. 3. Data analysis
For each energy-loss spectrum the center of the zero-loss peak was fitted by a Lorentzian for the zero energy calibration. Subsequently, the spectra were corrected for multiple scattering events by Fourier-log deconvolution23 共see Fig. 1兲.
Downloaded 21 Dec 2001 to 52.128.30.10. Redistribution subject to AIP license or copyright, see http://ojps.aip.org/japo/japcr.jsp
6158
J. Appl. Phys., Vol. 90, No. 12, 15 December 2001
During this procedure the wings of the zero-loss peak were fitted separately with an asymmetric Pearson VII line shape.8 The fitting was performed over the intensity range up to 50% of the height of the zero-loss peak. For energies lower than 3.4 eV, i.e., close to the optical band gap energy of SrTiO3 共3.2 eV,26 3.1 eV兲,27–29 no transitions are expected and therefore the intensity of the single scattering deconvoluted spectrum below this value is set to zero12 共cf. Fig. 1兲. Cerenkov radiation apparently does not play an important role since VUV and VEELS exhibit the same line shape. Influences of a variation of the cutoff energies within ⫾0.3 eV were found to be negligible. The energy loss function 共ELF兲, which is given by the double differential cross section d 2 /dE d⍀ of inelastic electron scattering, is proportional to Im共⫺1/⑀兲,23 where ⑀ ⫽ ⑀ 1 ⫹i ⑀ 2 is the complex dielectric function. The real part of the dielectric function Re关⫺1/⑀兴 was obtained by a Kramers–Kronig transformation. Therefore the spectra were extrapolated up to 1000 eV on the high-energy side. For a correct scaling of J cv determined from VEELS, the f-sum rule was used with the refractive index n⫽2.37 for Fe doped SrTiO3 as determined by spectroscopic ellipsometry.16 The analysis of the spectra was done with electronic structure tools,30 including the VEELS, CONCOR, and KKEELS programs.
van Benthem, Elsasser, and French
FIG. 2. Complex index of refraction nˆ ⫽n⫹ik, for bulk SrTiO3 extracted from spectroscopic ellipsometry. For comparison, data from Palik’s Handbook of Optical Constants 共Ref. 38兲 are included 共dashed line shapes兲.
C. Band structure calculations
Self-consistent ab initio band structure calculations based on the density functional theory14,15 were performed in the local density approximation 共LDA兲,31,32 using normconserving pseudopotentials for core-valence states and a mixed basis of localized wave functions and plane waves for the representation of valence states.33–36 We used the cubic unit cell of the perovskite structure, containing one strontium, one titanium, and three oxygen atoms. Site projected densities of states 共PDOS兲 were obtained from the Kohn–Sham eigenstates on a cubic mesh of 8⫻8⫻8 k points in the first Brillouin zone by projection onto partial waves in spheres centered at the atomic sites of Sr, Ti, and O. The energy E F 共Fermi energy兲 of the highest occupied one-electron state at the valence band edge is taken as the energy zero. Projection radii were chosen as 2.607 bohr 共1 bohr⫽0.529 Å兲 for Sr, 1.525 bohr for Ti, and 2.840 bohr for O. With these radii, the atomic spheres contain the formal ionic charges, i.e., ⫹2 for Sr, ⫹4 for Ti, and ⫺2 for O, respectively. The results of the calculations will be discussed in Sec. III C. III. RESULTS
In the following subsections the results of optical spectroscopies 共VUV and ellipsometry兲 and VEELS are presented and compared to each other. Subsequently the ab initio calculated densities of states are discussed.
Constants.38 The real part of the index of refraction of these samples of SrTiO3 in the range of visible light is n⫽2.37. In the literature values are reported to vary from 2.20 to 2.66 due to variations in the composition or lattice strains of the SrTiO3 specimens.12 Direct and indirect band gap energies 共cf. Table I兲 were determined by linear fits to the optical absorption coefficient ( ␣ ⫽4 k ⫺1 ), which was calculated from the ellipsometrically determined extinction coefficient. Here, k denotes the wave vector and the wavelength. These band gap energies can vary depending on the range of absorption coefficients used in the linear fit.39 The direct band gap of SrTiO3 of 3.75 eV was determined as the intercept of a linear fit line to a plot of ␣ 2 E 2 versus energy E for the absorption coefficient in the range of 120 000 cm⫺1⬍␣⬍300 000 cm⫺1. The indirect band gap of SrTiO3 of 3.25 eV was determined as the intercept of the linear fit line to a plot of ␣ ⫺1/2 versus energy for the absorption coefficient in the range of 2000 cm⫺1⬍␣⬍45 000 cm⫺1. In Fig. 3 the reflectance measured by VUV spectroscopy is plotted versus energy. In Figs. 3– 8 the results of two independent measurements are plotted to show the reliabilities of the spectral shapes with respect to both the experimental data acquisition and the numerical Kramers–Kronig transformations. By the Kramers–Kronig dispersion analysis the interband transition strength J cv is determined and the real part
A. VUV spectroscopy and spectroscopic ellipsometry
The optical functions of SrTiO3 were first determined from spectroscopic ellipsometry by solving the Fresnel equations for an adjustable parameter optical model representing the bulk crystal.37 Figure 2 shows the complex index of refraction (nˆ ⫽n⫹ik) determined by spectroscopic ellipsometry in comparison to data from Palik’s Handbook of Optical
TABLE I. Indirect and direct band gap energies 共in eV兲 determined from spectroscopic ellipsometry and from the LDA band structure calculations. Band gap indirect direct
Ellipsometry
LDA band structure
3.75 3.25
1.89(R→⌫) 2.22(⌫→⌫)
Downloaded 21 Dec 2001 to 52.128.30.10. Redistribution subject to AIP license or copyright, see http://ojps.aip.org/japo/japcr.jsp
J. Appl. Phys., Vol. 90, No. 12, 15 December 2001
van Benthem, Elsasser, and French
6159
FIG. 5. Re关Jcv兴 from EELS in comparison to Re关Jcv兴 from VUV spectroscopy. FIG. 3. Reflectance from VUV spectroscopy and from VEELS.
extracted from two independent measurements is plotted in Fig. 4 for energies up to 15 eV. The interband transition strength calculated from the complex index of refraction determined from ellipsometry is also included in Fig. 4. The ellipsometry spectra as well as the VUV spectra show wellresolved peaks labeled A 2 共4.9/4.8 eV兲 and A 4 共6.3 eV兲 and two corresponding shoulders labeled A 1 共4.2 eV兲 and A 3 共5.4/5.3 eV兲. At energies between 7 and 15 eV, beyond the energy range of ellipsometry, the VUV data show three clearly resolved peaks at 9.1, 9.9, and 11.9 eV, labeled B 1 , B 2 , and C, respectively. In addition, two weaker features labeled D 1 共12.9 eV兲 and D 2 共13.7 eV兲 are visible. Although absolute intensities can vary in different experimental spectra determined by one technique 共cf. peaks A i and B i 兲, the over-
FIG. 4. Re关Jcv兴 from VUV spectroscopy and spectroscopic ellipsometry 共dashed curves extending to 7 eV兲 in comparison to Re关Jcv兴 from VEELS.
all line shapes are the same, reflecting identical sets of interband transitions. At higher energies 共cf. Fig. 5兲 the VUV spectra exhibit transitions at 16.4 eV (E 1 ), 19.7 eV (E 2 ), 21.7 eV (E 3 ), 24.2 eV (E 4 ), 26.4 eV (F 1 ), and 27.4 eV (F 2 ). Above 32 eV the signal to noise ratio in the VUV measurement is diminishing due to low absolute levels of the reflected signal, which makes peak identifications unreliable in this energy range. All peak energies from the different experimental techniques are listed in Table II. From the VUV data we have calculated the oscillator strength f-sum rule, which gives information about how many valence electrons are involved into transitions up to a specific energy. The results of these calculations for the same independent experiments are given in Fig. 6.
FIG. 6. f-sum rule from EELS and VUV spectroscopy.
Downloaded 21 Dec 2001 to 52.128.30.10. Redistribution subject to AIP license or copyright, see http://ojps.aip.org/japo/japcr.jsp
6160
J. Appl. Phys., Vol. 90, No. 12, 15 December 2001
van Benthem, Elsasser, and French
Once any of the complex optical functions is determined from Kramers–Kronig dispersion analysis, any other optical property can be calculated numerically. Therefore, we calculate the reflectance from the VEELS results for comparison. The result of VEELS and VUV reflectance data is given in Fig. 8. The index of refraction and the f-sum rule, both calculated from the VEELS data, are included in Figs. 9 and 6, respectively. C. Band structure
FIG. 7. Energy-loss function from VEELS in comparison to VUV spectroscopy up to an energy loss of 85 eV.
B. VEELS
In Fig. 7 the two ELFs from two independent measurements at different specimen areas are plotted. The zero-loss peak is already subtracted. The interband transition strengths Re关Jcv兴 obtained from the ELF by Kramers–Kronig transformations are shown in Figs. 4 and 5. In the low energy region 共⬍15 eV兲 only the peaks labeled A 2 , A 4 , B 2 , C, and two weak shoulders at the positions of peaks D 1 and D 2 are observable. This is due to the limited energy resolution and relatively low signal to noise ratio in the VEEL spectra in this energy range. At higher energies the shoulders E 1 , E 2 , E 3 , E 4 , F 1 , and F 2 , were resolved at similar energies as in the VUV spectra 共cf. Table II兲. Two additional features labeled G and H can be observed at 37.5 and 45.5 eV, respectively, which were not detectable by VUV spectroscopy.
The interband transition strength Re关Jcv兴 corresponds to transitions from occupied valence states of the material into the unoccupied conduction states. By a comparison of the transition energies extracted from Re关Jcv兴 to the band structure and to the density of states, assignments of the orbital origins of these interband transitions can be made. For a quantitative comparison of the band structure calculations with the experimentally determined interband transition strength, transition matrix elements would have to be included in the theoretical ELF, which has not been done in this work. Band structure calculations for SrTiO3 have been performed by several authors 共see e.g., Refs. 39– 44兲. Figure 10 shows the calculated band structure for SrTiO3 . By a projection of this band structure onto the atomic sites of O, Ti, and Sr, site PDOSs are derived, which are plotted in Fig. 11. In the band structure and the densities of states, all energies are referred relative to a zero of energy at the top of the valence band. The occupied bands from which interband transitions originate are the Ti 3s levels at ⫺56 eV, Ti 3p, and Sr 4s levels at ⫺33 eV, the Sr 4p levels at ⫺14.7 eV, and the O 2s and O 2p levels at ⫺16.6 eV and ⫺5.0 to ⫺0.5 eV. The most prominent unoccupied energy bands in the conduction band are composed of Ti 3d t 2g 共⫹1.0–⫹4.5 eV兲, Ti e g 共⫹4.5–9.0 eV兲, and Sr 4d 共⫹5–⫹12 eV兲 levels as well as various empty O 2p levels. The indirect and the direct band gap energies of SrTiO3 determined from the band structure calculations are 1.89 and 2.22 eV, respectively, which underestimates the experimentally determined indirect gap energy of 3.2 eV and the direct gap energy of 3.75 eV by about 1.5 eV. This is well known for calculations in the LDA.44 These results are in good agreement with theoretical LDA results from Cappelini et al.44 who calculated values of 1.90 and 2.24 eV for the indirect and the direct band gap, respectively. In the following discussion the unoccupied density of states is shifted ad hoc by 1.5 eV toward higher energies 共by a ‘‘scissors’’ operation兲 to compensate for this systematic error of the LDA. IV. DISCUSSION
FIG. 8. Reflectance from VEELS in comparison to VUV spectroscopy up to an energy of 85 eV.
In this section the experimentally observed interband transitions are discussed in detail. Assignments of the spectral features of the interband transition strength, which are tabulated in Table II, are developed in the context of distinct interband transitions from occupied valence bands and shallow core levels to the unoccupied conduction bands, using atomic-orbital and symmetry characters in the corresponding energy bands plotted in Fig. 10. On this basis, a schematic energy level diagram will be developed, which is plotted in
Downloaded 21 Dec 2001 to 52.128.30.10. Redistribution subject to AIP license or copyright, see http://ojps.aip.org/japo/japcr.jsp
J. Appl. Phys., Vol. 90, No. 12, 15 December 2001
van Benthem, Elsasser, and French
6161
TABLE II. Interband transition energies 共in eV兲 for bulk SrTiO3 as determined from spectroscopic ellipsometry, VUV spectroscopy, VEELS, and local density functional theory 共LDFT兲. Transitions are labeled as in Figs. 4 and 5, with p denoting a peak and s a shoulder. Transition energies reported by Ba¨uerle et al.13 are also given. Transition A1 A2 A3 A4 B1 B2 C D1 D2 E1 E2 E3 E4 F1 F2 G H
Assignment
Type Ellipsometry VUV spectroscopy VEELS LDFT Experimenta
Transitions from the O 2p UVB O 2p⇒Ti 3d t 2g s 4.2 4.2 ¯ O 2p⇒Ti 3d t 2g p 4.9 4.8 5.0 O 2p⇒Ti 3d t 2g s 5.4 5.3 ¯ O 2p⇒Ti 3d t 2g p 6.3 6.3 6.4 O 2p⇒Ti 3d e g p ¯ 9.1 O 2p⇒Ti 3d e g p ¯ 9.9 9.7 p ¯ 11.9 11.8 O 2p⇒,Ti 3d e g , Sr 4d t 2g O 2p⇒Sr 4d t 2g s ¯ 12.9 12.7 O 2p⇒Sr 4d e g s ¯ 13.7 13.2 Transitions predominantly from the O 2s, Sr 4p lower valence band Sr 4p⇒Ti 3d t 2g s ¯ 16.4 16.1 Sr 4p⇒Ti 3d e g s ¯ 19.7 18.7 Sr 4p⇒Sr 4d t 2g s ¯ 21.7 21.7 Sr 4p⇒Sr 4d e g s ¯ 24.2 23.6 s ¯ 26.4 26.1 O 2s⇒Ti 3d, Sr 4d s ¯ 27.4 27.3 O 2s⇒Ti 3d, Sr 4d Transitions predominantly from the Sr 4s, Ti 3p shallow core level s ¯ ¯ 37.5 Sr N 1 edge, Sr 4s⇒O 2p p ¯ ¯ 45.5 Ti M 2,3 edge, Ti 3p⇒ Ti 3d, Ti 4s, Sr 4d
¯ 5.1 ¯ 6.7 9.7 11.8
4.0 4.86 5.5 6.52 9.2 10.2共9.9兲 12.0
¯ 13.1
13.0–13.8 13.0–13.8
16.7 20.0 ¯
16.4 19.6 ¯
a
See Ref. 13.
Fig. 12. Subsequently, the results of the different experimental techniques will be compared. Since the transition energies extracted from VUV spectroscopy and VEELS differ in several spectral features, the transition energies extracted from the optical results are used whenever possible for the assignments since the energy resolution of the VUV spectra is higher than that of the VEELS data. Finally a comparison to previous data from the literature will be made.
FIG. 9. Index of refraction n and extinction coefficient k from VEELS 共data extending to 85 eV兲 and VUV spectroscopy 共data ending at 45 eV兲.
FIG. 10. Band structure of SrTiO3 calculated ab initio in the local density approximation.
Downloaded 21 Dec 2001 to 52.128.30.10. Redistribution subject to AIP license or copyright, see http://ojps.aip.org/japo/japcr.jsp
6162
J. Appl. Phys., Vol. 90, No. 12, 15 December 2001
van Benthem, Elsasser, and French
observe that according to the f-sum rule only 30 electrons have undergone interband transitions with transition energies up to 85 eV. C. Transitions from the upper valence band „A, B, C, and D…
In Fig. 4, the J cv peaks labeled A 1 – A 4 below 7 eV originate from transitions of O 2p electrons into Ti 3d t 2g conduction bands, while transitions B 1 and B 2 correspond to O 2p to Ti 3d e g excitations. Peak C at 11.9 eV has a mixed character of O 2p→Ti 3d e g and O 2p→Sr 4d t 2g transitions, whereas the two shoulders D 1 and D 2 at 12.9 and 13.7 eV are due to O 2 p→Sr 4d t 2g and e g transitions, respectively. Further transitions can be extracted from the calculated densities of states than those visible in the experimental spectra plotted in Fig. 4, since the effect of the experimental energy resolution causes some broadening of the transition peaks. D. Transitions from the lower valence band „ E , F … FIG. 11. Calculated total density of states 共DOS兲 for SrTiO3 and site projected DOS for oxygen, titanium, and strontium, respectively.
A. UV optical constants and band gaps
The UV optical constants reported in Fig. 2 show features comparable to those reported in Palik’s Handbook of Optical Constants of Solids,38 but the transition energies found here exhibit a shift to higher energies. Frye et al.45,46 have observed a similar shift of features in the UV optical constants toward higher energies due to prior thermal treatments and changes in the oxidation or reduction of SrTiO3 . The band gaps fitted by Frye et al. to Palik’s data give direct and indirect band gap energies of 3.52 and 3.28 eV, while their results show direct band gap energies ranging from 3.58 to 3.90 and indirect band gap energies of 3.00–3.77 eV. The direct and indirect band gap values found in this work of 3.75 and 3.25 eV, respectively, fall within the range of variability seen by Frye et al.45,46 for SrTiO3 . B. Valence electron counts in SrTiO3
When utilizing the oscillator-strength or f-sum rule to count the electrons involved in interband transitions, it is important to understand the expected number of electrons in the material. For SrTiO3 the upper valence band 共UVB兲 has 18 electrons in total originating from three oxygen atoms per unit cell each with six 2p electrons. The lower valence band 共LVB兲 is filled with 12 electrons in total, composed of three oxygen atoms with six oxygen 2s and six 4p electrons of one Sr atom. The highest core level contains eight electrons arising from two Sr 4s and six Ti 3p electrons. The next lower core level consists of two electrons arising from Ti 3s electrons. Altogether, this adds up to 40 electrons, which might be expected to result as well from the f-sum rule evaluated to 85 eV. This has been done in the current work from the VEELS data and the result is given in Fig. 6. We
In Fig. 5, at transition energies of 16.4 eV (E 1 ) and 19.7 eV (E 2 ) the interband transition strengths determined by VEELS and VUV spectroscopy exhibit two shoulders which are due to Sr 4p to Ti 3d t 2g and e g transitions, respectively. A spin-orbit splitting of the Sr 4p levels by 0.6 eV, which would occur as a splitting of E 1 and E 2 , could not be resolved with any of the applied experimental techniques due to the limited energy resolution. Since the occupied O 2p and Sr 4p levels are separated by 10–13 eV and peaks C and E 3 differ by approximately 10 eV, we can assign the weak features observable in the J cv spectra at 21.7 eV (E 3 ) and at 24.2 eV (E 4 ) to Sr 4 p to Ti 3d t 2g and e g , transitions, respectively. Peaks F 1 and F 2 energetically correspond to O 2s to Ti 3d and Sr 4d levels. Since the initial states of these transitions are at different atomic sites than the final states, such transitions do not violate selection rules for dipole transitions. E. Shallow core level transitions „ G , H …
Peaks G and H appearing in the J cv spectra from VEELS data in Fig. 5 at 37.5 and 45.5 eV, respectively, which could not be resolved by VUV, are due to shallow core-level excitations. Although peak G at 37.5 eV is a weak spectral feature, which is not clearly resolved, it is most likely due to a Sr 4s→O 2p transition 共cf. Fig. 11兲 and can be assigned to the Sr N 1 absorption edge.23,47 Also a Ti 3p→O 2p transition is possible since the initial and the final state of this transition belong to different atomic sites. Peak H can be identified with the Ti M 2,3 edge,47 and arises from transitions from Ti 3 p→Ti 4s, Ti 3d and Sr 4d conduction bands. The energetic shift of 1.5 eV toward lower energy losses in comparison to the metallic Ti edge47 is due to the oxidation state of Ti in SrTiO3 , which was also observed in bulk TiO2 . 47 F. Schematic energy level description
From the assignments the different transition energies 共cf. Table II兲 extracted from the J cv spectra 共cf. Figs. 4 and 5兲
Downloaded 21 Dec 2001 to 52.128.30.10. Redistribution subject to AIP license or copyright, see http://ojps.aip.org/japo/japcr.jsp
J. Appl. Phys., Vol. 90, No. 12, 15 December 2001
van Benthem, Elsasser, and French
6163
Table II, the transition energies are reproduced by both experimental methods within an accuracy of ⫾0.15 and ⫾0.4 eV for peaks and shoulders, respectively. However, the energy resolution in the VUV spectroscopy is better by a factor of 3 than in the energy-loss spectroscopy. Here, the appearance of new electron sources in electron microscopy and the development of monochromators will provide better energy resolutions. H. Comparison to results from the literature
FIG. 12. Schematic energy level diagram for bulk SrTiO3 . The transitions from the valence band into the conduction band assigned in this work are plotted according to Table II. Energies are taken from the band structure and DOS calculations and are calibrated with respect to the energy zero at the top of the valence band.
to distinct transition processes, a schematic energy level diagram is constructed, which is plotted in Fig. 12. G. Comparison of the different experimental approaches
Spectroscopic ellipsometry as well as vacuum ultraviolet and valence electron energy-loss spectroscopy are able to measure the interband transition strength of the investigated material through either Fresnel analysis 共for ellipsometry兲 or Kramers–Kronig dispersion analysis on the experimental data. By the Kramers–Kronig analysis, all VEELS data can be used to determine any of the complex optical properties. In the same way, the single scattering energy-loss functions can be calculated from the optical spectra. The peak energies in the J cv spectra obtained by VEELS and VUV spectroscopy are the same within uncertainties of ⫾0.2 eV and reproduce results from previous VUV spectroscopy investigations.13 The optical spectroscopy methods are very sensitive in the low energy region below 15 eV since the optical reflectivity provides high intensities in this regime. The EELS data are susceptible to artifacts due to fitting and subtraction of the zero-loss peak. Above 15 eV where the optical signals become weak, VEELS is superior, provided that the single scattering deconvolution is done appropriately. The Kramers–Kronig analysis performed on VEELS data is much more reliable than for the optical spectra because the energy data region can be much larger for EELS. This becomes important if core edges appear at transition energies that are higher than those accessible in the optical spectroscopy. As mentioned earlier, the transition energies extracted from the VUV spectra and VEELS data differ in several peaks. Averaging the differences in peak energies given in
In a previous study Ba¨uerle and co-workers13 examined the band structure of SrTiO3 by VUV spectroscopy experiments and compared these results to band-structure calculations by Mattheiss.39 Ba¨uerle also provided a schematic energy level diagram,13 but only assigned transitions from the O 2 p to Ti 3d levels. The results of Ba¨uerle et al.13 are given in Table II and correspond to the transitions labels A ⬙ to E found in this work within tolerances of ⫾0.3 eV. Ryen et al.12 showed that the interband transition strength determined by valence electron energy-loss spectroscopy is sensitive to local stresses in SrTiO3 . In a previous article we have investigated the electronic structure of a near ⌺13 grain boundary in SrTiO3 . 16 LDA calculations of SrTiO3 band structures and dielectric properties have been done by several authors39– 44 and are in good agreement with our LDA calculations. V. CONCLUSIONS
Electronic structure investigations of Fe-doped SrTiO3 were performed by VEELS and optical VUV spectroscopy and spectroscopic ellipsometry. The experimentally determined interband transition energies were assigned to distinct interband transitions by comparison to calculated band structures and densities of states, which were obtained in the LDA. By this combination of two different experimental techniques with first-principles electronic structure calculations a schematic energy level diagram for bulk SrTiO3 was constructed. The conduction bands in SrTiO3 correspond to the bands composed mainly of Ti 3d t 2g and e g bands, followed at higher energies by the bands of Sr 4d t 2g and e g states, and free electron like bands dominating at energies from 15 eV above the valence band maximum on. The upper valence band 共UVB兲 consists of 18 electrons in dominantly O 2p states, hybridized with Ti and Sr states, and has a bandwidth of 5 eV. The interband transitions from the UVB to the Ti 3d t 2g and e g bands and to the Sr 4d t 2g and e g bands give rise to the transitions A through D, which span from the indirect band gap top energy of 3.25 up to 15 eV. At 15 eV the f-sum rule yields that eight of the valence electrons have undergone interband transitions. The lower valence band 共LVB兲 consists of 12 electrons in Sr 4p and O 2s states, which are separated by 2 eV, and the bandwidth is 5 eV. The interband transitions from the Sr 4p to the Ti 3d and Sr 4d bands give rise to the transitions E, which span from 15 to 24 eV. Interband transitions from the O 2s band to the conduction bands F appear at 26 eV. According to the f-sum rule, at 30 eV 10–12 electrons from
Downloaded 21 Dec 2001 to 52.128.30.10. Redistribution subject to AIP license or copyright, see http://ojps.aip.org/japo/japcr.jsp
6164
J. Appl. Phys., Vol. 90, No. 12, 15 December 2001
the LVB have undergone interband transitions, bringing the f-sum rule to 18 –20 electrons for both LVB and UVB. The very narrow band at ⫺33 eV below the top of the valence band is composed of Sr 4s and Ti 3 p states and contains eight electrons. It can be considered as shallow core levels, and gives rise to transitions G and H, a Sr N 1 and a Ti M 2,3 edge, with a transition energy of 45 eV. At 60 eV an additional six electrons have undergone interband transitions, bringing the f-sum rule to 26 electrons. Our results are in good agreement with available data from previous studies in the literature. In the energy range below 15 eV the optical spectroscopy is superior to VEELS because in spectroscopic ellipsometry high intensities could be recorded, whereas the VEELS data are susceptible to artifacts due to fitting of the zero-loss peak in this regime. Above 15 eV VEELS is superior because high counting statistics could be achieved by this technique. Moreover, above 32 eV the detector used for measurements of VUV spectra in this work provides low signal to noise ratios in the optical spectroscopy. In particular VEELS data were acquired up to energies of 90 eV, which makes the Kramers–Kronig analysis much more reliable, especially when core absorption edges like the Ti M 2,3 and Sr N 1 edges occur in the energy range, which is not accessible by VUV. VUV spectroscopy and measurements of 0.14 wt % Fedoped and undoped SrTiO3 showed exactly the same results in the ELFs and the J cv spectra due to the small doping level. Therefore the electronic structure of SrTiO3 seems to be unchanged by this amount of Fe doping. ACKNOWLEDGMENTS
The authors acknowledge L. DeNoyer for the development and her constant improvement of the electronic structure tools in the experimental analysis. W. Sigle is gratefully acknowledged for many helpful discussions and a critical reading of the manuscript. Thanks are also due to U. Ta¨ffner for the specimen preparation for the VUV spectroscopy experiments and to M. Ru¨hle for his constant support and his interest in the forthcoming project. T. K. Gupta, J. Am. Ceram. Soc. 73, 1817 共1990兲. V. Ravikumar, R. P. Rodrigues, and V. P. Dravid, J. Phys. D 29, 1799 共1996兲. 3 N. D. Browning, J. P. Buban, H. O. Moltaji, S. J. Pennycook, G. Duscher, U. D. Johnson, P. R. Rodrigues, and V. P. Dravid, Appl. Phys. Lett. 74, 2638 共1999兲. 4 F. Ernst, O. Kienzle, and M. Ru¨hle, J. Eur. Ceram. Soc. 19, 665 共1999兲. 5 D. A. Crandles, B. Nicholas, C. Dreher, C. C. Homes, A. W. McConnell, B. P. Clayman, W. H. Gong, and J. F. Greedan, Phys. Rev. B 59, 12842 共1999兲. 6 M. Leonhardt, J. Jamnik, and J. Maier, Electrochem. Solid State Lett. 2, 333 共1999兲. 7 Z. L. Wang, Micron 27, 265 共1996兲. 8 A. D. Dorneich, R. H. French, H. Mu¨llejans, S. Loughin, and M. Ru¨hle, J. Microsc. 191, 286 共1998兲. 1 2
van Benthem, Elsasser, and French 9
R. H. French, H. Mu¨llejans, D. J. Jones, G. Duscher, R. M. Cannon, and M. Ru¨hle, Acta Mater. 46, 2271 共1998兲. 10 R. H. French, H. Mu¨llejans, and D. J. Jones, J. Am. Ceram. Soc. 81, 2549 共1998兲. 11 L. Normand and A. Thorel, Proceedings of the 14th International Congress on Electron Microscopy 共ICEM-14兲, Cancun, Mexico, 1998, p. 625. 12 L. Ryen, X. Wang, U. Helmersson, and E. Olsson, J. Appl. Phys. 85, 2828 共1999兲. 13 D. Ba¨uerle, W. Braun, V. Saile, G. Spru¨ssel, and E. E. Koch, Z. Phys. B 29, 179 共1978兲. 14 P. Hohenberg and W. Kohn, Phys. Rev. 136, 864 共1964兲. 15 W. Kohn and L. J. Sham, Phys. Rev. 140, 1133 共1965兲. 16 K. van Benthem, R. H. French, W. Sigle, C. Elsa¨sser, and M. Ru¨hle, Ultramicroscopy 86, 303 共2001兲. 17 O. Kienzle, Doctoral thesis, Universita¨t Stuttgart, Stuttgart 1999 共in German兲. 18 R. H. French, Phys. Scr. 41, 404 共1990兲. 19 M. L. Bortz and R. H. French, Appl. Phys. Lett. 55, 1955 共1989兲. 20 H. A. Kramers, Atti Congr. Int. Fis. Como. 2, 545 共1927兲. 21 R. Kronig, J. Opt. Soc. Am. 12, 547 共1926兲. 22 R. H. French, D. J. Jones, H. Mu¨llejans, S. Loughin, A. D. Dorneich, and P. F. Carcia, J. Mater. Res. 14, 4337 共1999兲. 23 R. F., Egerton, Electron Energy-Loss Spectroscopy in the Electron Microscope, 2nd ed. 共Plenum, New York, 1996兲. 24 D. Y., Smith, in Handbook of Optical Constants of Solids, edited by E. D. Palik 共Academic, New York, 1985兲, p. 35. 25 A. Strecker, U. Salzberger, and J. Mayer, Prakt. Metallogr. 30, 482 共1993兲. 26 M. Cardona, Phys. Rev. 140, 651 共1965兲. 27 R. Waser, T. Baiatu, and K.-H. Ha¨rtl, J. Am. Ceram. Soc. 73, 1645 共1990兲. 28 R. Waser, T. Baiatu, and K.-H. Ha¨rtl, J. Am. Ceram. Soc. 73, 1654 共1990兲. 29 R. Waser, T. Baiatu, and K.-H. Ha¨rtl, J. Am. Ceram. Soc. 73, 1663 共1990兲. 30 The Electronic Structure Tools 共EST兲 consist of a number of programs for the quantitative analysis of optical, VUV, and VEELS spectra. It has been developed under Grams, a PC based spectroscopy environment. EST is available from Deconvolution and Entropy Consulting, 755 Snyder Hill Road, Ithaca NY 14850 Phone: 607-272-0645, http://www.deconvolution.com, electronic mail:
[email protected]; Grams is available from Galactic Industries, 325 Main St. Salem NH 03079, http://www.galactic.com 31 D. M. Ceperly and B. J. Alder, Phys. Rev. Lett. 45, 566 共1980兲. 32 J. P. Perdew and A. Zunger, Phys. Rev. B 23, 5048 共1981兲. 33 S. G. Louie, K. M. Ho, and M. L. Cohen, Phys. Rev. B 19, 1974 共1979兲. 34 C. L. Fu and K. M. Ho, Phys. Rev. B 28, 5480 共1983兲. 35 C. Elsa¨sser, N. Takeuchi, K. M. Ho, C. T. Chan, P. Braun, and M. Fa¨hnle, J. Phys.: Condens. Matter 2, 4371 共1990兲. 36 B. Meyer, Doctoral thesis, Universita¨t Stuttgart, 1998 共in German兲. 37 B. Johs, R. H. French, F. D. Kalk, W. A. McGahan, and J. A. Woollam, Proc. SPIE 2253, 1098 共1994兲. 38 Handbook of Optical Constants of Solids II, edited by E. D. Palik 共Academic, San Diego, CA, 1991兲. 39 L. F. Mattheis, Phys. Rev. B 6, 4718 共1972兲. 40 S. G. Louie, J. R. Chelikowski, and M. L. Cohen, Phys. Rev. Lett. 34, 155 共1975兲. 41 Y.-N. Xu, W. Y. Ching, and R. F. French, Ferroelectrics 111, 23 共1990兲. 42 F. M. F. de Groot, J. Faber, J. J. M. Michiels, M. T. Czyzyk, M. Abbate, and J. C. Fuggle, Phys. Rev. B 48, 2074 共1993兲. 43 S.-D. Mo, W. Y. Ching, M. F. Chisholm, and G. Duscher, Phys. Rev. B 60, 2416 共1990兲. 44 G. Cappellini, S. Bouette-Russo, B. Amadon, C. Noguera, and F. Finocchi, J. Phys.: Condens. Matter 12, 3671 共2000兲. 45 A., Frye, Ph. D. thesis, University of Pennsylvania 1999. 46 A., Frye, R. H. French, and D. A., Bonnell 共unpublished, 2001兲. 47 C. C. Ahn and O. L. Krivanek, EELS Atlas, A reference collection of electron energy-loss spectra covering all stable elements 共Gatan Inc., Pleasanton, CA, 1983兲.
Downloaded 21 Dec 2001 to 52.128.30.10. Redistribution subject to AIP license or copyright, see http://ojps.aip.org/japo/japcr.jsp