www.nature.com/scientificreports
OPEN
received: 09 June 2016 accepted: 30 August 2016 Published: 19 September 2016
Three-dimensional bulk electronic structure of the Kondo lattice CeIn3 revealed by photoemission Yun Zhang1,2, Haiyan Lu1, Xiegang Zhu1, Shiyong Tan1, Qin Liu1, Qiuyun Chen1, Wei Feng1, Donghua Xie1, Lizhu Luo1, Yu Liu3,4, Haifeng Song3,4, Zhengjun Zhang5 & Xinchun Lai1 We show the three-dimensional electronic structure of the Kondo lattice CeIn3 using soft x-ray angle resolved photoemission spectroscopy in the paramagnetic state. For the first time, we have directly observed the three-dimensional topology of the Fermi surface of CeIn3 by photoemission. The Fermi surface has a complicated hole pocket centred at the Γ-Z line and an elliptical electron pocket centred at the R point of the Brillouin zone. Polarization and photon-energy dependent photoemission results both indicate the nearly localized nature of the 4f electrons in CeIn3, consistent with the theoretical prediction by means of the combination of density functional theory and single-site dynamical meanfield theory. Those results illustrate that the f electrons of CeIn3, which is the parent material of CeMIn5 compounds, are closer to the localized description than the layered CeMIn5 compounds. Heavy fermion (HF) compounds CeMIn5 (M=C o, Rh, Ir) have attracted much attention in the last decade because of their novel properties1–6. For example, the 4f electrons of CeCoIn5 go through a transition from the localized state to the itinerant state and begin to participate in the modification of the Fermi surface (FS) at low temperatures1,7,8, resulting in an abnormal enhancement of the electron mass. Under certain conditions, those heavy f electrons condense into Cooper pairs, e.g., CeCoIn5 exhibits the highest superconductivity (SC) temperature recorded in Ce-based HF compounds2,3,9,10. However, there are still many unresolved questions regarding this system. First, there is not an explicit definition of the crossover line from the localized f electrons to the itinerant f electrons state. Second, the SC of CeCoIn5 cannot be explained by the BCS theory1,2,11,12. As layered compound, the structure of CeMIn5 is comprised of alternating layers of CeIn3 and MIn2. The three-dimensional (3D) component CeIn3 in CeMIn5 contributes all the f electrons and can be viewed as adding an effective positive pressure on the CeIn3 crystal at ambient pressure13,14. Further investigation of the electronic structure of CeIn3 is of particular importance for understanding the nature of CeMIn5. However, unlike the two-dimensional (2D) CeMIn5 compounds7,8, the electronic structure of CeIn3 is 3D. Consequently, the study of CeIn3 also provides an opportunity to study the influence of the layered structure on the properties of f electrons in this system. To investigate the properties of f electrons in CeIn3, many experiments have been previously performed. Transport15, optical conductivity spectra16, and inelastic neutron scattering17–19 results all indicate the existence of HF at low temperature, even inside the antiferromagnetic (AFM) phase below 10 K. Quantum oscillation measurements20,21 reveal that the HF states occupy only a small portion of the FS. Polycrystal photoemission measurements22, angular correlation of the electron-positron annihilation radiation23, and de Haas-van Alphen (dHvA)24 measurements all reveal the localized nature of f electrons at ambient pressure. Photoemission spectroscopy is a powerful tool to detect the reconstruction of the electronic structure and is often used to judge the nature of f electrons25–28. Photoemission spectroscopy can even be used to detect the SC energy gap in HF systems29. However, angle-resolved photoemission spectroscopy (ARPES) studies of CeIn3 have not been previously performed due to the difficulty of cleaving the sample and the complicated 3D electronic structure of CeIn3.
1 Science and Technology on Surface Physics and Chemistry Laboratory, Mianyang 621907, China. 2Department of Engineering Physics, Tsinghua University, Beijing 100084, China. 3Laboratory of Computational Physics, Institute of Applied Physics and Computational Mathematics, Beijing 100088, China. 4Software Center for High Performance Numerical Simulation, China Academy of Engineering Physics, Beijing 100088, China. 5Key Laboratory of Advanced Materials (MOE), School of Materials Science and Engineering, Tsinghua University, Beijing 100084, China. Correspondence and requests for materials should be addressed to Y.Z. (email:
[email protected]. cn) or X.L. (email:
[email protected])
Scientific Reports | 6:33613 | DOI: 10.1038/srep33613
1
www.nature.com/scientificreports/
(a)
13 o -1
kz (A )
a
12
R
Z
R
M
M
-1
R
0 o -1
1
d2
X
542eV
-1
d1 13K
0
1
595eV o -1
kx (A )
-1
R
A X
M
13K
R M
542eV
R Z
A
Brillouin zone
High Low
M
d3
Z
(c)
o -1
ky (A )
Z
k// (A )
(b)
(d) R
d
R
595eV
(e)
R
Z A
a
13K
0
1
LEED Pattern 75eV @ 15K
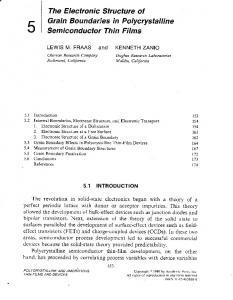
Figure 1. 3D FS map of CeIn3. (a) FS map in the kz-kxy plane at the Fermi energy integrated over a window of [EF − 100 meV, EF + 100 meV]. Photon energies are varied from 480 eV to 650 eV at a step of 4 eV. 2D FS maps in the kx-ky plane at the Fermi energy: (b) integrated over a window of [EF − 80 meV, EF + 80 meV] for a photon energy of 542 eV (kz~0) and (c) integrated over a window of [EF − 130 meV, EF + 130 meV] for a photon energy of 595 eV (kz~π). (d) Bulk BZ of CeIn3 and the high symmetry points. The green, yellow, and purple planes correspond to the FS slices in (a–c), respectively. (e) LEED pattern of the obtained CeIn3 (001) surface. The bright spots in the square lattice reflect the pristine 1 × 1 surface. In this work, the electronic structure of CeIn3 in the paramagnetic state is characterized using the soft x-ray ARPES technique for the first time. The 3D topology of the FS of CeIn3 is observed. The FS has a complicated hole pocket centred at the Γ-Z line and an elliptical electron pocket centred at the R point of the Brillouin zone (BZ). Photoemission results indicate the nearly localized nature of the 4f electrons in CeIn3, consistent with the theoretical predictions of the localized assumption. These results can help us to understand the behaviours of f electrons in CeIn3 and the derived CeMIn5 systems.
Results
Fermi surface mapping. The topology of the FS of CeIn3 is presented in Fig. 1. Figure 1(a) shows the slice
of the FS in the kz-kxy plane, observed by hν-dependent ARPES. Although the FS contours contain complicated features, we can obtain the symmetry of the electronic structure along kz direction. The slices of the FS observed by 542 eV and 595 eV photon energies correspond to the centre and boundary of the BZ, respectively. Besides, a complicated band structure d centred at the Γ-Z line and an elliptical shaped pocket a centred at R point are observed. To obtain a better understanding of the FS, two selected photon energies are adopted to characterize the FS contours in kx-ky plane. Figure 1(b,c) are the kx-ky maps at kz~0 (hν = 542 eV) and kz~π (hν = 595 eV), respectively. At the centre of the BZ in Fig. 1(b), the square-like pocket d3 at the M point and the double-ring band d2 centred at the Γpoint are observed. The spectral weight of d2 is quite strong in the Γ-X direction. At the boundary of the BZ in Fig. 1(c), a square structure d1 around the Z point and an elliptical structure a centred at the R point are displayed. The topology of the FS is highly 3D in nature and agrees with the dHvA experiment and the full-potential linear augmented plane wave calculations results24, which exhibit a complicated structure (denoted as d) centred at the Γ-Z line and an ellipsoid-like structure around the R point. Figure 1(e) shows the low energy electron diffraction (LEED) pattern of the obtained surface. A clean 1 × 1 pattern of the (001) surface is observed.
Valence band structure. An important goal in the study of a HF system is to understand the properties of f electrons. Previously, the polarized ARPES technique has been conducted to resolve the multi-orbit nature of the 3d states in iron-based superconductors and has proven to be an effective method to distinguish the different orbits of 3d electrons30. The HF compound YbRh2Si2 has also been studied using different light polarizations31,32. Some states in YbRh2Si2 are proven to possess dichroic effects, indicating that electronic states with the same symmetry can be identified by their similar response to a change of light polarization. Therefore, to
Scientific Reports | 6:33613 | DOI: 10.1038/srep33613
2
www.nature.com/scientificreports/
Analyzer slit ^ p
hν ^
e-
s
Y
(c1)
Z
3 21
e-
Mirror plane
(a)
3 1
M
5 Low
X
(b)
High
M X
(c2)
4
Sample
542eV
M
#1 #2
#1 p
#1 s
(d1) 6 7
X
(d2)
X
8 #2 s
#2 p o
-1
k// (A
)
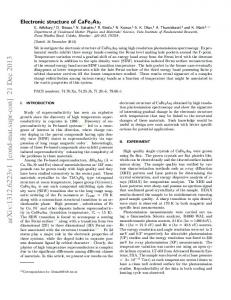
Figure 2. Polarization dependent valence band structure of CeIn3. (a) Experimental schematic of polarization dependent ARPES. (b) The centre of the BZ of CeIn3 and the locations of the momentum cuts. (c1,d1) Photoemission intensity plots obtained using 542 eV s-polarized light along the Γ-M and Γ-X directions, respectively. (c2,d2) Photoemission intensity plots obtained using 542 eV p-polarized light along the Γ-M and Γ -X directions, respectively. The black dashed lines represent the highest intensity of the ARPES results.
investigate the possible multi-orbit properties of the f electrons in the Ce-based HF system, we have performed polarization-dependent ARPES measurements in CeIn3. The experimental valence band structures of CeIn3 are displayed in Fig. 2. The electron-like band 1, band 2 centred at the Γ point and band 3 around the M point can be clearly observed in Fig. 2(c1), forming the double-ring structure d2 and the hole pocket d3 observed in Fig. 1(b). Band 4 is located at the bottom of band 3. Band 5 extends to high energy and nearly connects with band 1 around the Γpoint at approximately 1 eV binding energy (BE). Three bands (bands 6, 7 and 8) are observed along the Γ-X direction in Fig. 2(d1). The electron-like band 6 and hole-like band 7 are adjacent at the Fermi level. Band 8 is located at approximately 1.2 eV BE. Except for the band structures discussed above, two nearly non-dispersive bands located at EF and 300 meV BE are observed in Fig. 2(c1,d1). They have much weaker intensity weight than the other conduction bands and can be observed more clearly in Fig. S1 in the SI. The origin of the non-dispersive bands could be Kondo effect or spin-polaron effect33,34, which both lead to the many-body resonance in the electron density of states near EF. However, the temperature dependent resistivity of CeIn3 can be described by a function ρ~-lnT beyond the coherent temperature15,35, indicating Kondo physics takes effect. Therefore, the two non-dispersive bands correspond 1 1 8,22,25 to the 4f5/2 state and its spin orbit coupling (SOC) sideband 4f7/2 . The two flat bands are observed more clearly, as shown in Fig. 2(c2,d2), where significant changes occur when light is changed to p-polarized light. Bands 2, 4, and 5 along Γ-M and bands 6 and 7 along Γ-X disappear. Bands 1 and 3 and the two non-dispersive f bands remain. The suppression of the intensity of the conduction states is presumably due to the effect of the relative spatial orientations of the electronic states with the polarization vector of the light. The phenomena, by using p-polarized light, might be applied to other Ce-based HF compound, even with a low photoemission cross-section, as the suppression of non-f states makes f states in ARPES intensity plots clearer and purer. Another unresolved problem in CeIn3 is determining why the f bands can be clearly observed by off-resonance photoemission spectroscopy in Fig. 2. In contrast, for many other HF systems, f bands can only be observed using on-resonance photoemission8,25. We have studied the photoemission cross sections of different orbits of Ce and In as a function of photon energy. Ce (4f, 5d, 6s) and In (5s, 5p) states were considered as valence states36. In the photon energy range from 500 eV to 900 eV, the total photoemission cross section is mainly contributed by 4f electrons. The contribution from Ce (5d, 6s) and In (5s, 5p) are approximately one order-of-magnitude smaller37.
Calculations. The comparison between the experimental band structures with the calculation results is an effective means to judge the properties of the f electrons. On the other hand, density functional theory merged with the single-site dynamical mean-field theory (DFT+DMFT) is probably the most powerful established method to study the electronic structures of strongly correlated materials. DFT+DMFT has been successfully applied in the studies of many HF systems, such as the temperature-dependent localized-itinerant transition in Scientific Reports | 6:33613 | DOI: 10.1038/srep33613
3
www.nature.com/scientificreports/
2 (a)
(b)
E-EF(eV)
1 0
EF
7
-1
6
2
1
4
8 -2
5
Intensity(a.u.)
(c)
1
f weigh
1
(d)
2 3
EF
7
-0.6eV
M
f
11.6K M
X
EF
3
6
-0.8eV
M
X
X
Figure 3. (a) The band structure calculated using the DFT+DMFT approach for CeIn3. (b) Partial density of states for the Ce-4f states of CeIn3 using DFT+DMFT. (c,d) MDCs display along Γ-M and Γ-X directions at kz~0, respectively. The purple dotted lines are guides to eye, tracing the peaks of the MDCs. The orange rectangle marks the f states. The green rectangles mark the renormalization of band 7.
CeIrIn54,5, We compare the ARPES results with the DFT+DMFT band calculations of CeIn3 in Fig. 3. First, all the valence bands 1–8 in Figs 2 and 3(c,d) can be clearly duplicated in the calculation results, as are the very flat and non-dispersive f bands located at EF and the vicinity. The flat f bands appear to be constant and non-dispersive over all angles and have much weaker intensity weight than those of the other conduction bands, consistent with our experimental results in Fig. 2 and Fig. S1. This phenomenon does not agree well with the case of CeIrIn55, the f states of which have strong intensity weight and form the coherent peak on EF. Besides, the f states of CeIrIn5 show obvious dispersions around EF, induced by the strong hybridization between f states and conduction states. This indicates that the f electrons of CeIn3 have different behaviours compared with those of CeIrIn5, which have itinerant f states at low temperature. Second, a small renormalization of conduction band 7 on EF is displayed in both the calculation results in Fig. 3(a) and the MDCs in Fig. 3(d). This should be induced by the interaction between f states and the band 7. However, the interaction is so weak that the coherent peak does not form. In fact, if an additional pressure is added on CeIn3, the interaction will be greatly enhanced. Band 7 will have obvious band bending and form the coherent peak on EF together with the hybridized f band38. Through comparison of the experimental bands with the calculated results, we can conclude that the experimental band structure of CeIn3 at ambient pressure and low temperature can be described by the nearly localized model.
On-resonance photoemission. To clarify the explicit band structures of the f electrons, Fig. 4(a) shows
on-resonance photoemission intensity plot of CeIn3. The dense and non-dispersive f bands emerge near EF and ~300 meV BE, enhanced by the 3d-4f excitation. It is well known that the f band at EF is the tail of the Kondo res1 onance (KR) peak, corresponding to the Ce-4 f5/2 final state. The peak at 300 meV BE is the SOC sideband and 1 1 band of CeIn3 is intersected by the conduction band corresponds to the Ce-4 f7/2 final state. Although the Ce-4 f5/2 Scientific Reports | 6:33613 | DOI: 10.1038/srep33613
4
www.nature.com/scientificreports/
(a)
R
Z
(b)
f
1
f
0
f
1
Low
882.5eV
High
o
-1
k// (A
)
E-EF(eV)
(c) E+
EF
f f
1
E-
0
f o
0
-1
k// (A
)
Figure 4. On-resonance photoemission intensity plot of CeIn3. (a) Photoemission intensity plot along the Z-R direction. The red dashed lines mark the two flat bands at −1.4 eV and −2 eV. (b) Angle-integrated photoemission spectroscopy of the ARPES result in (a). (c) Schematic of the Anderson lattice model. The dashed lines are the dispersive valence band and the non-dispersive f bands. The dotted line indicates the location of EF. For a finite hybridization, an energy gap opens, and two k-dependent branches E+and E− form. The lower hybridized band E−crosses EF and forms the heavy particles. The blue shaded area is the angleintegrated photoemission spectroscopy curve within the hybridized model.
at EF, it does not show any dispersion and does not open an energy gap to form the k-dependent bands E−, as shown in Fig. 4(c). In the Periodic Anderson Model (PAM)39, if the f electrons are itinerant and have periodicity in the lattice, it should form dispersive KR peaks crossing E F in unoccupied states, as shown in the pressure-induced itinerant state for CeIn338. However, no crossing of f electron bands and no energy gap for CeIn3 are observed at ambient pressure in Fig. 4(a). From another aspect, as shown in Fig. 4(b), except for the f 1 final states near EF, the non-dispersive structures at approximately 1.4 eV and 2 eV BE are also visible. These arise from pure charge excitations of the trivalent Ce ion (4f 1 → 4f 0) and are referred to the ionization peaks22. The two f bands have been observed in the Ce-termination surface in CeRh2Si240, which exhibits the nature of localized f electrons. Usually, if the hybridization strength is strong, then the f 0 peak is much weaker than the f 1 final state, as shown in the blue shaded area in Fig. 4(c). If the hybridization strength is weak, then the intensity of f 0 peak is strong22,41, as demonstrated by recent calculation results using the DFT+DMFT approach by H.Y.L38. H.Y.L et al. indicate that the 4f electrons of CeIn3 will undergo a localized-itinerant transition under pressure, consistent with the dHvA results24. At ambient pressure, the 4f electrons of CeIn3 are localized, and the intensity of f 1 final state is comparable with that of f 0 peak. With the crystal volume decreasing under pressure, the intensity of the f 1 final state quickly increases, and the intensity of f 0 peak decreases. When the crystal volume of CeIn3 decreases to 65% of the volume at ambient pressure, the f 1peak is quite strong, and the f 0 peak nearly disappears. As the intensity of the f 0 peak is comparable with that of f 1 final state in CeIn3 in Fig. 4(b), the angle-integrated photoemission spectroscopy result is also consistent with the calculation result of CeIn3 under ambient pressure. In summary, the f electrons of CeIn3 are close to the description of the nearly localized model, similar to the angle-integrated photoemission spectroscopy results of f localized compounds CeRhIn5 and CeRh2Si240,42.
Discussion
We have compared the ground states between CeIn3 and CeMIn5 to illustrate the different properties of the f electron. In fact, there are three possible ground states in the HF systems based on the Doniach phase diagram43 at low temperature: i) the mixed valence ground state with extremely large hybridization strength between the f electrons and the conduction electrons and 0